. 2020 Jan;7(1):015006.
doi: 10.1117/1.NPh.7.1.015006. Epub 2020 Feb 4.

Retinal analysis of a mouse model of Alzheimer's disease with multicontrast optical coherence tomography

Affiliations

Retinal analysis of a mouse model of Alzheimer's disease with multicontrast optical coherence tomography

Danielle J Harper et al. Neurophotonics. 2020 Jan.

Abstract

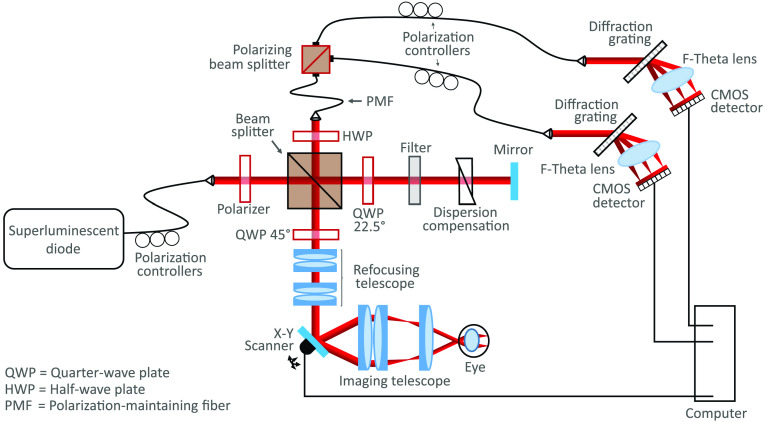
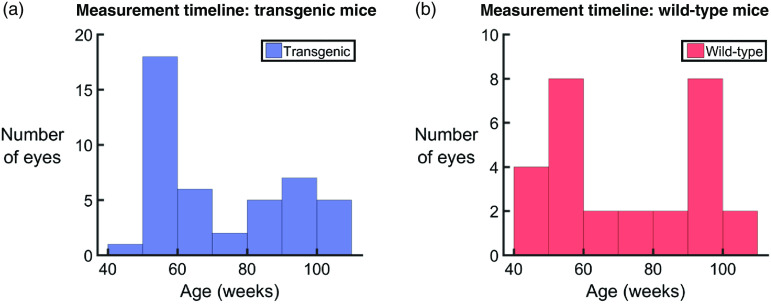
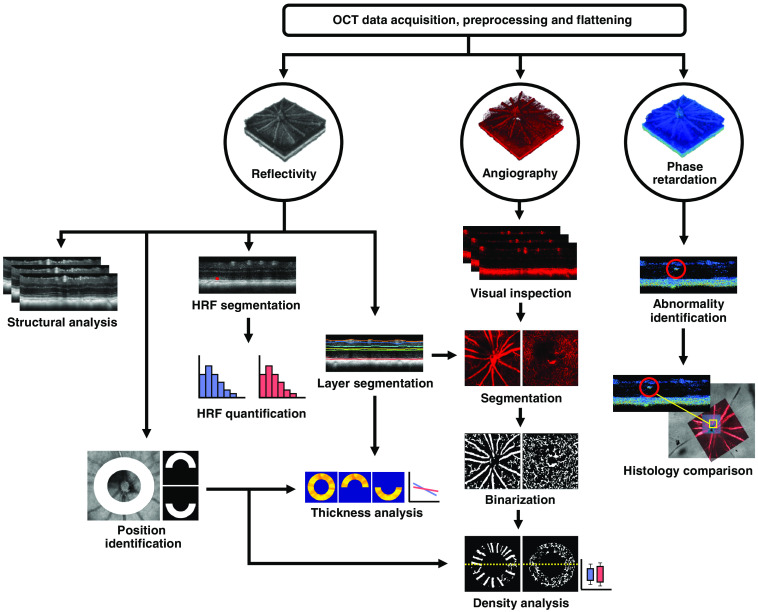
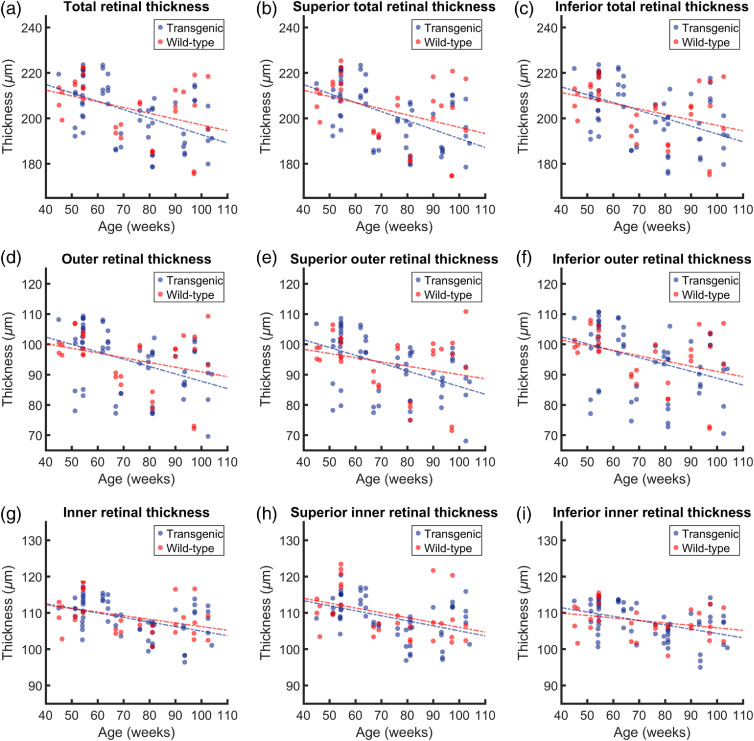
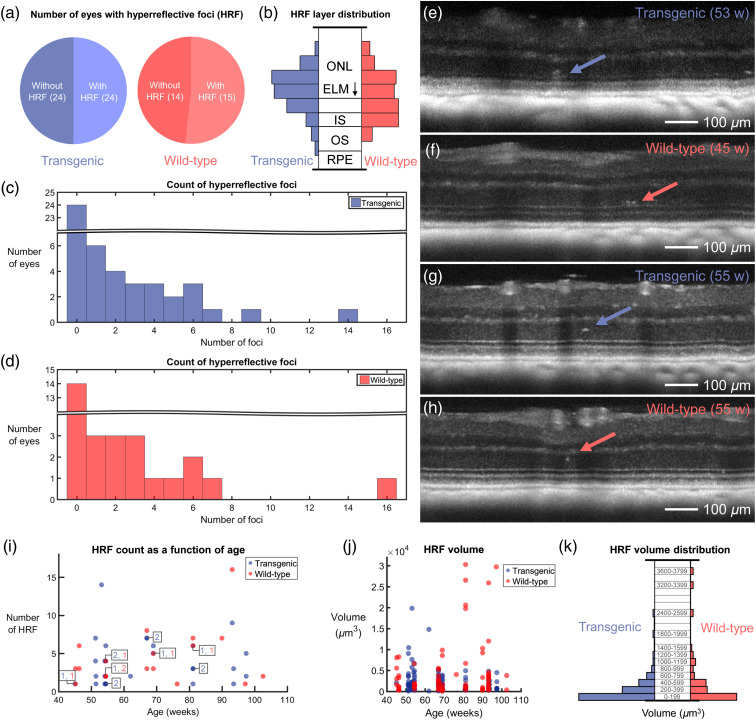
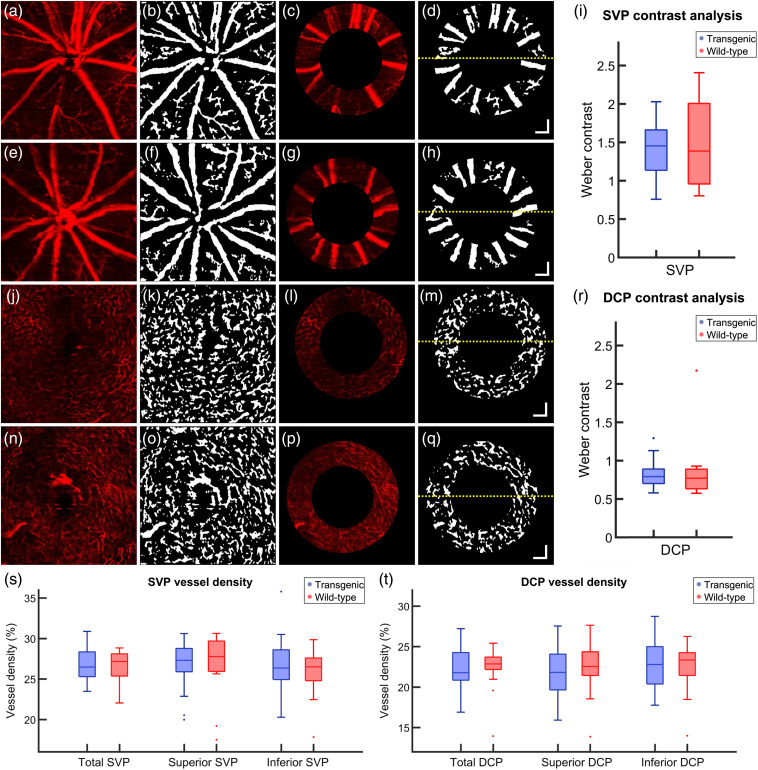
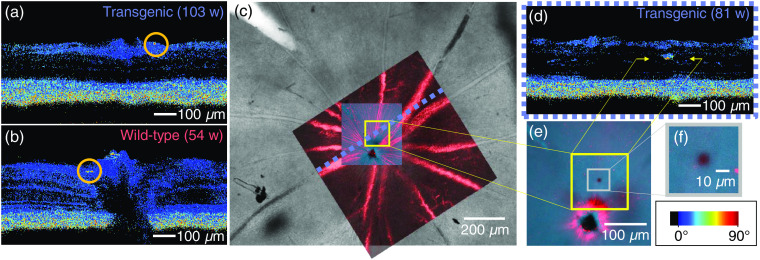
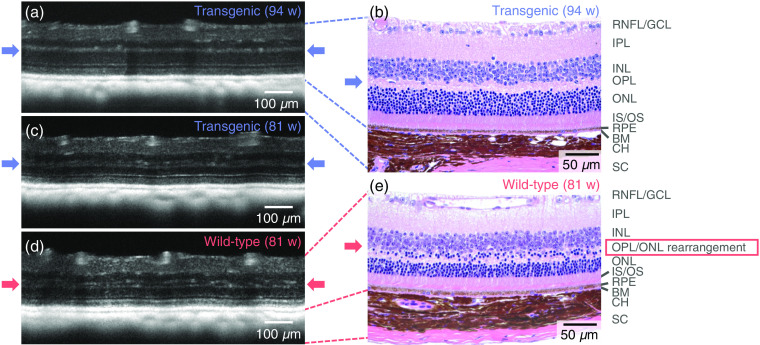
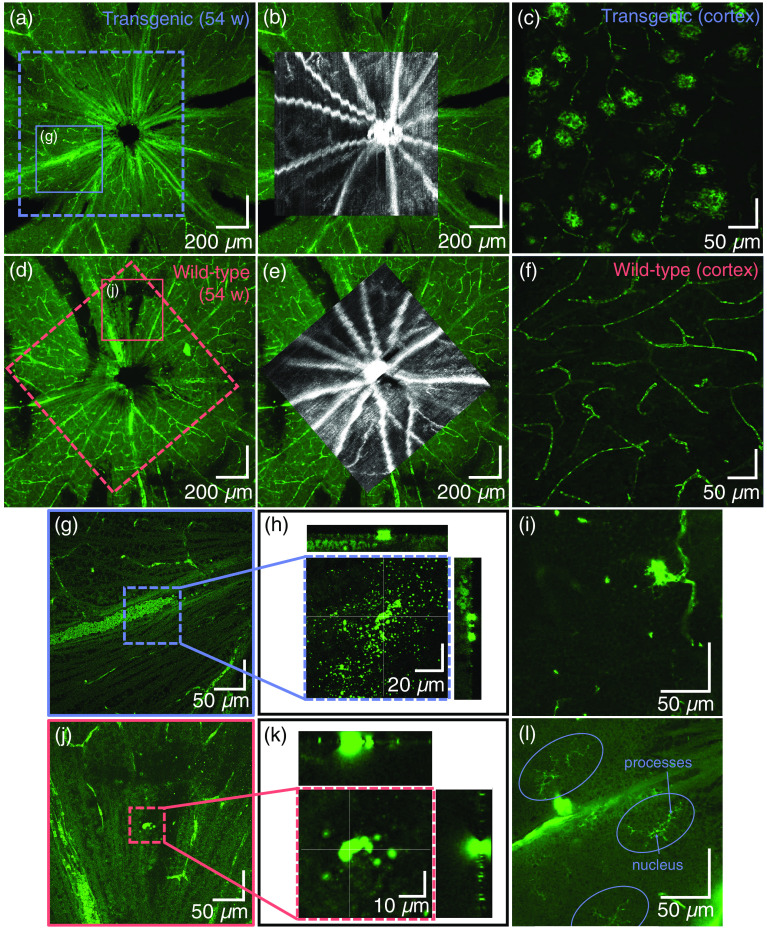
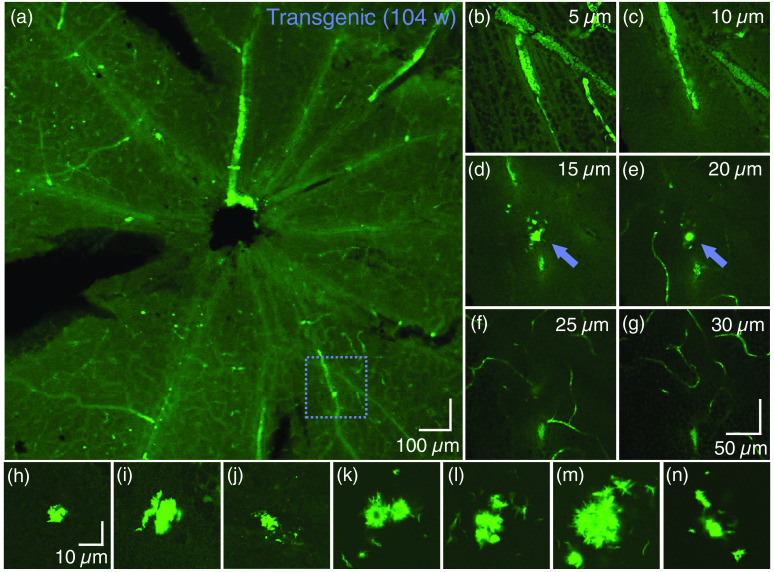
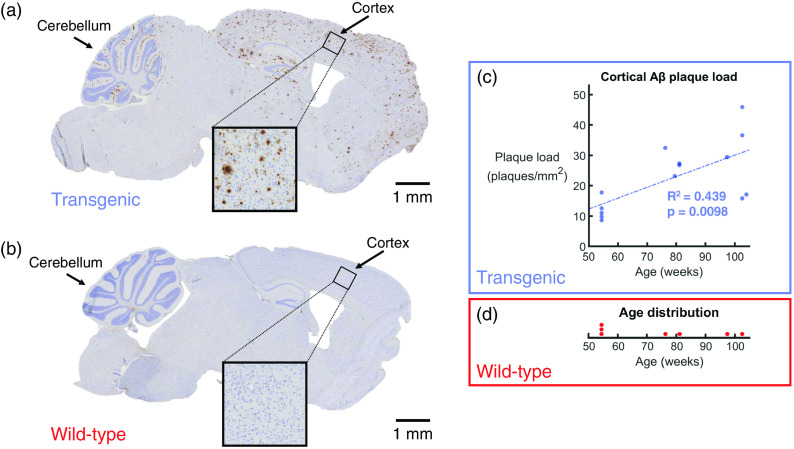
Significance. Recent Alzheimer's disease (AD) patient studies have focused on retinal analysis, as the retina is the only part of the central nervous system that can be imaged noninvasively by optical methods. However, as this is a relatively new approach, the occurrence and role of retinal pathological features are still debated. Aim. The retina of an APP/PS1 mouse model was investigated using multicontrast optical coherence tomography (OCT) in order to provide a documentation of what was observed in both transgenic and wild-type mice. Approach. Both eyes of 24 APP/PS1 transgenic mice (age: 45 to 104 weeks) and 15 age-matched wild-type littermates were imaged by the custom-built OCT system. At the end of the experiment, retinas and brains were harvested from a subset of the mice (14 transgenic, 7 age-matched control) in order to compare the in vivo results to histological analysis and to quantify the cortical amyloid beta plaque load. Results. The system provided a combination of standard reflectivity data, polarization-sensitive data, and OCT angiograms. Qualitative and quantitative information from the resultant OCT images was extracted on retinal layer thickness and structure, presence of hyper-reflective foci, phase retardation abnormalities, and retinal vasculature. Conclusions. Although multicontrast OCT revealed abnormal structural properties and phase retardation signals in the retina of this APP/PS1 mouse model, the observations were very similar in transgenic and control mice.

Keywords: Alzheimer’s disease; amyloid beta; histology; optical coherence tomography; polarization; retina.


Figures

Fig. 1
Fig. 1
A modified version of the PS-OCT system first described by Fialová et al. A refocusing telescope was added to the system to allow focus correction of each individual mouse eye.
Fig. 2
Fig. 2
Histogram representations of the number of eyes used for analysis. (a) A total of 44 eyes from 24 APP/PS1 transgenic mice and (b) 28 eyes from 15 wild-type littermates were imaged within an age range of 45 to 104 weeks.
Fig. 3
Fig. 3
A flowchart of the multicontrast OCT postprocessing pipeline, which consists primarily of reflectivity, angiography, and phase retardation data. HRF, hyper-reflective foci.
Fig. 4
Fig. 4
Analysis of retinal thickness as a function of age for both transgenic and wild-type mice. Total retinal thickness measured around (a) the whole annulus, then subdivided into (b) a superior half and (c) an inferior half. Outer retinal thickness measured (d) around the whole annulus, (e) in the superior half and (f) in the inferior half. Inner retinal thickness measured (g) around the whole annulus, (h) in the superior half and (i) in the inferior half. The corresponding statistical evaluation can be found in Tables 1 and 2, and the gradients of the slopes can be found in Table 3.
Fig. 5
Fig. 5
Results of HRF analysis. (a) Pie charts indicating the number of eyes with and without HRF for both transgenic and wild-type mice. (b) HRF probability distribution displayed with respect to outer retinal layer position for transgenic and wild-type mice. The distributions are very similar, with most HRF appearing near the ELM. ONL, outer nuclear layer; IS, inner segments; OS, outer segments; and RPE, retinal pigment epithelium. (c) Histogram of HRF occurrence in transgenic mice. (d) Histogram of HRF occurrence in wild-type mice. (e)–(h) Some examples of the appearance of HRF in OCT reflectivity images. Each image is a maximum intensity projection over four consecutive B-scans, where each B-scan is already averaged 5 times and plotted on a logarithmic scale. HRF located above the ELM in (e) both the transgenic mouse retina and (f) the wild-type retina. HRF located in the middle of the ONL in both (g) the transgenic mouse retina and (h) the wild-type retina. Ages of mice in weeks (w) are indicated in (e)–(h). (i) HRF count as a function of age. Overlapping datapoints are indicated with color-coded numbers. (j) HRF volume plotted as a function of mouse age. (k) HRF volume distribution for transgenic and wild-type mice. In (j) and (k), one data outlier was excluded (wild-type, age: 81 weeks, HRF volume: 7.3×10⁴  μm3).
Fig. 6
Fig. 6
(a)–(h) Example of OCTA analysis of the SVP of a (a)–(d) transgenic mouse and (e)–(h) a wild-type control. (a), (e) En face OCTA depth projection through the SVP. (b), (f) Binary representation of the SVP with white pixels corresponding to blood vessels. (c), (g) Annulus around the ONH as provided by the intensity-based contrast data. (d), (h) Binarized annulus, where the yellow dashed line corresponds to the boundary between the superior retina (above) and the inferior retina (below). (i) Weber contrast comparing the intensity of the angiogram signal of the blood vessels to the intensity of the background in the SVP. (j)–(q) Example OCTA analysis of the DCP of a (j)–(m) transgenic mouse and a (n)–(q) wild-type control. (j), (n) En face OCTA depth projection through the DCP. (k), (o) Binary representation of the DCP with white pixels corresponding to blood vessels. (l), (p) Annulus around the ONH as provided by the intensity-based contrast data. (m), (q) Binarized annulus, where the yellow dashed line corresponds to the boundary between the superior retina (above) and the inferior retina (below). (r) Weber contrast comparing the intensity of the angiogram signal of the blood vessels to the intensity of the background in the DCP. (s)–(t) Vessel density analysis. Total, superior, and inferior vessel density calculated for transgenic and wild-type mice in the (s) SVP and the (t) DCP. Age (a)–(d), (j)–(m): 93 weeks, age (e)–(h), (n)–(q): 76 weeks. Single points in (r)–(t) correspond to data outliers. All scale bars=100  μm.
Fig. 7
Fig. 7
Depolarizing deposits. (a) Example of depolarization along a vessel wall (indicated by orange circle). (b) Example of depolarization near the ONH (indicated by orange circle). (c) Identification of migrated melanin. After wholemounting the retina, the OCT angiography data (in red) were used to correlate the vessels measured in vivo to the overview of the retina provided by the ex vivo preparation (gray scale). (d) PS-OCT image showed a location of abnormally high-phase retardation in the INL (indicated by yellow arrows). Scale bar in bottom right applies to (a), (b), and (d). (e) A high-resolution confocal microscopy scan was acquired at the area of interest marked in (c), at the depth position marked by the yellow arrows in (d). A cluster of melanin is revealed at this location, as seen in (f).
Fig. 8
Fig. 8
Demonstration of retinal layer abnormalities. The OPL is indicated with arrows. (a) A transgenic mouse retina with a typical appearance—the outer plexiform layer appears as one single hyper-reflective band. (b) H&E-stained histological slice of the same mouse retina as in (a). (c) A transgenic mouse retina with the OPL disrupted, appearing as a double-banded hyper-reflective layer. This effect was observed in 3/24 transgenic mice. (d) A similar double-banding effect was also observed in 3/15 wild-type littermates. (e) H&E-stained histological slice of the same mouse retina as in (d). The structural correlate of the double-banded OCT signal in the OPL region appears to be rearranged proximal outer nuclear layer somata. RNFL, retinal nerve fiber layer; GCL, ganglion cell layer; IPL, inner plexiform layer; INL, inner nuclear layer; OPL, outer plexiform layer; ONL, outer nuclear layer; IS/OS, inner/outer segment junction; RPE, retinal pigment epithelium; BM, Bruch’s membrane; CH, choroid; and SC, sclera. Age: (a)–(b) 94 weeks and (c)–(e) 81 weeks.
Fig. 9
Fig. 9
Representative depictions of the ex vivo retina following fluorescent staining against Aβ. (a) Retinal wholemount of a transgenic mouse and (b) its correlation to in vivo OCT data. (c) The positive control (the cortex of the transgenic mouse) shows fluorescent labeling of Aβ plaques and capillaries. (d) Retinal wholemount of a wild-type mouse and (e) its correlation to in vivo OCT data. (f) In the cortex of the wild-type mouse (negative control), only capillaries are labeled. (g)–(l) Some typical observations seen throughout transgenic and wild-type mouse retinas. (g) When zooming in to the surface of the retina in the location indicated in the dashed box (h), some scattered bright spots appear. The orthogonal views (positions indicated by the white cross hairs), however, show that these lie only on the surface of the retina. (i) Fluorescent signal positioned at a capillary junction. (j)–(k) Similar to (g)–(h), single, larger accumulations of fluorescent tracer find themselves at the interface of vitreous and retina, but not within the retina. (l) Microglia, indicated by ovals, are identifiable by their dendritic processes and are also found throughout the retina. This image was acquired within the GCL.
Fig. 10
Fig. 10
Candidates for fibrillary Aβ detected in the retina of one mouse, as identified by confocal microscopy. (a) Overview of the ex vivo retina (left eye) acquired with a 10× magnification objective lens. (b)–(g) En face planes at 5  μm intervals at the position identified by the dashed box in (a), where the zero-position is at the interface of vitreous and GCL. The fluorescent abnormality, i.e., the Aβ candidate, is indicated by the arrow in (d) and (e). Scale bar in (g) is valid for (b)–(g). Images were acquired with a 40× magnification objective lens. (h)–(n) Seven further Aβ candidates were identified in the retina of the right eye of the same mouse (all acquired with a 40× magnification objective lens). All structures were detected <40  μm from the surface of the retina, i.e., between the RNFL and IPL. Scale bar in (h) is valid for (h)–(n).
Fig. 11
Fig. 11
Quantification of the plaques per mm2 in the cortex. (a) Histological slice of a transgenic mouse brain, immunohistochemically stained against Aβ. Aβ plaques appear as brown deposits. Age: 103 weeks. (b) Following the same staining protocol, the wild-type littermates do not show any Aβ plaques in the cortex. Age: 103 weeks. (c) Count of plaques per mm2 for a subset of 14 transgenic mice. Linear regression analysis showed a statistically significant trend of an increasing plaque load with age (R2=0.439, p=0.0098). (d) The age distribution of the seven wild-type control mice that were examined, none of which showed any Aβ plaques.

References

    1. Jack C. R., et al. , “Serial PIB and MRI in normal, mild cognitive impairment and Alzheimer’s disease: implications for sequence of pathological events in Alzheimer’s disease,” Brain 132, 1355–1365 (2009).BRAIAK10.1093/brain/awp062 - DOI - PMC - PubMed
    1. Alzheimer’s Association, “2019 Alzheimer’s disease facts and figures,” Alzheimers Dement. 15, 321–387 (2019).10.1016/j.jalz.2019.01.010 - DOI
    1. Funato H., et al. , “Quantitation of amyloid beta-protein (a beta) in the cortex during aging and in Alzheimer’s disease,” Am. J. Pathol. 152(6), 1633–1640 (1998).AJPAA4 - PMC - PubMed
    1. Hurtado-Puerto A. M., Russo C., Fregni F., Alzheimer’s Disease, pp. 297–338, Springer, New York: (2018).
    1. Dudeffant C., et al. , “Contrast-enhanced MR microscopy of amyloid plaques in five mouse models of amyloidosis and in human Alzheimer’s disease brains,” Sci. Rep. 7(1), 4955 (2017).SRCEC310.1038/s41598-017-05285-1 - DOI - PMC - PubMed