. 2020 Jan 24;6(4):eaay5206.
doi: 10.1126/sciadv.aay5206. eCollection 2020 Jan.

Direct observation of glucose fingerprint using in vivo Raman spectroscopy

Affiliations

Direct observation of glucose fingerprint using in vivo Raman spectroscopy

Jeon Woong Kang et al. Sci Adv. .

Abstract

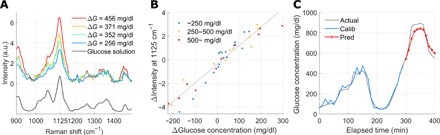
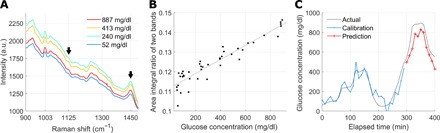
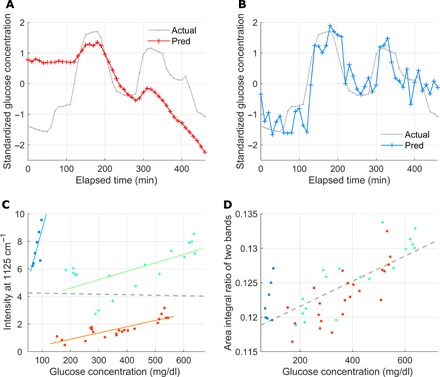
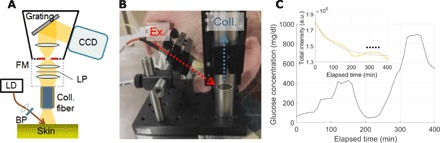
Noninvasive blood glucose monitoring has been a long-standing dream in diabetes management. The use of Raman spectroscopy, with its molecular specificity, has been investigated in this regard over the past decade. Previous studies reported on glucose sensing based on indirect evidence such as statistical correlation to the reference glucose concentration. However, these claims fail to demonstrate glucose Raman peaks, which has raised questions regarding the effectiveness of Raman spectroscopy for glucose sensing. Here, we demonstrate the first direct observation of glucose Raman peaks from in vivo skin. The signal intensities varied proportional to the reference glucose concentrations in three live swine glucose clamping experiments. Tracking spectral intensity based on linearity enabled accurate prospective prediction in within-subject and intersubject models. Our direct demonstration of glucose signal may quiet the long debate about whether glucose Raman spectra can be measured in vivo in transcutaneous glucose sensing.


Figures

Fig. 1
Fig. 1. Glucose Raman spectra from in vivo experiments and linearity between their spectral intensity and the corresponding blood glucose concentration.
(A) Four subtraction spectra with four ΔG (glucose concentration difference) values. The spectra show the characteristic fingerprint, which is identical with that of aqueous glucose solution and the increase in peak intensity at 1125 cm−1 with the increased changes in glucose concentration. a.u., arbitrary units. (B) Linear relationship between the change in the Raman peak’s intensity and the corresponding change in glucose concentration over the entire recording time (R = 0.95). The differential peak intensity is obtained by subtracting the time-moving subject-specific spectrum, lagging 20 min behind spectra to be subtracted. Three different colored dots represent three ranges of actual glucose concentration ranges: blue for lower than 250 mg/dl, yellow between 250 and 500 mg/dl, and red for 500 mg/dl and higher. The linear relationship is maintained as R = 0.97, 0.96, and 0.98, in the range lower than 250 mg/dl, between 250 and 500 mg/dl, and 500 mg/dl and higher, respectively. (C) Prospective prediction by simple linear regression based on the peak intensity change. The blue line shows the calibration result, and the red line shows the prediction result (R = 0.95 and MARD = 6.6% in prediction).
Fig. 2
Fig. 2. The linearity between the band area ratio and glucose concentration.
(A) Averaged spectra during each of the four clamping periods. The average glucose concentration for each clamping period is shown in the legend. The black arrows indicate the glucose Raman peak at 1125 cm−1 and the protein/lipid peak at 1450 cm−1. (B) Glucose concentration versus the band area ratio corresponding to the black arrows in (A). The solid line displays the result of linear fitting (R = 0.94). (C) Prospective prediction using the band area ratio in (B) (R = 0.94, MARD = 13.4%).
Fig. 3
Fig. 3. Prediction in intersubject recordings.
A model is trained with recordings of trials 1 and 2 and is used for prediction in trial 3 recordings. (A) Prediction using PLS regression with full-range background-subtracted spectra (R = 0.17). (B) Prediction using MLR with four band area features. Three are extracted from the glucose-specific bands, and the last one is from a skin component peak (R = 0.82). (C) Linearity between the Raman peak intensity and glucose concentration for trial 3 is observed only in each of the three time-continuous parts of the recordings (separated by color, R = 0.74 on average), but not for the entire recording (R = −0.02) with the spectra subtraction method. (D) The linearity improves with the same recordings as in (C) when the ratio of the two band area features is used (R = 0.73).
Fig. 4
Fig. 4. Off-axis Raman excitation and collection configuration.
(A) Radiance distribution of 830-nm laser in skin model with a configuration of the oblique angle (off-axis) laser illumination. Scale bar, 500 μm. (B) Radiance distribution of 830-nm laser in the same skin model when a conventional probe (on-axis) is applied (the same scale bar applied). (C) Fraction of sampling voxels in off-axis and on-axis configuration as a function of depth in the confined region.
Fig. 5
Fig. 5. Raman spectroscopy system, actual probe setup with a subject, and glucose profile during experiment.
(A) Schematic diagram of Raman spectroscopy system for in vivo animal (swine) skin measurement. FM, f number matcher; LP, longpass filter; LD, laser diode; BP, bandpass filter. (B) Photograph of Raman probe setup with oblique illumination and vertical collection equipped on top of an anesthetized pig (photo credit: Jeon Woong Kang, MIT). (C) Glucose profile during the glucose clamping experiment in trial 1. Exponential time decay of fluorescence from the skin in the inset (spectrum wavelength integration; actual data in the yellow dotted line and its exponential approximation in the gray line). The dotted black line in the inset indicates the time period during which fluorescence stays nearly flat.

References

    1. Ogurtsova K., da Rocha Fernandes J. D., Huang Y., Linnenkamp U., Guariguata L., Cho N. H., Cavan D., Shaw J. E., Makaroff L. E., IDF diabetes atlas: Global estimates for the prevalence of diabetes for 2015 and 2040. Diabetes Res. Clin. Pract. 128, 40–50 (2017). - PubMed
    1. Kirk J. K., Stegner J., Self-monitoring of blood glucose: Practical aspects. J. Diabetes Sci. Technol. 4, 435–439 (2010). - PMC - PubMed
    1. Renard E., Monitoring glycemic control: The importance of self-monitoring of blood glucose. Am. J. Med. 118, 12S–19S (2005). - PubMed
    1. Heinemann L., Finger pricking and pain: A never ending story. J. Diabetes Sci. Technol. 2, 919–921 (2008). - PMC - PubMed
    1. Karter A. J., Ferrara A., Darbinian J. A., Ackerson L. M., Selby J. V., Self-monitoring of blood glucose: Language and financial barriers in a managed care population with diabetes. Diabetes Care 23, 477–483 (2000). - PubMed

Publication types