

Expanding the molecular and phenotypic spectrum of truncating MT-ATP6 mutations
- PMID: 32042910
- PMCID: PMC6984135
- DOI: 10.1212/NXG.0000000000000381
Expanding the molecular and phenotypic spectrum of truncating MT-ATP6 mutations
Abstract
Objective: To describe the clinical and functional consequences of 1 novel and 1 previously reported truncating MT-ATP6 mutation.
Methods: Three unrelated probands with mitochondrial encephalomyopathy harboring truncating MT-ATP6 mutations are reported. Transmitochondrial cybrid cell studies were used to confirm pathogenicity of 1 novel variant, and the effects of all 3 mutations on ATPase 6 and complex V structure and function were investigated.
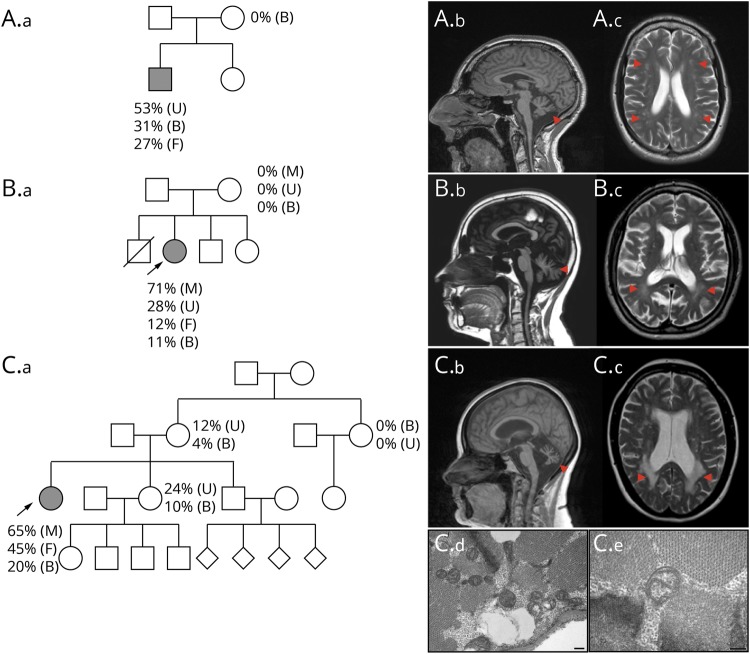
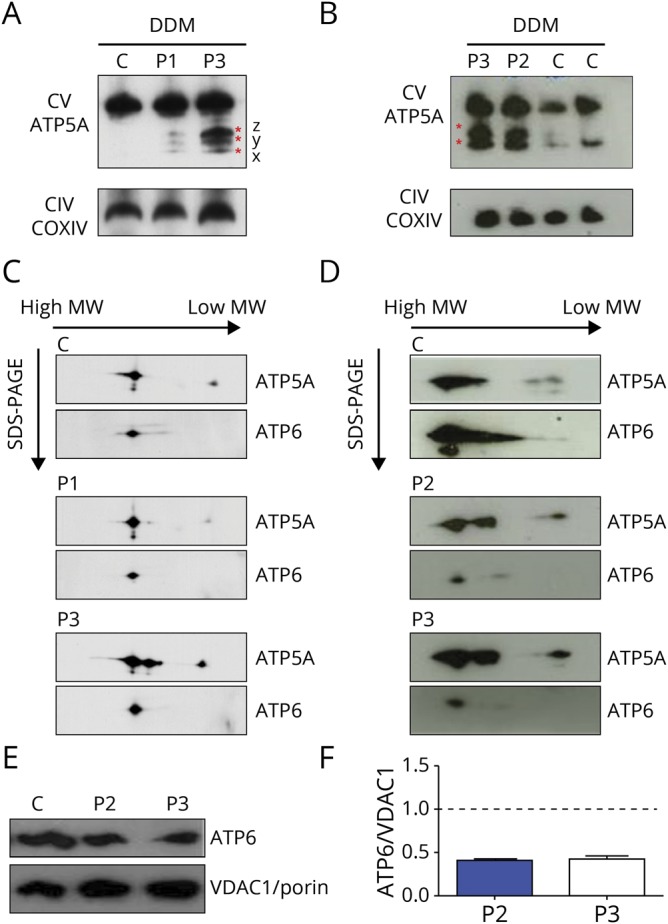
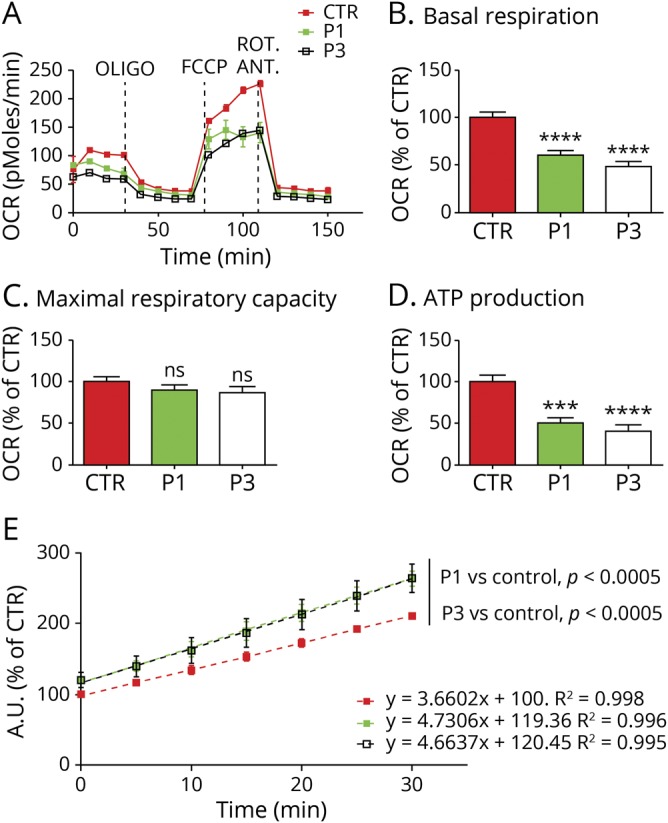
Results: Patient 1 presented with adult-onset cerebellar ataxia, chronic kidney disease, and diabetes, whereas patient 2 had myoclonic epilepsy and cerebellar ataxia; both harbored the novel m.8782G>A; p.(Gly86*) mutation. Patient 3 exhibited cognitive decline, with posterior white matter abnormalities on brain MRI, and severely impaired renal function requiring transplantation. The m.8618dup; p.(Thr33Hisfs*32) mutation, previously associated with neurogenic muscle weakness, ataxia, and retinitis pigmentosa, was identified. All 3 probands demonstrated a broad range of heteroplasmy across different tissue types. Blue-native gel electrophoresis of cultured fibroblasts and skeletal muscle tissue confirmed multiple bands, suggestive of impaired complex V assembly. Microscale oxygraphy showed reduced basal respiration and adenosine triphosphate synthesis, while reactive oxygen species generation was increased. Transmitochondrial cybrid cell lines studies confirmed the deleterious effects of the novel m.8782 G>A; p.(Gly86*) mutation.
Conclusions: We expand the clinical and molecular spectrum of MT-ATP6-related mitochondrial disorders to include leukodystrophy, renal disease, and myoclonic epilepsy with cerebellar ataxia. Truncating MT-ATP6 mutations may exhibit highly variable mutant levels across different tissue types, an important consideration during genetic counseling.
Copyright © 2020 The Author(s). Published by Wolters Kluwer Health, Inc. on behalf of the American Academy of Neurology.
Figures
References
-
- Nijtmans LG, Henderson NS, Attardi G, Holt IJ. Impaired ATP synthase assembly associated with a mutation in the human ATP synthase subunit 6 gene. J Biol Chem 2001;276:6755–6762. - PubMed
-
- Verny C, Guegen N, Desquiret V, et al. . Hereditary spastic paraplegia-like disorder due to a mitochondrial ATP6 gene point mutation. Mitochondrion 2011;11:70–75. - PubMed
Grants and funding
- MC_UP_1002/1/MRC_/Medical Research Council/United Kingdom
- MC_UU_00015/5/MRC_/Medical Research Council/United Kingdom
- MR/K000608/1/MRC_/Medical Research Council/United Kingdom
- G108/638/MRC_/Medical Research Council/United Kingdom
- G0802760/MRC_/Medical Research Council/United Kingdom
- G1001253/MRC_/Medical Research Council/United Kingdom
- MC_EX_MR/P007031/1/MRC_/Medical Research Council/United Kingdom
- MRF-155-0005-RG-ZEVI-C0784/MRF_/MRF_/United Kingdom
- R605/0717/DMT_/The Dunhill Medical Trust/United Kingdom
- MRF-155-0001-S-MARTI/MRF_/MRF_/United Kingdom
- MR/S002065/1/MRC_/Medical Research Council/United Kingdom
- G0601943/MRC_/Medical Research Council/United Kingdom
- MRF-155-0002-RG-ZEVIA/MRF_/MRF_/United Kingdom
- MR/S01165X/1/MRC_/Medical Research Council/United Kingdom
LinkOut - more resources
Full Text Sources