

Three-Dimensional Quantitative Magnetic Resonance Imaging of Epiphyseal Cartilage Vascularity Using Vessel Image Features: New Insights into Juvenile Osteochondritis Dissecans
- PMID: 32043049
- PMCID: PMC6959910
- DOI: 10.2106/JBJS.OA.19.00031
Three-Dimensional Quantitative Magnetic Resonance Imaging of Epiphyseal Cartilage Vascularity Using Vessel Image Features: New Insights into Juvenile Osteochondritis Dissecans
Abstract
We introduce a quantitative measure of epiphyseal cartilage vascularity and examine vessel networks during human skeletal maturation. Understanding early morphological changes in the distal femoral condyle is expected to provide information on the pathogenesis of developmental diseases such as juvenile osteochondritis dissecans.
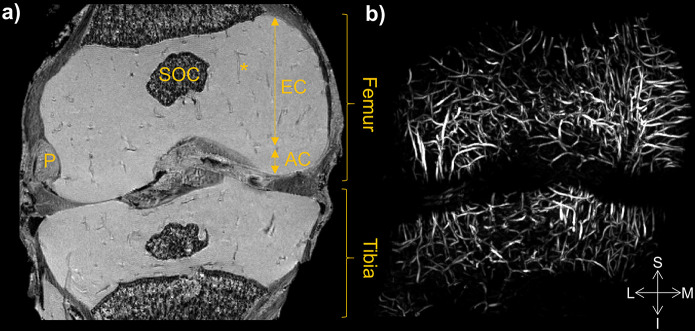
Methods: Twenty-two cadaveric knees from donors ranging from 1 month to 10 years of age were included in the study. Images of bone, cartilage, and vascularity were acquired simultaneously with a 3-dimensional gradient-recalled-echo magnetic resonance imaging (MRI) sequence. The secondary ossification center volume and total epiphysis cartilage volume ratio and articular-epiphyseal cartilage complex and epiphyseal cartilage widths were measured. Epiphyseal cartilage vascularity was visualized for 9 data sets with quantitative susceptibility mapping and vessel filtering, resulting in 3-dimensional data to inform vessel network segmentation and to calculate vascular density.
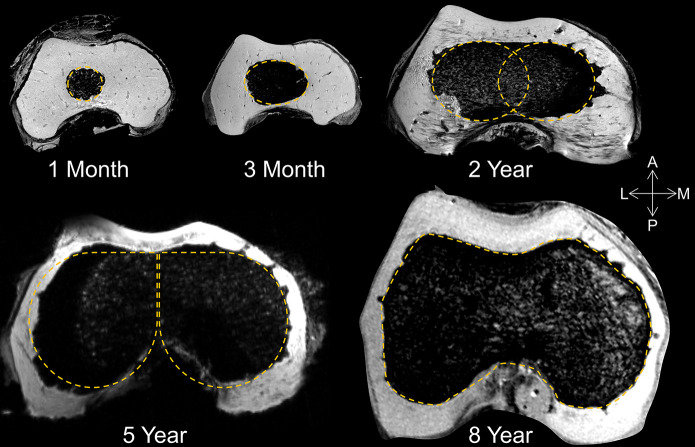
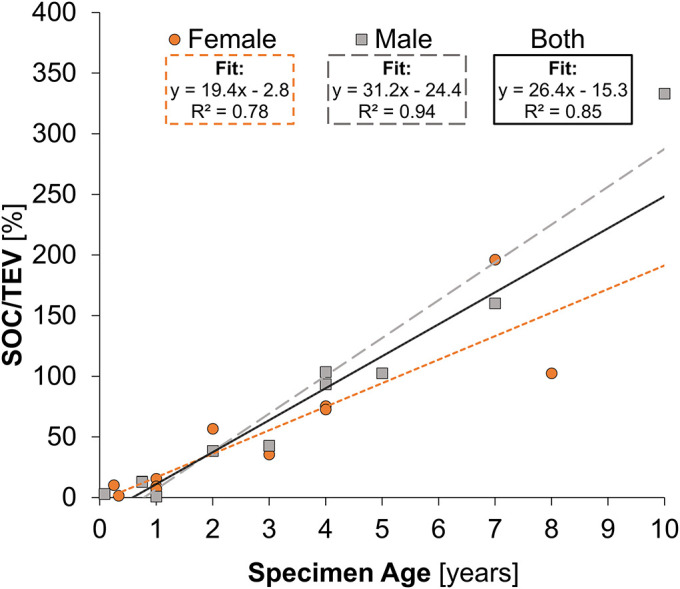
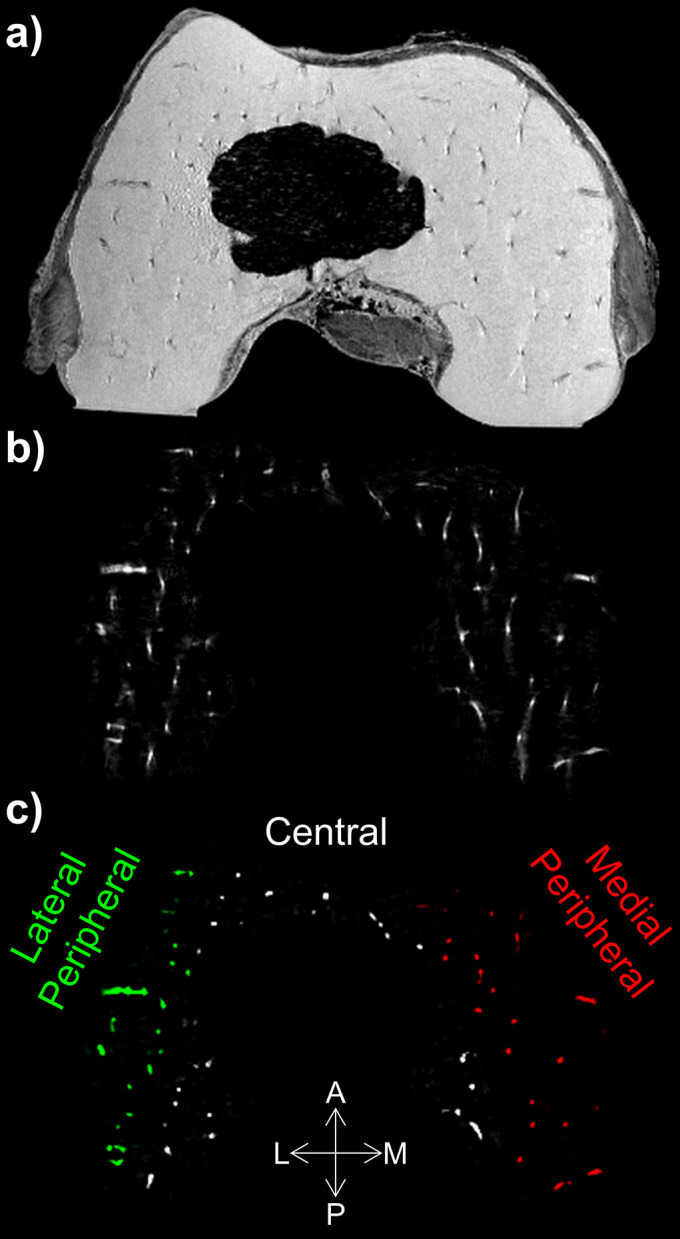
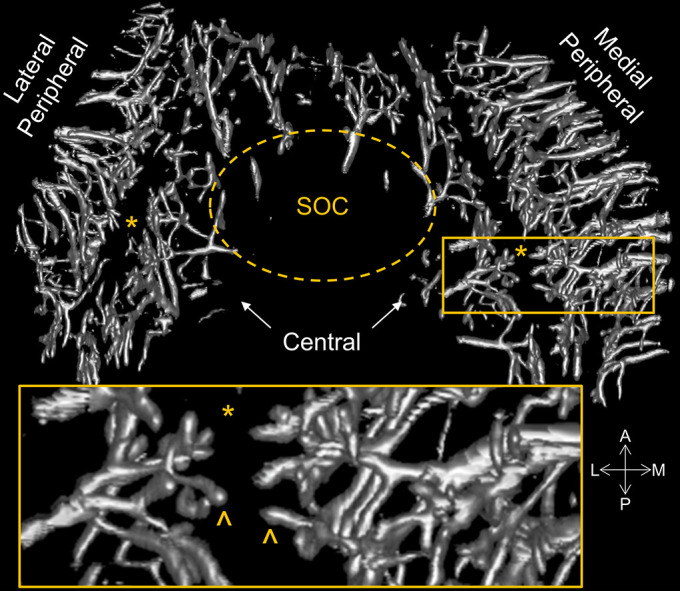
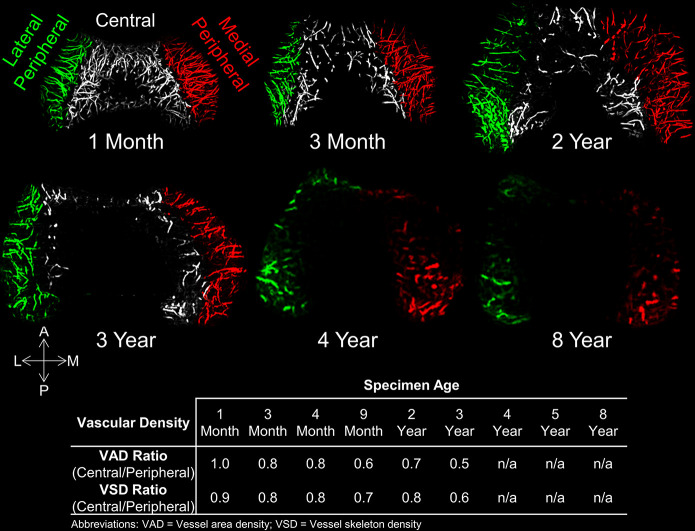
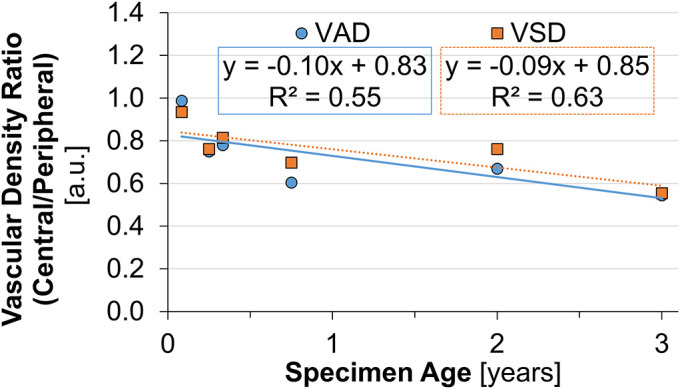
Results: Three distinct, non-anastomosing vascular networks (2 peripheral and 1 central) supply the distal femoral epiphyseal cartilage. The central network begins regression as early as 3 months and is absent by 4 years. From 1 month to 3 years, the ratio of central to peripheral vascular area density decreased from 1.0 to 0.5, and the ratio of central to peripheral vascular skeletal density decreased from 0.9 to 0.6. A narrow, peripheral vascular rim was present at 8 years but had disappeared by 10 years. The secondary ossification center progressively acquires the shape of the articular-epiphyseal cartilage complex by 8 years of age, and the central areas of the medial and lateral femoral condyles are the last to ossify.
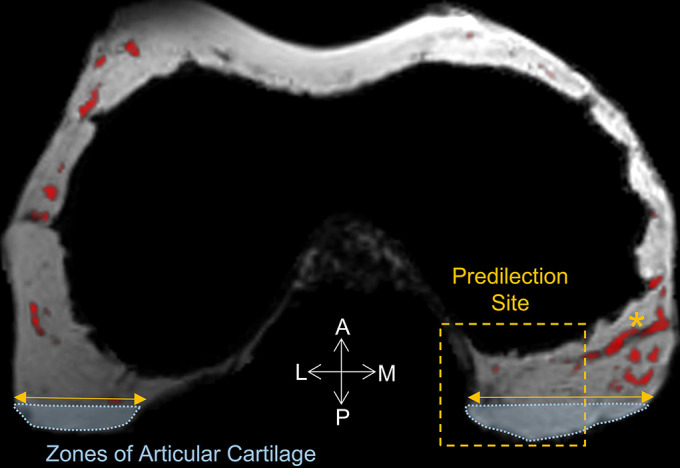
Conclusions: Using cadaveric pediatric knees, we provide quantitative, 3-dimensional measures of epiphyseal cartilage vascular regression during skeletal development using vessel image features. Central areas with both early vascular regression and delayed ossification correspond to predilection sites of juvenile osteochondritis dissecans in this limited case series. Our findings highlight specific vascular vulnerabilities that may lead to improved understanding of the pathogenesis and better-informed clinical management decisions in developmental skeletal diseases.
Clinical relevance: This paradigm shift in understanding of juvenile osteochondritis dissecans etiology and disease progression may critically impact future patient management. Our findings highlight specific vascular vulnerabilities during skeletal maturation in a group of active young patients seen primarily by orthopaedic surgeons and sports medicine professionals.
Copyright © 2019 The Authors. Published by The Journal of Bone and Joint Surgery, Incorporated. All rights reserved.
Figures
Similar articles
-
Novel Application of Magnetic Resonance Imaging Demonstrates Characteristic Differences in Vasculature at Predilection Sites of Osteochondritis Dissecans.Am J Sports Med. 2015 Oct;43(10):2522-7. doi: 10.1177/0363546515596410. Epub 2015 Aug 18. Am J Sports Med. 2015. PMID: 26286878 Free PMC article.
-
Epiphyseal cartilage vascular architecture at the distal humeral osteochondritis dissecans predilection site in juvenile pigs.J Orthop Res. 2024 Apr;42(4):737-744. doi: 10.1002/jor.25732. Epub 2023 Nov 30. J Orthop Res. 2024. PMID: 37971288 Free PMC article.
-
Identification of Areas of Epiphyseal Cartilage Necrosis at Predilection Sites of Juvenile Osteochondritis Dissecans in Pediatric Cadavers.J Bone Joint Surg Am. 2018 Dec 19;100(24):2132-2139. doi: 10.2106/JBJS.18.00464. J Bone Joint Surg Am. 2018. PMID: 30562294 Free PMC article.
-
Arthroscopic drilling in juvenile osteochondritis dissecans of the medial femoral condyle.Arthroscopy. 1994 Jun;10(3):286-91. doi: 10.1016/s0749-8063(05)80113-6. Arthroscopy. 1994. PMID: 8086022 Review.
-
Osteochondritis dissecans of the knee in children.Curr Opin Pediatr. 2003 Feb;15(1):38-44. doi: 10.1097/00008480-200302000-00007. Curr Opin Pediatr. 2003. PMID: 12544270 Review.
Cited by
-
Osteochondritis Dissecans: Current Understanding of Epidemiology, Etiology, Management, and Outcomes.J Bone Joint Surg Am. 2021 Jun 16;103(12):1132-1151. doi: 10.2106/JBJS.20.01399. J Bone Joint Surg Am. 2021. PMID: 34109940 Free PMC article. Review.
-
Juvenile Osteochondritis Dissecans: A Case Report.Diagnostics (Basel). 2024 Sep 1;14(17):1931. doi: 10.3390/diagnostics14171931. Diagnostics (Basel). 2024. PMID: 39272716 Free PMC article.
-
Juvenile Osteochondral Lesions of the Talus: Current Concepts Review and an Update on the Literature.Children (Basel). 2023 May 15;10(5):884. doi: 10.3390/children10050884. Children (Basel). 2023. PMID: 37238431 Free PMC article. Review.
-
Longitudinal 3T MRI T2 * mapping of Juvenile osteochondritis dissecans (JOCD) lesions differentiates operative from non-operative patients-Pilot study.J Orthop Res. 2023 Jan;41(1):150-160. doi: 10.1002/jor.25343. Epub 2022 Apr 30. J Orthop Res. 2023. PMID: 35430743 Free PMC article.
-
Refixation of a Large Osteochondral Fragment with Magnesium Compression Screws-A Case Report.Life (Basel). 2023 May 12;13(5):1179. doi: 10.3390/life13051179. Life (Basel). 2023. PMID: 37240824 Free PMC article.
References
-
- Chambers HG, Shea KG, Anderson AF, Jojo Brunelle TJ, Carey JL, Ganley TJ, Paterno M, Weiss JM, Sanders JO, Watters WC, 3rd, Goldberg MJ, Keith MW, Turkelson CM, Wies JL, Raymond L, Boyer KM, Hitchcock K, Sluka P, Boone C, Patel N; American Academy of Orthopaedic Surgeons. American Academy of Orthopaedic Surgeons clinical practice guideline on: the diagnosis and treatment of osteochondritis dissecans. J Bone Joint Surg Am. 2012. Jul 18;94(14):1322-4. - PubMed
-
- Chambers HG, Shea KG, Carey JL. AAOS Clinical Practice Guideline: diagnosis and treatment of osteochondritis dissecans. J Am Acad Orthop Surg. 2011. May;19(5):307-9. - PubMed
-
- Cruz AI, Jr, Shea KG, Ganley TJ. Pediatric knee osteochondritis dissecans lesions. Orthop Clin North Am. 2016. Oct;47(4):763-75. Epub 2016 Aug 6. - PubMed
-
- Cooper T, Boyles A, Samora WP, Klingele KE. Prevalence of bilateral JOCD of the knee and associated risk factors. J Pediatr Orthop. 2015. Jul-Aug;35(5):507-10. - PubMed
Grants and funding
LinkOut - more resources
Full Text Sources