. 2020 May;139(5):813-836.
doi: 10.1007/s00401-020-02134-w. Epub 2020 Feb 10.

Identification of early pericyte loss and vascular amyloidosis in Alzheimer's disease retina

Affiliations

Identification of early pericyte loss and vascular amyloidosis in Alzheimer's disease retina

Haoshen Shi et al. Acta Neuropathol. 2020 May.

Abstract

Pericyte loss and deficient vascular platelet-derived growth factor receptor-β (PDGFRβ) signaling are prominent features of the blood-brain barrier breakdown described in Alzheimer's disease (AD) that can predict cognitive decline yet have never been studied in the retina. Recent reports using noninvasive retinal amyloid imaging, optical coherence tomography angiography, and histological examinations support the existence of vascular-structural abnormalities and vascular amyloid β-protein (Aβ) deposits in retinas of AD patients. However, the cellular and molecular mechanisms of such retinal vascular pathology were not previously explored. Here, by modifying a method of enzymatically clearing non-vascular retinal tissue and fluorescent immunolabeling of the isolated blood vessel network, we identified substantial pericyte loss together with significant Aβ deposition in retinal microvasculature and pericytes in AD. Evaluation of postmortem retinas from a cohort of 56 human donors revealed an early and progressive decrease in vascular PDGFRβ in mild cognitive impairment (MCI) and AD compared to cognitively normal controls. Retinal PDGFRβ loss significantly associated with increased retinal vascular Aβ40 and Aβ42 burden. Decreased vascular LRP-1 and early apoptosis of pericytes in AD retina were also detected. Mapping of PDGFRβ and Aβ40 levels in pre-defined retinal subregions indicated that certain geometrical and cellular layers are more susceptible to AD pathology. Further, correlations were identified between retinal vascular abnormalities and cerebral Aβ burden, cerebral amyloid angiopathy (CAA), and clinical status. Overall, the identification of pericyte and PDGFRβ loss accompanying increased vascular amyloidosis in Alzheimer's retina implies compromised blood-retinal barrier integrity and provides new targets for AD diagnosis and therapy.

Keywords: Alzheimer’s disease; Cerebral amyloid angiopathy; Neurodegeneration; Pericytes; Retinopathy; Vascular damage.


Conflict of interest statement

YK, MKH, and KLB are co-founders and stockholders of NeuroVision Imaging, Inc., 1395 Garden Highway, Suite 250, Sacramento, CA 95833, USA. AVL and KLB are stockholders and/or officers of Arrogene Nanotechnology, Inc., 8560 West Sunset Boulevard, Suite 424, Los Angeles, CA 90069, USA.

Figures
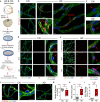
Fig. 1
Fig. 1
Microvascular network from postmortem retinas of AD patients exhibit pericyte loss along with Aβ accumulation in blood vessels and pericytes. a Schema of modified retinal vascular network isolation and immunofluorescent staining. Whole retinas were isolated from donor eyes and 7 mm wide strips were prepared from the temporal retinal hemisphere spanning from the ora serrata to the optic disk. Following fixation, washing, and elastase digestion, vascular network is mounted onto slides without dehydration. Immunofluorescent staining was applied on isolated retinal vascular network to detect Aβ (6E10, 4G8, 12F4 and 11A50), pericytes (PDGFRβ), and blood vessels (lectin). b, c Representative fluorescent images of isolated retinal microvasculature stained for Aβ42 (12F4, red), blood vessels (lectin, green), and nuclei (DAPI, blue) in age- and sex-matched human donors with AD (n = 5) and cognitively normal (CN, n = 5). Arrows indicate microvascular Aβ42 deposits in capillaries on panel b [a zoomed-in image of AD donor retina (lower image) shows co-localization of Aβ42 and retinal vascular wall; yellow spot], or pericytes on panel c; d, e Representative fluorescent images of isolated retinal microvasculature stained for Aβ (11A50-B10, 6E10 or 4G8, red), pericytes (PDGFRβ, white), blood vessels (lectin, green), and nuclei (DAPI, blue) in age- and sex-matched AD and CN human donors. Arrows indicate pericytes. f Representative fluorescent images of isolated retinal microvasculature stained for pericytes (PDGFRβ, red), blood vessels (lectin, green), and nuclei (DAPI, blue). Arrows indicate pericytes. gi Quantitative analyses of g mean number of retinal pericytes in each microscopic visual field (1.8 × 104 µm2 area), h ratio of retinal vascular Aβ immunoreactive (IR) area to lectin IR area from each microscopic visual field (1.8 × 104 µm2 area), and i Aβ IR area within pericytes, in the same cohort of AD (n = 5) and CN (n = 5) human donors. Scale bars = 10 μm. Data from individual subjects as well as group mean ± SEM are shown. Fold and percent changes are shown in red. *p < 0.05, **p < 0.01, determined by unpaired two tailed Student’s t test
Fig. 2
Fig. 2
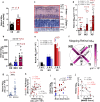
Early and progressive loss of retinal vascular PDGFRβ in MCI and AD. a, b Schematic diagram of donor eye dissection, isolation of neurosensory retina (yellow), and retinal processing for histological analysis. Anatomically defined strips from all four quadrants, superior-temporal—ST, temporal-inferior—TI, inferior-nasal—IN, and nasal-superior—NS, were prepared and analyzed in pre-determined geometrical regions: central (C), mid- (M) and far- (F) periphery. c, d Representative fluorescent images of paraffin-embedded retinal cross-sections stained for PDGFRβ (red), with blood vessels (lectin, green) and nuclei (DAPI, blue) in age- and sex-matched human donors with AD, mild cognitive impairment (MCI), and cognitively normal (CN; yrs years, F female, C Caucasian). c Longitudinal (L) blood vessels (~ 10 µm in diameter); d Zoomed-in PDGFRβ+ vascular cells are shown from selected regions (dashed white rectangle in c). Scale bars = 10 μm. e Quantitative analysis of percent PDGFRβ IR area in vertical (V) blood vessels in the retinas of donors with AD (n = 21), MCI (n = 7), and CN (n = 10). f Pearson’s coefficient (r) correlation between percent retinal PDGFRβ IR area in sum of V and L blood vessels against CAA scores in a subset of AD (n = 11) and MCI (n = 3) human donors. g–j Quantitative analysis of percent PDGFRβ immunoreactive (IR) area in V vessels from each retinal quadrant separately: g NS, h IN, i ST, j TI, in the same human cohort as in (e). k–l Heat-map illustrating Pearson’s correlations between percent retinal PDGFRβ IR area and brain pathology, including neuritic plaques (NP), diffuse plaques (DP), immature plaques (IP), and neuropil threads (NT), in AD (n = 14), MCI (n = 5) and CN (n = 1) human subjects (n = 20 total). Pseudo-color k red for (r) values and l blue for (P) values demonstrate the strength of each correlation parameter; Total—all brain regions averaged, Hipp—hippocampus, Ent—entorhinal cortex, Frontal—frontal cortex, Temporal—temporal cortex, Parietal—parietal cortex, A-17—primary visual cortex, and A-18—visual association cortex. m Correlation between percent retinal PDGFRβ IR area of all (mean of four quadrants; gray dots) or superior retinal hemisphere (mean of ST and NS; red dots) against the mini-mental state examination (MMSE) cognitive scores (n = 10). Data from individual subjects as well as group mean ± SEM are shown. Percent changes are shown in red. *p < 0.05, **p < 0.01, ***p < 0.001, ****p < 0.0001, by one-way ANOVA with Sidak’s post-hoc multiple comparison test
Fig. 3
Fig. 3
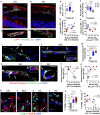
Increased vascular Aβ42 including in pericytes is tightly associated with PDGFRβ loss in postmortem retinas of MCI and AD patients. a, b Representative fluorescent images of paraffin-embedded retinal cross-sections isolated from human donors with AD, MCI, or cognitively normal (CN) stained for Aβ42 (12F4, red), blood vessels (lectin, green), and nuclei (DAPI, blue). a Vertical (V) and b longitudinal (L) vessels are shown (yrs years; F female; C Caucasian); geometric shapes in white dashed lines indicate pre-defined areas of analysis. Scale bars = 10 μm. c, d Quantitative analysis of percent 12F4 immunoreactive (IR) area in retinal c V or d L blood vessels in age- and sex-matched human donors with AD (n = 10), MCI (n = 11) and CN (n = 10). e, f Pearson’s coefficient (r) correlation between retinal 12F4+42 burden in average of V and L blood vessels against e neuritic Aβ plaques either in whole brain (gray dots) or entorhinal cortex (EC; red dots) and f percent retinal vascular PDGFRβ IR area within a subset of human donors with AD, MCI and CN (n = 8, n = 10, and n = 18, respectively). g Representative fluorescent images of retinal vertical vessels from human eye donors with AD, MCI, or CN, stained for Aβ42 (12F4, white), PDGFRβ (red), blood vessels (lectin, green), and DAPI for nuclei (blue). Scale bars = 10 μm. h A microscopic image of longitudinal vessel from MCI retina showing vascular Aβ42 immunoreactivity (green) co-localized with PDGFRβ+ cells (red, arrows). Scale bars = 10 μm. i, j Transmission electron microscopy (TEM) images of retinal vertical-sections from an AD human donor; retina was pre-stained with anti-Aβ42 mAb (12F4) and an immunoperoxidase-based DAB. TEM analysis reveals the location and ultrastructure of retinal vascular-associated Aβ deposits (demarcated by yellow shapes). i Left, retinal Aβ42 deposit in the outer vascular surface adjacent to pericytes (P, green), with a clean blood vessel lumen (L). Right, retinal Aβ42 deposited inside a blood vessel lumen attached to an endothelial cell (EC, pink) surface. j Retinal Aβ42 deposits within pericytes, detected in the cytoplasm and adjacent to mitochondria, as well as on vessel outer surface external to the pericytes. Scale bars = 0.5 µm. Data from individual human donors as well as group mean ± SEM are shown. Fold changes are shown in red. *p < 0.05, **p < 0.01, ***p < 0.001, ****p < 0.0001, by one-way ANOVA with Sidak’s post-hoc multiple comparison test
Fig. 4
Fig. 4
Retinal vascular Aβ40 burden in AD retina correlates with both retinal vascular Aβ42 deposits and PDGFRβ loss and can predict disease status. a–c Representative images of retinal and brain sections immunostained against Aβ40 (JRF/cAβ40/28; #8152) with DAB labeling and hematoxylin counterstain in cohorts of AD, MCI, and cognitively normal (CN) controls. c Arrows indicate vascular Aβ40 staining in tunica media, adventitia, or intima; right image is an enlargement of area indicated by arrow from the middle image. Scale bars = 20 µm. d, e Representative fluorescent images of paraffin-embedded retinal cross-sections isolated from human donors with AD, MCI, or CN (yrs years old, F female, C Caucasian, A Asian) and stained for Aβ40 (11A50–B10, red), blood vessels (lectin, green), and nuclei (DAPI, blue) in d vertical (V) and e longitudinal (L) retinal blood vessels. Dashed geometric white shapes indicate pre-defined areas of analysis. Scale bars = 10 µm. f Representative microscopic images showing V vessels labeled against endothelial cells (CD31, red), Aβ40 (JRF/cAβ40/28, green), and nuclei (DAPI, blue) in retinas from AD, MCI, and CN human donors. Scale bars = 10 µm. g, h Quantitative analysis of percent 11A50-B10+40 immunoreactive (IR) area in retinal g V and h L blood vessels from AD (n = 13), MCI (n = 5) and CN controls (n = 10). i, j. Pearson’s coefficient (r) correlation between retinal Aβ40 burden (mean of both V and L vessels) against i percent retinal PDGFRβ IR area (n = 24 human donors) or j percent retinal vascular 12F4+42 burden (n = 20 human donors). k, l Heat-map illustrating correlations between percent retinal vascular Aβ40 IR area (average of V and L blood vessels) against brain pathology, including neuritic plaques (NP), diffuse plaques (DP), immature plaques (IP), and neuropil threads (NT), in AD (n = 8), MCI (n = 3), and CN (n = 1) human donors (n = 12 total). Pseudo-color k red (r) values and l blue (P) values demonstrate the strength of each correlation parameter; total—average of all brain regions, Hipp—hippocampus, Ent—entorhinal cortex, Frontal—frontal cortex, Temporal—temporal cortex, Parietal—parietal cortex, A-17—primary visual cortex, and A-18—visual association cortex. m–o Analysis of retinal parameters when samples are stratified per two diagnostic groups, MCI/AD and CN. m Retinal vascular PDGFRβ (n = 20 MCI/AD and n = 10 CN). n Retinal vascular Aβ40 (n = 16 MCI/AD and n = 10 CN). o Retinal vascular Aβ42 (n = 14 MCI/AD and n = 9 CN). Dotted lines display the suggested values to separate between control and disease groups. Males in filled circles and Females in clear circles. Data from individual human subjects as well as group mean ± SEM are shown. Fold and percent changes are shown in red. **p < 0.01, ***p < 0.001, ****p < 0.0001, by one-way ANOVA with Sidak’s post-hoc multiple comparison test
Fig. 5
Fig. 5
Mapping of retinal Aβ40 burden and distribution in predefined geometrical regions and layers. a Retinal Aβ1–40 concentrations determined by ELISA assay in protein homogenates from postmortem retinas freshly collected from AD patients (n = 6) and cognitively normal controls (CN, n = 5). b Quantitative analysis of 11A50–B10+40 immunoreactive (IR) area normalized to retinal thickness in cross-sections from a cohort of AD (n = 17), MCI (n = 8), and CN controls (n = 11). c Schematic diagram for the region of interest (ROI) analyzed with separate assessments for inner (from inner limiting membrane = ILM to inner nuclear layer = INL) and outer neural retina (from outer plexiform layer = OPL to outer limiting membrane = OLM). d Quantitative analysis of Aβ40 IR area in outer (O) vs. inner (I) retina of AD (n = 17), MCI (n = 8), and CN (n = 11) human donors. e Quantitative analysis of Aβ40 IR area in central (C), mid-peripheral (M), and far-peripheral (F) retina from the same human cohort. f Mapping of Aβ40 in four quadrants, C/M/F, and inner vs. outer retina. Strength of magenta pseudo-color represents the density of retinal Aβ40 burden in each geographic region. g Analysis of retinal parameters when samples are stratified per two diagnostic groups, MCI/AD and CN for total retinal Aβ40 (n = 22 MCI/AD and n = 10 CN). Dotted lines display the suggested values to separate between control and disease groups. Males in filled circles and Females in clear circles. h–j Pearson’s coefficient (r) correlation between retinal Aβ40 IR area against h neuritic Aβ plaques in whole brain (gray dots) and entorhinal cortex (EC, red dots), i CAA scores, and j mini-mental state examination (MMSE) cognitive scores (gray dots—all retina, red dots—temporal retina = mean of ST and TI quadrants) in different subsets of AD, MCI, and CN human donors (n = 20, n = 17 or n = 10, respectively). Data from individual human subjects as well as group mean ± SEM are shown. Fold and percent changes are shown in red. *p < 0.05, **p < 0.01, ***p < 0.001, ****p < 0.0001, by one-way or two-way ANOVA with Sidak’s post-hoc multiple comparison test (Red * in e indicates AD vs. CN group, blue * in e indicates AD vs. MCI group). Two group statistical analysis of ELISA was done by unpaired 2-tailed Student’s t test
Fig. 6
Fig. 6
Decreased retinal LRP-1 in AD and increased apoptotic pericytes in MCI and AD retina. a, b Representative fluorescent images of paraffin-embedded retinal cross-sections isolated from a cognitively normal (CN) and b AD subjects, stained for LRP-1 (red), PDGFRβ (green), blood vessels (lectin, white), and nuclei (DAPI, blue). c, d Representative fluorescent images from AD and CN subjects focusing on retinal vascular LRP-1 region. e Quantitative analysis of total LRP-1 immunoreactive (IR) area in postmortem retinas from patients with AD (n = 6), MCI (n = 6), and from CN controls (n = 6). f Quantitative analysis of percent LRP-1 IR area in retinal blood vessels from the same cohort. g, h Pearson’s coefficient (r) correlation between percent retinal LRP-1 IR area in the vasculature against g percent retinal vascular PDGFRβ IR area, and h total retinal 11A50–B10+40 area in a subset of human cohorts (n = 13 and n = 12, respectively). i–l Representative fluorescent images of paraffin-embedded retinal cross-sections isolated from i CN, j MCI, or k, l AD human eye donors, stained for cleaved caspase-3 (red), PDGFRβ (green), blood vessels (lectin, white), and nuclei (DAPI, blue). Arrows indicate positive signal of cleaved caspase-3 in pericytes. i', k’ show zoomed-in pericytes from the original image. m Quantitative analysis of percent cleaved caspase-3+ pericyte number out of 10–15 pericytes counted from each human donor: AD (n = 6), MCI (n = 6), and CN (n = 6). Dashed line represents 100% reference point. n, o Pearson’s coefficient (r) correlation between percent cleaved caspase-3+ pericytes against n retinal vascular percent PDGFRβ IR area or o total retinal 11A50-B10+40 IR area in a subset of human donors (n = 11). p–t Representative fluorescent images of paraffin-embedded retinal cross-sections isolated from human donors either p, q CN, r MCI, or s, t AD, stained for PDGFRβ (red), TUNEL (green) and nuclei (DAPI, blue). r’, s’ show zoomed-in retinal TUNEL+ pericytes from the original images of MCI and AD donors. u Quantitative analysis of percent retinal TUNEL+ pericytes in 10–15 pericytes counted from each donor from the same human cohort. v Pearson’s coefficient (r) correlation between percent TUNEL+ pericytes and percent vascular PDGFRβ IR area in postmortem retinas from a subset of human donors (n = 12). All scale bars = 10 µm. Data from individual human donors as well as group mean ± SEM are shown. Fold and percentage changes are shown in red. *p < 0.05, ****p < 0.0001, NS not significant, by one-way ANOVA with Sidak’s post-hoc multiple comparison test. *p < 0.05 in parenthesis = unpaired 2-tailed Student’s t test

References

    1. Abbasi J. A retinal scan for Alzheimer disease. JAMA. 2017;318:1314. doi: 10.1001/jama.2017.15192. - DOI - PubMed
    1. Abramoff MD, Garvin MK, Sonka M. Retinal imaging and image analysis. IEEE Rev Biomed Eng. 2010;3:169–208. doi: 10.1109/RBME.2010.2084567. - DOI - PMC - PubMed
    1. Alexandrov PN, Pogue A, Bhattacharjee S, Lukiw WJ. Retinal amyloid peptides and complement factor H in transgenic models of Alzheimer's disease. NeuroReport. 2011;22:623–627. doi: 10.1097/WNR.0b013e3283497334. - DOI - PMC - PubMed
    1. Alonzo NC, Hyman BT, Rebeck GW, Greenberg SM. Progression of cerebral amyloid angiopathy: accumulation of amyloid-β40 in affected vessels. J Neuropathol Exp Neurol. 1998;57:353–359. doi: 10.1097/00005072-199804000-00008. - DOI - PubMed
    1. Arvanitakis Z, Leurgans SE, Wang Z, Wilson RS, Bennett DA, Schneider JA. Cerebral amyloid angiopathy pathology and cognitive domains in older persons. Ann Neurol. 2011;69:320–327. doi: 10.1002/ana.22112. - DOI - PMC - PubMed

Publication types

Substances