. 2020 Oct;52(5):1848-1866.
doi: 10.3758/s13428-020-01366-8.

Improving parameter recovery for conflict drift-diffusion models

Affiliations

Improving parameter recovery for conflict drift-diffusion models

Ronald Hübner et al. Behav Res Methods. 2020 Oct.

Abstract

Several drift-diffusion models have been developed to account for the performance in conflict tasks. Although a common characteristic of these models is that the drift rate changes within a trial, their architecture is rather different. Comparative studies usually examine which model fits the data best. However, a good fit does not guarantee good parameter recovery, which is a necessary condition for a valid interpretation of any fit. A recent simulation study revealed that recovery performance varies largely between models and individual parameters. Moreover, recovery was generally not very impressive. Therefore, the aim of the present study was to introduce and test an improved fit procedure. It is based on a grid search for determining the initial parameter values and on a specific criterion for assessing the goodness of fit. Simulations show that not only the fit performance but also parameter recovery improved substantially by applying this procedure, compared to the standard one. The improvement was largest for the most complex model.

Keywords: Drift-diffusion models; Grid-search method; Model-fit procedure; Parameter recovery.


Figures

Fig. 1
Fig. 1
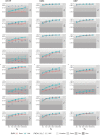
Recovery performance for the three models in the situation that was similar to that in White et al. (2018). The colored lines show the results for the five simulations. The black thick line is the corresponding mean performance. The errors bars are constructed based on variability across the five runs and indicate the 95% confidence interval. The blue crosses represent the results from White et al. (2018)
Fig. 2
Fig. 2
Mean η for all models, NS, fit criteria, and start methods. The goodness-of-recovery measures were averaged across all Npop. The error bars represent the 95% confidence interval
Fig. 3
Fig. 3
Correlations between the original and recovered parameter values for the three models. The colored graphs represent different combinations of start-value condition and fit criteria. The shaded areas reflect the evaluation boundaries for the recovery performance after White et al. (2018). The blue crosses represent the correlations found in that study
Fig. 4
Fig. 4
Correlation between goodness of recovery (η) and goodness of fit (chi2 or SPE) for the different models and fit conditions
Fig. 5
Fig. 5
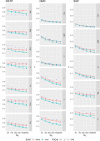
Recovery performance for all parameters regarding the three models. The colored lines show the results for different start-value methods (SVM). The line style distinguishes the used fit criterion. Blue crosses represent the results from White et al. (2018)
Fig. 6
Fig. 6
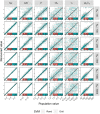
Recovery performance of DSTP model for the individual parameters and the two start-value methods (SVM). Fit criterion was SPE. Simulated population values are plotted against the recovered values for each parameter. Values along the diagonal indicate good recovery. See also the corresponding correlations in the colored boxes
Fig. 7
Fig. 7
Recovery performance of DMC model for the individual parameters and the two start-value methods (SVM). Fit criterion was SPE. Simulated population values are plotted against the recovered values for each parameter. Values along the diagonal indicate good recovery. See also the corresponding correlations in the colored boxes
Fig. 8
Fig. 8
Recovery performance of SSP model for the individual parameters and the two start-value methods (SVM). Fit criterion was SPE. Simulated population values are plotted against the recovered values for each parameter. Values along the diagonal indicate good recovery. See also the corresponding correlations in the colored boxes

References

    1. Brent RP. Algorithms for function minimization without derivatives. Englewood Cliffs, NJ: Prentice-Hall; 1973.
    1. De Jong R, Liang CC, Lauber E. Conditional and unconditional automaticity: A dual-process model of effects of spatial stimulus-response correspondence. Journal of Experimental Psychology: Human Perception and Performance. 1994;20:731–750. - PubMed
    1. Eriksen BA, Eriksen CW. Effects of noise letters upon the identification of a target letter in a nonsearch task. Perception & Psychophysics. 1974;16(1):143–149. doi: 10.3758/BF03203267. - DOI
    1. Hübner R. Does attentional selectivity in global/local processing improve discretely or gradually? Frontiers in Psychology. 2014;5:61. doi: 10.3389/fpsyg.2014.00061. - DOI - PMC - PubMed
    1. Hübner R, Mishra S. Evidence for strategic suppression of irrelevant activation in the Simon task. Acta Psychologica. 2013;144(1):166–172. doi: 10.1016/j.actpsy.2013.05.012. - DOI - PubMed

Publication types

LinkOut - more resources