

Diagnostic performance of reticulocyte hemoglobin equivalent in assessing the iron status
- PMID: 32043622
- PMCID: PMC7307362
- DOI: 10.1002/jcla.23225
Diagnostic performance of reticulocyte hemoglobin equivalent in assessing the iron status
Abstract
Background: Measurement of reticulocyte hemoglobin equivalent (RET-He) is rapid, convenient, and cost-effective. Yet, researches on its performance in diagnosing iron deficiency with concurrent inflammation are limited. Hence, this study investigated RET-He value in various states, including inflammation, and evaluated its diagnostic performance in iron status assessment.
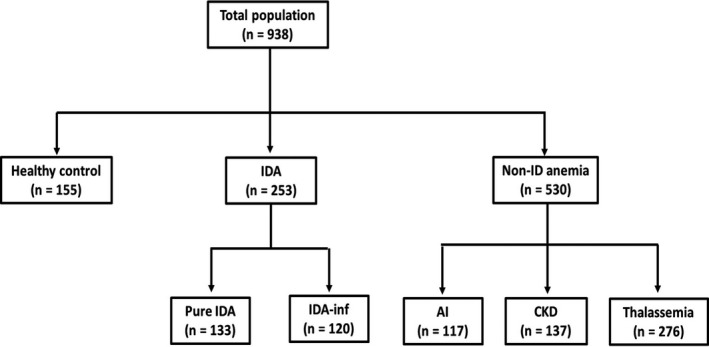
Methods: Retrospectively, 953 clinical data and laboratory results-complete blood count, reticulocyte count, RET-He, and serum ferritin-were reviewed. Patients on iron therapy were excluded. Iron status was defined by serum ferritin as the reference method. RET-He among populations was investigated. Its diagnostic performance and optimal cutoff were determined by ROC analysis.
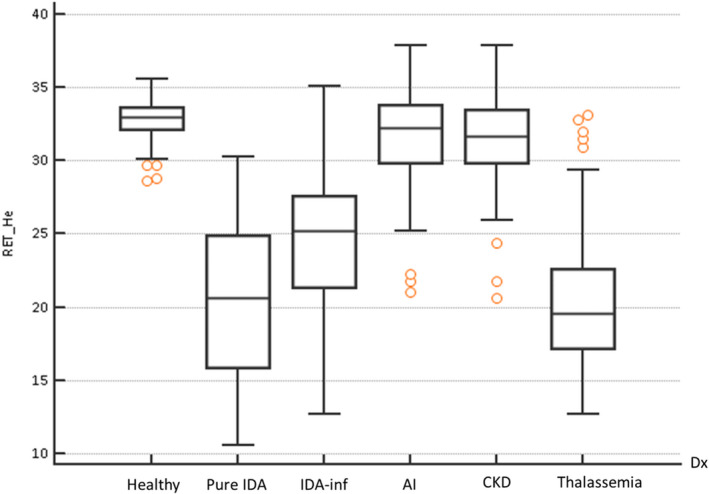
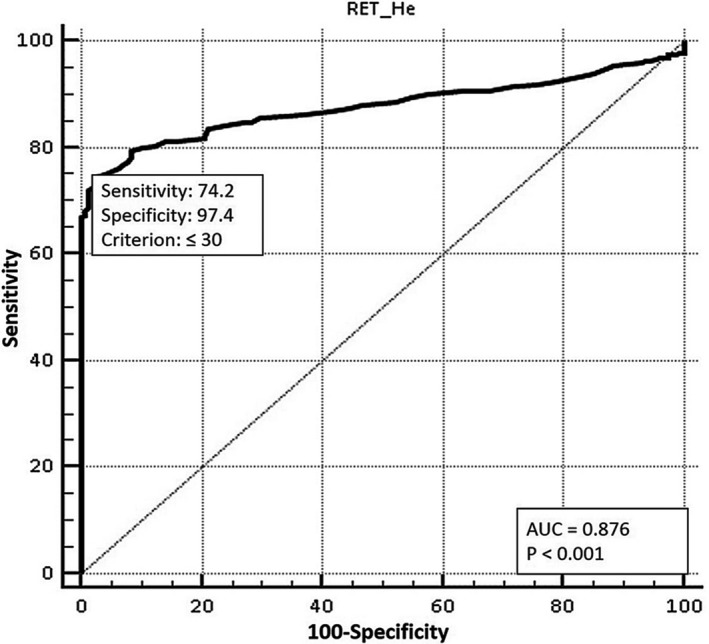
Results: Three population groups were classified: healthy control, iron deficiency anemia (IDA), and non-ID anemia. Significantly, RET-He value in IDA was lower than that of healthy control, anemia of inflammation, and chronic kidney disease (P < .0001). Low RET-He was also observed in IDA with concomitant inflammation despite normal-to-high serum ferritin levels. No significant difference was observed between RET-He values in pure IDA and thalassemia (P = .57). ROC curve analysis revealed AUC of 0.876 (P < .0001) at cutoff 30 pg, by which IDA was discriminated with 74.2% sensitivity and 97.4% specificity. Applying cutoff ≤30 pg, IDA can be diagnosed with 96% sensitivity, 97.4% specificity, 80% PPV, and 99.6% NPV. Hence, RET-He >30 pg signifies a non-IDA state.
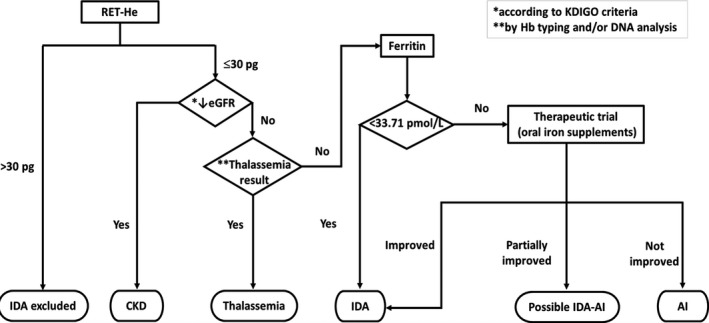
Conclusion: In addition to convenience and cost-effectiveness, RET-He cutoff >30 pg can be potentially used to exclude IDA due to its excellent diagnostic sensitivity and specificity.
Keywords: diagnostic performance; exclusion; inflammation; iron deficiency anemia; reticulocyte hemoglobin equivalent (RET-He).
© 2020 The Authors. Journal of Clinical Laboratory Analysis published by Wiley Periodicals, Inc.
Figures
Similar articles
-
Reticulocyte hemoglobin equivalent in a thalassemia-prevalent area.Pediatr Int. 2019 Mar;61(3):240-245. doi: 10.1111/ped.13775. Epub 2019 Mar 10. Pediatr Int. 2019. PMID: 30593711
-
The role of reticulocyte hemoglobin equivalent on the evaluation of iron deficiency and iron deficiency anemia in pediatric cyanotic heart disease: a diagnostic study in Indonesia.BMC Pediatr. 2024 Aug 23;24(1):541. doi: 10.1186/s12887-024-05000-w. BMC Pediatr. 2024. PMID: 39174917 Free PMC article.
-
Reticulocyte hemoglobin equivalent as a marker to assess iron deficiency: A large pediatric tertiary care hospital study.Int J Lab Hematol. 2024 Feb;46(1):148-155. doi: 10.1111/ijlh.14188. Epub 2023 Oct 18. Int J Lab Hematol. 2024. PMID: 37850393
-
Implementing Reticulocyte Hemoglobin Into Current Hematology Algorithms.Am J Clin Pathol. 2022 Nov 3;158(5):574-582. doi: 10.1093/ajcp/aqac103. Am J Clin Pathol. 2022. PMID: 36048898
-
The Role of Reticulocyte Hemoglobin Content for Diagnosis of Iron Deficiency and Iron Deficiency Anemia, and Monitoring of Iron Therapy: a Literature Review.Clin Lab. 2019 Dec 1;65(12). doi: 10.7754/Clin.Lab.2019.190315. Clin Lab. 2019. PMID: 31850722 Review.
Cited by
-
Reticulocyte and Erythrocyte Hemoglobin Parameters for Iron Deficiency and Anemia Diagnostics in Patient Blood Management. A Narrative Review.J Clin Med. 2021 Sep 19;10(18):4250. doi: 10.3390/jcm10184250. J Clin Med. 2021. PMID: 34575361 Free PMC article. Review.
-
Improved Diagnosis of Iron Deficiency Anemia in the Critically Ill via Fluorescence Flowcytometric Hemoglobin Biomarkers.Cells. 2022 Dec 29;12(1):140. doi: 10.3390/cells12010140. Cells. 2022. PMID: 36611936 Free PMC article.
-
Comparison of Standard and New Iron Status Biomarkers: A Prospective Cohort Study in Sepsis Patients.Healthcare (Basel). 2023 Mar 30;11(7):995. doi: 10.3390/healthcare11070995. Healthcare (Basel). 2023. PMID: 37046922 Free PMC article.
-
The Correlation between Reticulocyte Hemoglobin Equivalent (RET-He), Iron Status, and Erythrocyte Indices in Chronic Kidney Disease Patients at Prof. Dr. R.D. Kandou Manado Hospital.Int J Hematol Oncol Stem Cell Res. 2025 Jan 1;19(1):50-59. doi: 10.18502/ijhoscr.v19i1.17824. Int J Hematol Oncol Stem Cell Res. 2025. PMID: 40421393 Free PMC article.
-
Red cell size factor is a sensitive index in the early diagnosis of nondigestive tract cancer-related anemia: An observational study.Medicine (Baltimore). 2024 Sep 27;103(39):e39736. doi: 10.1097/MD.0000000000039736. Medicine (Baltimore). 2024. PMID: 39331897 Free PMC article.
References
-
- Speeckaert MM, Speeckaert R, Delanghe JR. Biological and clinical aspects of soluble transferrin receptor. Crit Rev Clin Lab Sci. 2010;47(5–6):213‐228. - PubMed
-
- Food and Agriculture Organization of the United Nations, World Health Organization . Chapter 13. Iron [Internet]. Rome: food and agriculture organization. 2001:195‐221 [cited 2017 Nov 11]. Available from: http://www.fao.org/3/a-y2809e.pdf
-
- Ganz T. Iron deficiency and overload In: Kaushansky K, Prchal JT, Press OW, Lichtman MA, Levi M, Burns LJ, Caligiuri MA, eds. Williams Hematology (9th edn). New York, NY: McGraw‐Hill Education; 2016:627‐637.
MeSH terms
Substances
LinkOut - more resources
Full Text Sources
Medical
