Effect of Different Proteinase K Digest Protocols and Deparaffinization Methods on Yield and Integrity of DNA Extracted From Formalin-fixed, Paraffin-embedded Tissue
- PMID: 32043912
- PMCID: PMC7045302
- DOI: 10.1369/0022155420906234
Effect of Different Proteinase K Digest Protocols and Deparaffinization Methods on Yield and Integrity of DNA Extracted From Formalin-fixed, Paraffin-embedded Tissue
Abstract
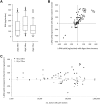
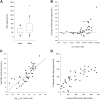
DNA extracted from formalin-fixed, paraffin-embedded tissue sections is often inadequate for sequencing, due to poor yield or degradation. We optimized the proteinase K digest by testing increased volume of enzyme and increased digest length from the manufacturer's protocol using 54 biospecimens, performing the digest in centrifuge tubes. Doubling the quantity of proteinase K resulted in a median increase in yield of 96%. Applying the optimized proteinase K protocol to sections deparaffinized on microscope slides generated a further increase in yield of 41%, but only at >50,000 epithelial tumor cells/section. DNA yield now correlated with (χ2 = 0.84) and could be predicted from the epithelial tumor cell number. DNA integrity was assayed using end point multiplex PCR (amplicons of 100-400 bp visualized on a gel), quantitative PCR (qPCR; Illumina FFPE QC Assay), and nanoelectrophoresis (DNA Integrity Numbers [DINs]). Generally, increases in yield were accompanied by increases in integrity, but sometimes qPCR and DIN results were conflicting. Amplicons of 400 bp were almost universally obtained. The process of optimization enabled us to reduce the percentage of samples that failed published quality control thresholds for determining amenability to whole genome sequencing from 33% to 7%.
Keywords: DNA Integrity Number; Illumina FFPE QC Assay; genomic screen tape; quality control.
Conflict of interest statement
Figures


Similar articles
-
Does vacuum centrifugal concentration reduce yield or quality of nucleic acids extracted from FFPE biospecimens?Anal Biochem. 2019 Feb 1;566:16-19. doi: 10.1016/j.ab.2018.10.020. Epub 2018 Oct 19. Anal Biochem. 2019. PMID: 30343041
-
Results and lessons from dual extraction of DNA and RNA from formalin-fixed paraffin-embedded breast tumor tissues for a large Cancer epidemiologic study.BMC Genomics. 2022 Aug 25;23(1):614. doi: 10.1186/s12864-022-08837-6. BMC Genomics. 2022. PMID: 36008758 Free PMC article.
-
Preparation of archival formalin-fixed paraffin-embedded mouse liver samples for use with the Agilent gene expression microarray platform.J Pharmacol Toxicol Methods. 2013 Sep-Oct;68(2):260-268. doi: 10.1016/j.vascn.2013.02.008. Epub 2013 Mar 1. J Pharmacol Toxicol Methods. 2013. PMID: 23458726
-
Deparaffinization of formalin-fixed paraffin-embedded tissue blocks using hot water instead of xylene.Anal Biochem. 2016 Aug 15;507:71-3. doi: 10.1016/j.ab.2016.05.015. Epub 2016 Jun 7. Anal Biochem. 2016. PMID: 27287960
-
[DNA extraction from formalin fixed and paraffin embedded tissues].Fa Yi Xue Za Zhi. 2006 Dec;22(6):455-8. Fa Yi Xue Za Zhi. 2006. PMID: 17285872 Review. Chinese.
Cited by
-
New protocol for kinetic assay seeding ability recovery "KASAR" from formalin-fixed paraffin-embedded tissues.Front Mol Biosci. 2023 Jan 30;10:1087982. doi: 10.3389/fmolb.2023.1087982. eCollection 2023. Front Mol Biosci. 2023. PMID: 36793788 Free PMC article.
-
A Modified Method for DNA Extraction From Buccal Cells for Genetic Epidemiological Studies Among Children.Cureus. 2024 Dec 21;16(12):e76140. doi: 10.7759/cureus.76140. eCollection 2024 Dec. Cureus. 2024. PMID: 39840209 Free PMC article.
-
Application of DNA Methylome Analysis to Patients with ME/CFS.Methods Mol Biol. 2025;2920:141-160. doi: 10.1007/978-1-0716-4498-0_9. Methods Mol Biol. 2025. PMID: 40372682
-
Why Formalin-fixed, Paraffin-embedded Biospecimens Must Be Used in Genomic Medicine: An Evidence-based Review and Conclusion.J Histochem Cytochem. 2020 Aug;68(8):543-552. doi: 10.1369/0022155420945050. Epub 2020 Jul 22. J Histochem Cytochem. 2020. PMID: 32697619 Free PMC article.
-
Association of Mitochondrial DNA Copy Number Variations with Triple-Negative Breast Cancer: A Potential Biomarker Study.Diseases. 2025 Jun 1;13(6):175. doi: 10.3390/diseases13060175. Diseases. 2025. PMID: 40558586 Free PMC article.
References
-
- Astolfi A, Urbini M, Indio V, Nannini M, Genovese CG, Santini D, Saponara M, Mandrioli A, Ercolani G, Brandi G, Biasco G, Pantaleo MA. Whole exome sequencing (WES) on formalin-fixed, paraffin-embedded (FFPE) tumor tissue in gastrointestinal stromal tumors (GIST). BMC Genomics. 2015;16:892. - PMC - PubMed
-
- Bonfiglio S, Vanni I, Rossella V, Truini A, Lazarevic D, Dal Bello MG, Alama A, Mora M, Rijavec E, Genova C, Cittaro D, Grossi F, Coco S. Performance comparison of two commercial human whole-exome capture systems on formalin-fixed paraffin-embedded lung adenocarcinoma samples. BMC Cancer. 2016;16:692. - PMC - PubMed
-
- Bonnet E, Moutet ML, Baulard C, Bacq-Daian D, Sandron F, Mesrob L, Fin B, Delepine M, Palomares MA, Jubin C, Blanche H, Meyer V, Boland A, Olaso R, Deleuze JF. Performance comparison of three DNA extraction kits on human whole-exome data from formalin-fixed paraffin-embedded normal and tumor samples. PLoS ONE. 2018;13(4):e0195471. - PMC - PubMed
-
- Hedegaard J, Thorsen K, Lund MK, Hein AK, Hamilton-Dutoit SJ, Vang S, Nordentoft I, Birkenkamp-Demtroder K, Kruhoffer M, Hager H, Knudsen B, Andersen CL, Sorensen KD, Pedersen JS, Orntoft TF, Dyrskjot L. Next-generation sequencing of RNA and DNA isolated from paired fresh-frozen and formalin-fixed paraffin-embedded samples of human cancer and normal tissue. PLoS ONE. 2014;9(5):e98187. - PMC - PubMed
Publication types
MeSH terms
Substances
LinkOut - more resources
Full Text Sources
Medical
Miscellaneous

