

Organic electrochemical transistor arrays for real-time mapping of evoked neurotransmitter release in vivo
- PMID: 32043970
- PMCID: PMC7075691
- DOI: 10.7554/eLife.50345
Organic electrochemical transistor arrays for real-time mapping of evoked neurotransmitter release in vivo
Abstract
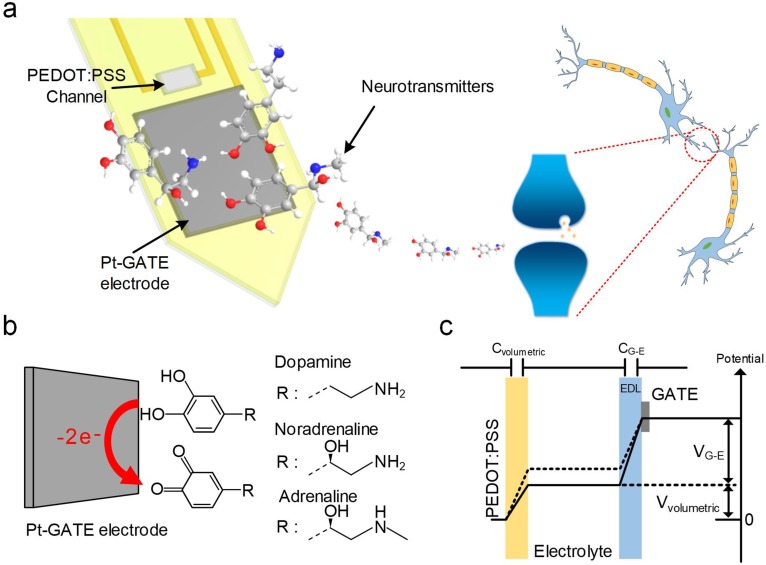
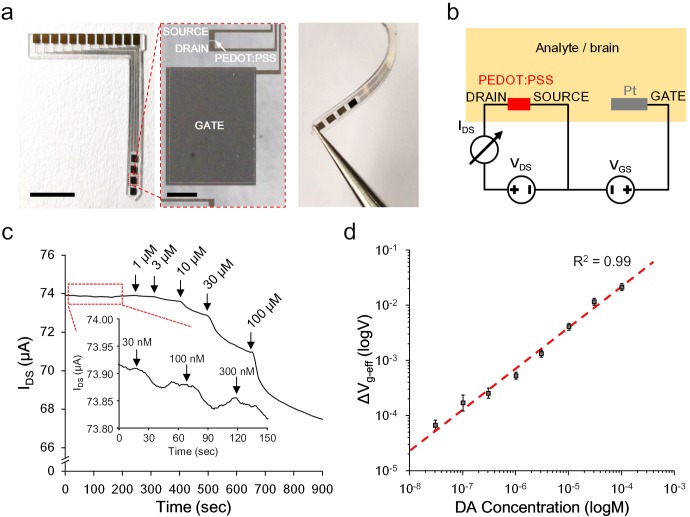
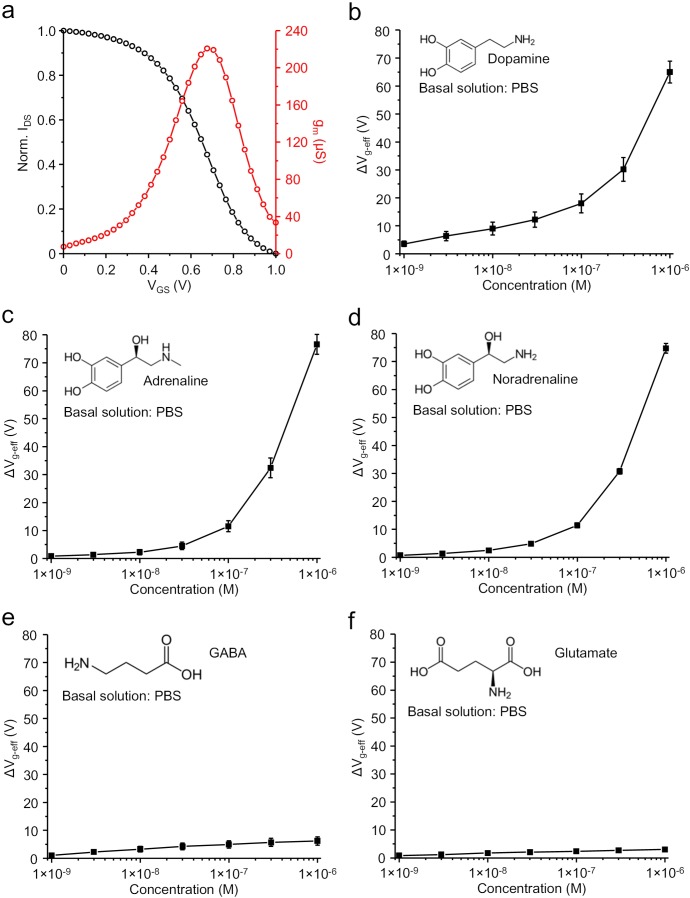
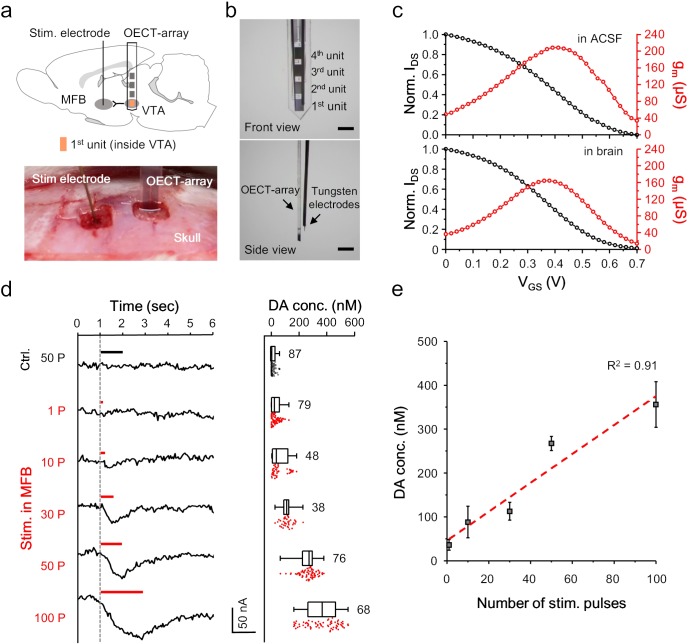
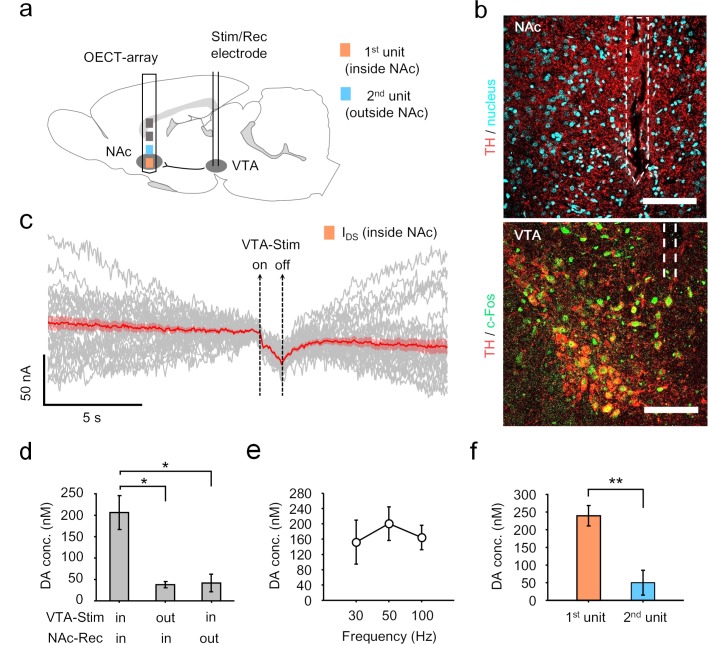
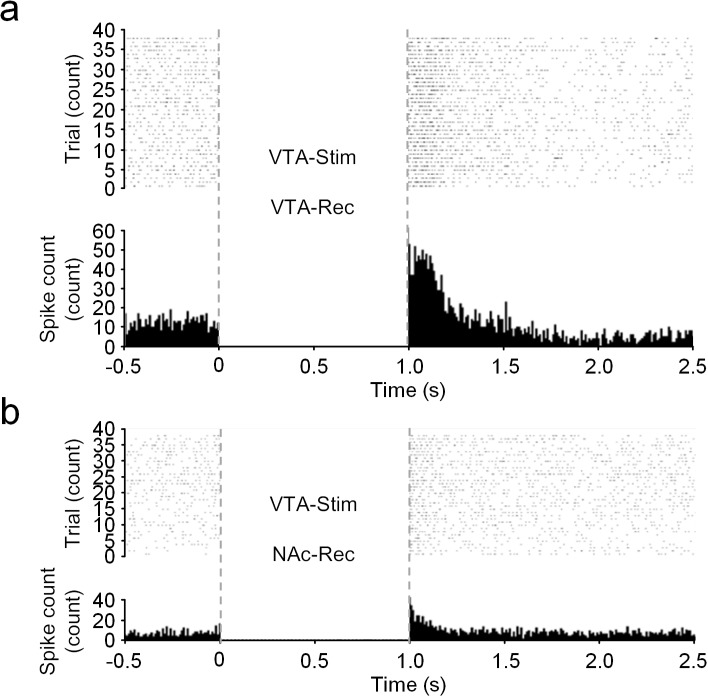
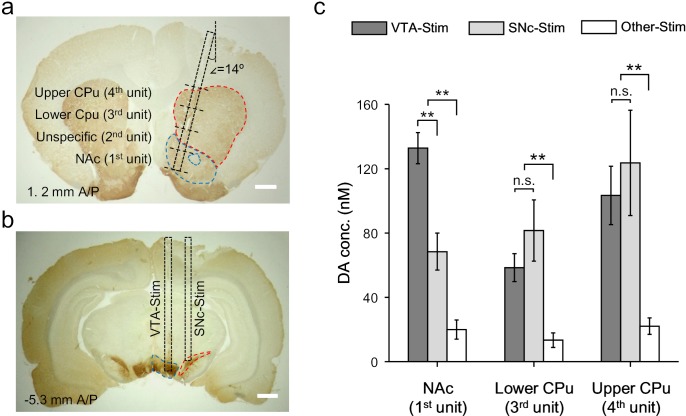
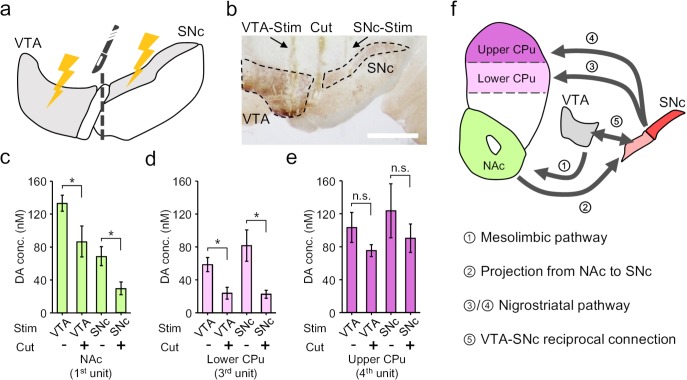
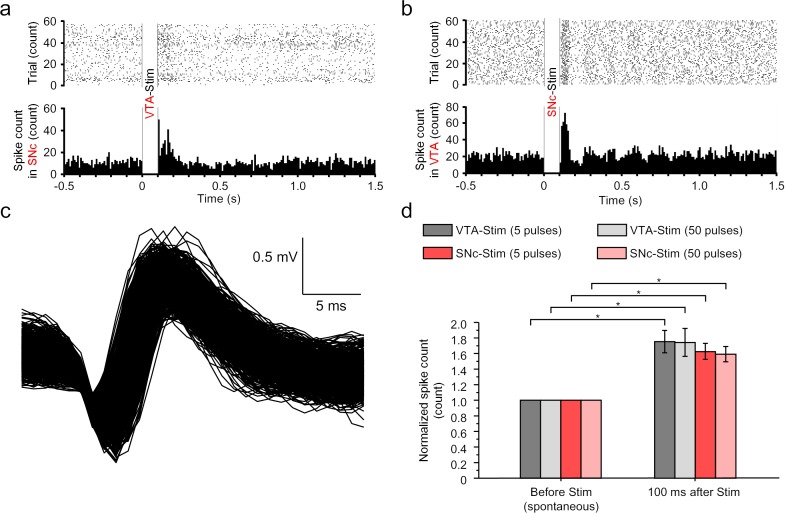
Though neurotransmitters are essential elements in neuronal signal transduction, techniques for in vivo analysis are still limited. Here, we describe an organic electrochemical transistor array (OECT-array) technique for monitoring catecholamine neurotransmitters (CA-NTs) in rat brains. The OECT-array is an active sensor with intrinsic amplification capability, allowing real-time and direct readout of transient CA-NT release with a sensitivity of nanomolar range and a temporal resolution of several milliseconds. The device has a working voltage lower than half of that typically used in a prevalent cyclic voltammetry measurement, and operates continuously in vivo for hours without significant signal drift, which is inaccessible for existing methods. With the OECT-array, we demonstrate simultaneous mapping of evoked dopamine release at multiple striatal brain regions in different physiological scenarios, and reveal a complex cross-talk between the mesolimbic and the nigrostriatal pathways, which is heterogeneously affected by the reciprocal innervation between ventral tegmental area and substantia nigra pars compacta.
Keywords: biochemistry; bioelectronics; brain circuits; chemical biology; dopaminergic signaling; neuroscience; neurotransmitter release; organic electrochemical transistor; organic electronics; rat.
Plain language summary
Cells in the nervous system pass messages using a combination of electrical and chemical signals. When an electrical impulse reaches the end of one cell, it triggers the release of chemicals called neurotransmitters, which pass the message along. Neurotransmitters can be either activating or inhibitory, determining whether the next cell fires its own electrical signal or remains silent. Currently, researchers lack effective methods for measuring neurotransmitters directly. Instead, methods mainly focus on electrical recordings, which can only tell when cells are active. One new approach is to use miniature devices called organic electrochemical transistors. Transistors are common circuit board components that can switch or amplify electrical signals. Organic electrochemical transistors combine these standard components with a semi-conductive material and a flexible membrane. When they interact with certain biological molecules, they release electrons, inducing a voltage. This allows organic electrochemical transistors to detect and measure neurotransmitter release. So far, the technology has been shown to work in tissue isolated from a brain, but no-one has used it to detect neurotransmitters inside a living brain. Xie, Wang et al. now present a new device that can detect the release of the neurotransmitter, dopamine, in real-time in living rats. The device is a miniature microarray of transistors fixed to a blade-shaped film. Xie, Wang et al. implanted this device into the brain of an anaesthetised rat and then stimulated nearby brain cells using an electrode. The device was able to detect the release of the neurotransmitter dopamine, despite there being a range of chemicals released inside the brain. It was sensitive to tiny amounts of the neurotransmitter and could distinguish bursts that were only milliseconds apart. Finally, Xie, Wang et al. also implanted the array across two connected brain areas to show that it was possible to watch different brain regions at the same time. This is the first time that transistor arrays have measured neurotransmitter release in a living brain. The new device works at low voltage, so can track brain cell activity for hours, opening the way for brand new neuroscience experiments. In the future, adaptations could extend the technology even further. More sensors could give higher resolution results, different materials could detect different neurotransmitters, and larger arrays could map larger brain areas.
© 2020, Xie et al.
Conflict of interest statement
KX, NW, XL, ZW, XZ, PF, HY, JK, JL, SC, FY, PS No competing interests declared
Figures
Similar articles
-
Wireless Instantaneous Neurotransmitter Concentration System-based amperometric detection of dopamine, adenosine, and glutamate for intraoperative neurochemical monitoring.J Neurosurg. 2009 Oct;111(4):701-11. doi: 10.3171/2009.3.JNS0990. J Neurosurg. 2009. PMID: 19425899 Free PMC article.
-
Development of the Wireless Instantaneous Neurotransmitter Concentration System for intraoperative neurochemical monitoring using fast-scan cyclic voltammetry.J Neurosurg. 2009 Oct;111(4):712-23. doi: 10.3171/2009.3.JNS081348. J Neurosurg. 2009. PMID: 19425890 Free PMC article.
-
Fast-Scanning Potential-Gated Organic Electrochemical Transistors for Highly Sensitive Sensing of Dopamine in Living Rat Brain.Angew Chem Int Ed Engl. 2022 Aug 1;61(31):e202204134. doi: 10.1002/anie.202204134. Epub 2022 Jun 23. Angew Chem Int Ed Engl. 2022. PMID: 35583258
-
In Vivo Observations of Rapid Scattered Light Changes Associated with Neurophysiological Activity.In: Frostig RD, editor. In Vivo Optical Imaging of Brain Function. 2nd edition. Boca Raton (FL): CRC Press/Taylor & Francis; 2009. Chapter 5. In: Frostig RD, editor. In Vivo Optical Imaging of Brain Function. 2nd edition. Boca Raton (FL): CRC Press/Taylor & Francis; 2009. Chapter 5. PMID: 26844322 Free Books & Documents. Review.
-
Functionalized Organic Thin Film Transistors for Biosensing.Acc Chem Res. 2019 Feb 19;52(2):277-287. doi: 10.1021/acs.accounts.8b00448. Epub 2019 Jan 8. Acc Chem Res. 2019. PMID: 30620566 Review.
Cited by
-
Organic Electrochemical Transistors for Biomarker Detections.Adv Sci (Weinh). 2024 Jul;11(27):e2305347. doi: 10.1002/advs.202305347. Epub 2024 Jan 23. Adv Sci (Weinh). 2024. PMID: 38263718 Free PMC article. Review.
-
Microscale Sensor Arrays for the Detection of Dopamine Using PEDOT:PSS Organic Electrochemical Transistors.Sensors (Basel). 2024 Aug 14;24(16):5244. doi: 10.3390/s24165244. Sensors (Basel). 2024. PMID: 39204939 Free PMC article.
-
Memsensing by surface ion migration within Debye length.Nat Mater. 2025 Aug 1. doi: 10.1038/s41563-025-02312-9. Online ahead of print. Nat Mater. 2025. PMID: 40750833
-
Reconfiguration of organic electrochemical transistors for high-accuracy potentiometric sensing.Nat Commun. 2024 Aug 1;15(1):6499. doi: 10.1038/s41467-024-50792-1. Nat Commun. 2024. PMID: 39090103 Free PMC article.
-
Cleanroom-Free Direct Laser Micropatterning of Polymers for Organic Electrochemical Transistors in Logic Circuits and Glucose Biosensors.Adv Sci (Weinh). 2024 Jul;11(27):e2307042. doi: 10.1002/advs.202307042. Epub 2024 Jan 15. Adv Sci (Weinh). 2024. PMID: 38225700 Free PMC article.
References
-
- Bourdy R, Sánchez-Catalán MJ, Kaufling J, Balcita-Pedicino JJ, Freund-Mercier MJ, Veinante P, Sesack SR, Georges F, Barrot M. Control of the nigrostriatal dopamine neuron activity and motor function by the tail of the ventral tegmental area. Neuropsychopharmacology. 2014;39:2788–2798. doi: 10.1038/npp.2014.129. - DOI - PMC - PubMed
Publication types
MeSH terms
Substances
Grants and funding
- 11278616/Research Grants Council, University Grants Committee
- 11218015/Research Grants Council, University Grants Committee
- 11203017/Research Grants Council, University Grants Committee
- 06172336/Health and Medical Research Fund
- C5015-15G/Research Grants Council, University Grants Committee
- JCYJ20170818100342392/Science Technology and Innovation Committee of Shenzhen Municipality
- JCYJ20180507181624871/Science Technology and Innovation Committee of Shenzhen Municipality
- 81871452/National Natural Science Foundation of China
- 7005084/City University of Hong Kong
- 7005206/City University of Hong Kong
- 11278616/General Research Funds
- 11218015/General Research Funds
- 11203017/General Research Funds
- C5015-15G/Collaborative Research Funds
LinkOut - more resources
Full Text Sources
Research Materials
Miscellaneous
