. 2020 Feb 11:9:e52507.
doi: 10.7554/eLife.52507.

Postural control of arm and fingers through integration of movement commands

Affiliations

Postural control of arm and fingers through integration of movement commands

Scott T Albert et al. Elife. .

Abstract

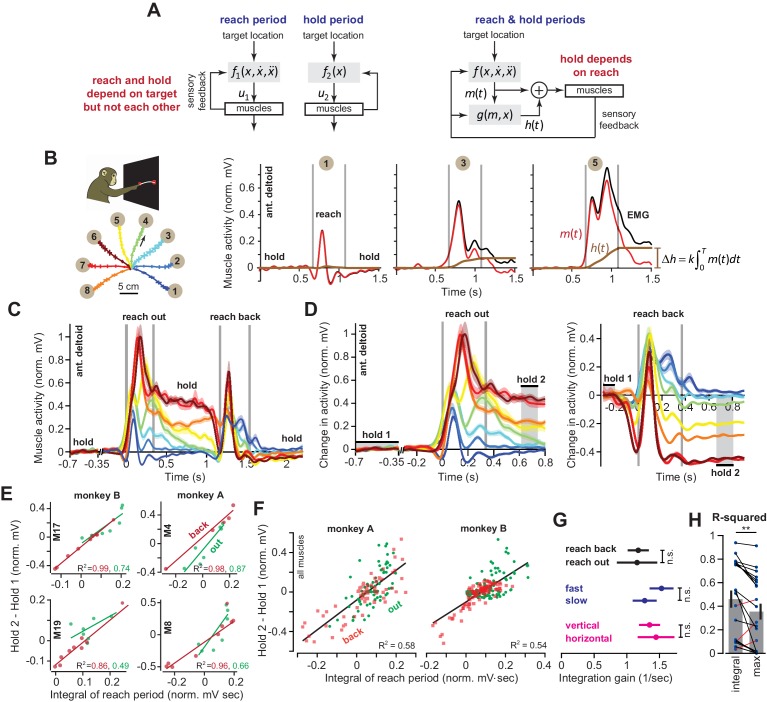
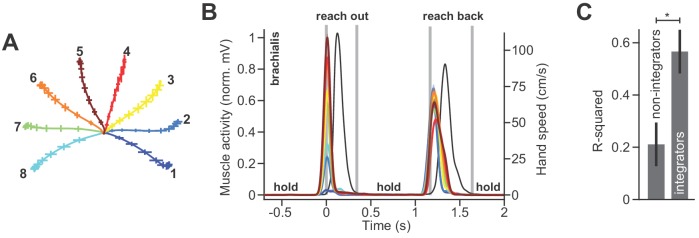
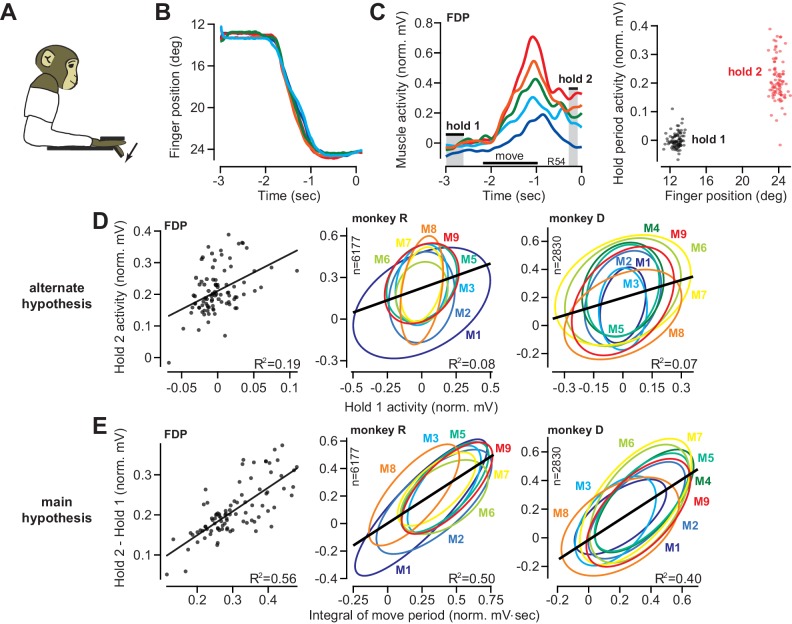
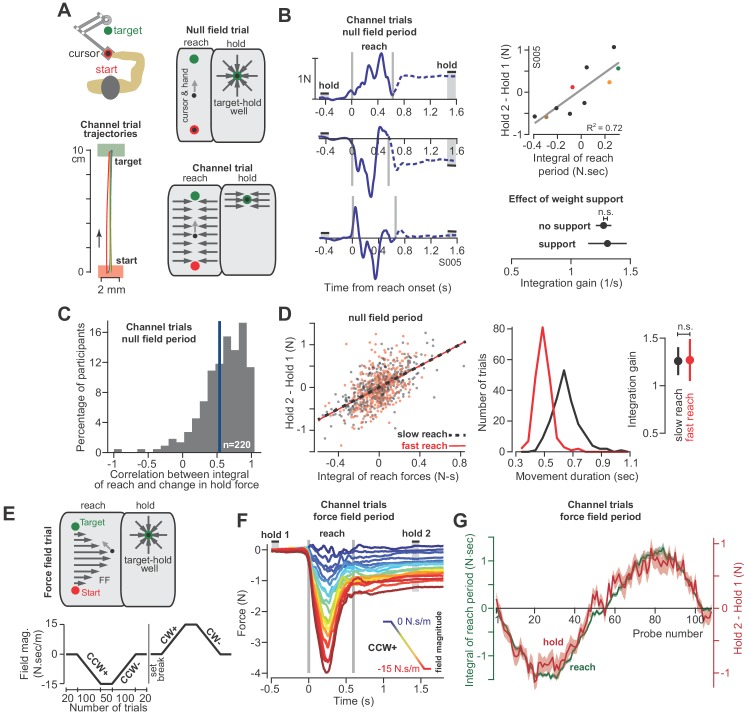
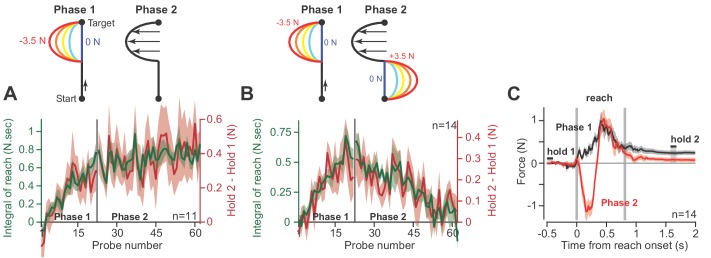
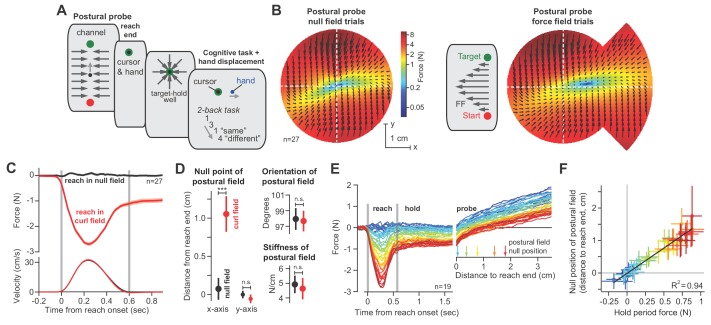
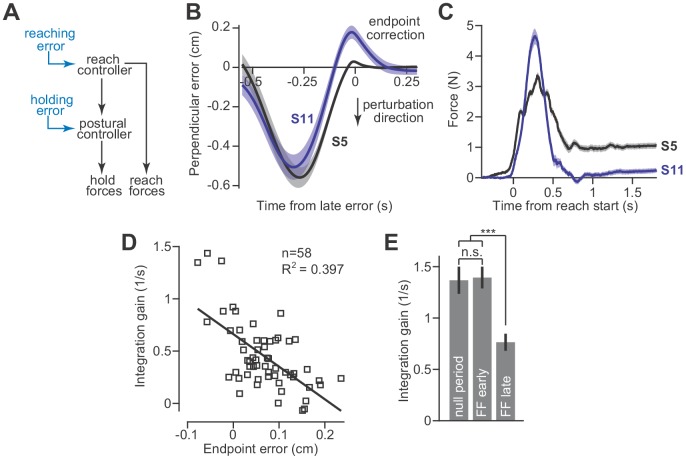
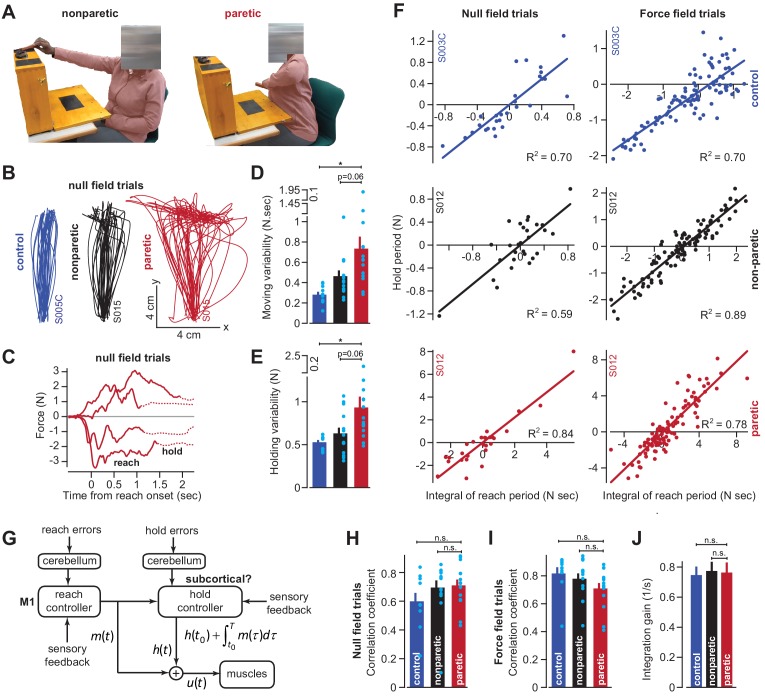
Every movement ends in a period of stillness. Current models assume that commands that hold the limb at a target location do not depend on the commands that moved the limb to that location. Here, we report a surprising relationship between movement and posture in primates: on a within-trial basis, the commands that hold the arm and finger at a target location depend on the mathematical integration of the commands that moved the limb to that location. Following damage to the corticospinal tract, both the move and hold period commands become more variable. However, the hold period commands retain their dependence on the integral of the move period commands. Thus, our data suggest that the postural controller possesses a feedforward module that uses move commands to calculate a component of hold commands. This computation may arise within an unknown subcortical system that integrates cortical commands to stabilize limb posture.

Keywords: Reaching; human; integration; motor control; motor learning; neuroscience; posture; rhesus macaque; stroke.

Plain language summary

Moving an arm requires the brain to send electrical signals to the arm’s muscles, causing them to contract. Neuroscientists call these types of brain signals “move signals”. The brain also sends so-called hold signals, which hold the arm still in a desired position. Part of the brain known as the primary motor cortex helps to calculate the move signals for the arm, but it was unclear how the brain produces the corresponding hold signals. Fortunately, the fact that the brain moves other things besides arms may help answer this question. Previous research has shown, for example, that a brain area called the “neural integrator” calculates the hold signals needed to hold the eye in a specific position. The neural integrator does this by using basic principles of physics, and details of the speed and duration of the eye’s movements. Now, Albert et al. show a similar mechanism appears to control hold signals for arm movements. In one set of experiments, muscle activity was measured as monkeys moved their arms or fingers to different target positions. In other experiments, human volunteers held a robot arm, and Albert et al. measured the forces they produced while reaching and holding still. Both the human and monkey experiments revealed a relationship between move signals and hold signals. Like for eye movements, hold signals for the arm could be calculated from the move signals. In further experiments with stroke patients where the brain had been damaged, the move signals were found to be deteriorated, but the way hold signals were calculated stayed the same. This suggests that there is an unknown structure within the brain that calculates hold signals based on move signals. Investigating how the brain holds the arm still may help scientists understand why some neurological conditions like stroke or dystonia cause unwanted movements or unusual postures. This might also lead scientists to develop new ways to treat these conditions.


Conflict of interest statement

SA, AH, JJ, AZ, DS, SB, MC, JK, RS No competing interests declared

Figures

Figure 1.
Figure 1.. Integral of muscle activity during the reach correlates with subsequent activity during the hold period.
(A) In current models (left), a feedback controller generates commands that move the arm, and then upon reach end, a postural controller holds the limb still. For this model, hold commands depend only on the target position. In the model considered here (right), the move commands are integrated in real-time by a postural controller. Thus, the hold commands depend on the preceding reach commands, not solely the target position. (B) Monkeys reached out to one of eight targets, waited, and then reached back to the home position. EMG from ant. deltoid is shown for three targets, and decomposed into m(t) and h(t) using Equation (5), with k = 1. (C) Normalized activity of anterior deltoid in Monkey B starting from the center location. Colors correspond to targets in part B. (D) Change in ant. deltoid EMG from the initial hold period for reach out and reach back components of the task. The bars for hold 1 and hold 2 indicate periods where hold activity was calculated. (E and F) Change in hold period activity for reach out (green) and reach back (red) components of the task as a function of the integral of the preceding reach period in two representative muscles for each monkey, and all muscles. (G) The integration gain (slope of the line in E) across various conditions: outward vs. return, fast vs. slow, horizontal target positions vs. other targets. (H) Comparison of two hypotheses: hold period activity relates linearly to integral of previous reach period, or hold period activity relates linearly to the maximum activity of the muscle in the previous reach period. Each point is a single muscle. Error bars are SEM. Statistics: **p<0.01 and n.s. p>0.05.
Figure 1—figure supplement 1.
Figure 1—figure supplement 1.. Muscles that do not integrate also do not contribute to posture.
(A) Two monkeys performed a reaching task in the vertical plane. The monkeys reached out to one of eight targets, waited, and then reached back to the home position. Trajectories for the outward reach are shown. (B) Normalized activity of brachialis in Monkey B. Colors correspond to targets in A. We selected this representative muscle to demonstrate that some muscles show little to no holding activity at most, if not all, targets. These muscles all tend to show early moving activity, well before peak speed, and then cease activity around halfway through the movement. The hand speed is shown in black. (C) We selected muscles that have little to no holding activity, that is those whose activity during the hold period has a magnitude less than 10% of the peak moving activity. There are 6 out of 20 muscles who had such a property for most, if not all holding locations. We quantified the change in holding activity (from before to after the movement) and the integral of moving activity. We asked how well the integral of moving activity predicted the change in holding activity (the variance accounted for, or R2) in muscles with little holding activity (non-integrators) and others that were more active during holding still (integrators). Error bars are SEM. Statistics: *p<0.05.
Figure 2.
Figure 2.. The integral of muscle activity during finger flexion correlates with subsequent activity during the hold period.
(A and B) Monkeys were trained to move their index finger from an initial position to a target against a load. The traces show representative movements. Positive displacements correspond to flexion. (C) Activity of flexor digitorum profundus (FDP) in monkey R. Left panel shows FDP activity for the trials shown in (B). The bars for hold 1 and hold 2 indicate periods was hold activity was calculated. Right panel shows FDP activity during the hold periods. Activity increased with flexion of the finger, but was variable from one trial to the next. (D) Evaluation of the hypothesis that variability in muscle activity at the hold 2 position could be explained by variability in the preceding hold 1 activity. Left panel is for the FDP muscle during a single session in monkey R. Center and right panels present data across all muscles recorded in each monkey. Each ellipse is the 95% confidence interval for a single muscle. R2 value refers to a linear fit across all trials and muscles. (E) Same as for (D), except here we test the hypothesis that variability in hold period activity is related to the integral of the preceding moving activity.
Figure 3.
Figure 3.. The integral of reaching forces correlates with forces produced during the subsequent hold period.
(A) Human participants held the handle of a robotic arm and made point-to-point reaching movements (top). On most trials, participants reached freely to the target. After the reach ended, a target-hold well held the hand in place (null field trial). On some trials, hand trajectory was constrained to a straight line (channel trial, trajectories shown at left). (B) Example lateral force traces on channel trials during the null field period (in a single subject). The bars hold 1 and hold 2 indicate the periods in which holding force levels were quantified. At top-right, we show the correlation between the integral of reach period forces and the change in holding force for this representative subject. At bottom-right, we compare the gain of integration (slope of the line at top-right) between conditions with and without weight support for the arm. (C) We calculated the correlation coefficient between the time-integral of reach forces and holding forces across all channel trials in the null field, within each individual (n = 220). The vertical blue line denotes the mean of the distribution. (D) For each subject, we selected their two fastest and two slowest movements in the null field, resulting in two distributions, with each subject represented equally in each distribution. We then performed linear regression on each distribution separately. Error bars for the integration gain are 95% CI at right. At middle, we show the distribution of reach duration. (E) After the null field period, we gradually introduced a velocity-dependent force field (top). We measured moving and holding forces as subjects adapted and de-adapted to counterclockwise (CCW) and clockwise (CW) force fields (bottom). (F) Each trace represents the force on one channel trial, averaged across participants during the CCW force field adaptation period. The vertical gray bars denote the start and end of the reaching movement. The color of each traces indicates the force field magnitude at each point in the experiment. The hold 1 and hold 2 bars indicate periods over which holding forces were quantified. (G) On each trial, we calculated the time-integral of forces during reaching (green) and compared these to the change in holding force (red). Values are mean ± SEM across all participants. Statistics: n.s. p>0.05.
Figure 3—figure supplement 1.
Figure 3—figure supplement 1.. Holding forces are sustained across long time intervals.
Participants (n = 7) were exposed to a CCW velocity-dependent curl force that increased in magnitude across many trials. Here, we show the lateral force (top) and hand velocity (bottom) after exposure to maximal field strength. The vertical line denotes the end of the movement, hence, the start of the holding period. On the trials shown, participants held the hand at the target and waited for a long inter-trial-interval to start the next reaching movement. During this period of time, participants engaged in a working memory task.
Figure 4.
Figure 4.. Holding forces are an integration of moving forces, not a continuation.
We designed a set of experiments to test the possibility that hold period forces are a continuation, not an integral, of moving forces. (A) Participants (n = 11) reached in a force field that was active only during the second half of the reach. In Phase 1 (left), we gradually increased the magnitude of the force field. In Phase 2 (right), we maintained this force field for several hundred trials. We measured the change in holding force (right, red) and the integral of moving force (left, green) throughout adaptation. (B) A new set of participants (n = 14) repeated Phase 1 (left), but during Phase 2 (right) an opposite force field was gradually applied to the first half of the movement. As the integral of move period force approached zero in Phase 2, so did holding force. (C) The mean force profile over trials sampled from Phases 1 and 2 for the experiment in part B. Values are mean ± SEM across all participants.
Figure 5.
Figure 5.. The null point of the postural field is set by the integral of reaching forces.
(A) To measure the arm’s postural field, we slowly displaced the hand during the holding period, while participants were distracted with a working memory task. (B) We measured the forces applied to the handle (left). We re-measured these forces after participants were exposed to a velocity-dependent curl field (at right). Forces were measured by displacing the hand outwards along 12 different lines. Interior estimates for the force were made using two-dimensional linear interpolation. The magnitude and direction of these interpolated forces are indicated by the black arrows. Color reiterates the restoring force magnitude. The holding position at reach end is located at the intersection of the two dashed white lines. (C) We measured lateral forces applied to the channel walls during reaching movements (null field period, black, and curl field period, red). (D) We used a two-dimensional spring model to quantify postural field properties: null point, orientation, and stiffness (null field and curl field in black and red). (E) To test if holding forces were related to the null point of the postural field, participants (n = 19) were exposed to a curl field that gradually increased over trials. During holding, we recorded hand forces (right inset) as the arm was displaced in the direction of holding forces. Arrows show the location of the null point (zero-crossing) on selected trials. (F) We calculated the holding force before displacement of the hand, and the corresponding postural null point on each trial. Values are trial means and 95% CIs for distributions bootstrapped across participants. Linear regression was performed on the bootstrapped estimates (black line). Error bars denote mean ± SEM in panels (C and D). Statistics: ***p<10−3 and n.s. p>0.05.
Figure 6.
Figure 6.. Adaptation of the integration gain.
(A) To maintain endpoint stability after adaptation of the reach controller, the postural controller must also adapt. (B) We hypothesized that integrator adaptation would be driven by errors in hand trajectory that occur near the end of the reach. To detect these errors, we looked for deviations in the reach trajectory after the reach exceeded 80% of its displacement. We spatially aligned reaches by subtracting off the terminal hand position and then temporally aligned the reach trajectories to the point in time at which the hand had the largest endpoint error. These errors are marked as ‘endpoint correction’. Here, we show the average reach trajectory during adaptation to a gradual force field for two subjects, one who exhibited integration (S5), and one who did not (S11). (C) The average forces produced at the end of adaptation for the same two subjects. Note that the subject with large errors near reach endpoint no longer generated holding forces at the end of adaptation. (D) We measured the gain of integration at the end of the adaptation period, for subjects that adapted to gradual force fields. We also measured the magnitude and sign of the late reach errors. Larger errors led to a reduction in gain. Each data point is one subject. (E) To confirm that the integration gain changed over the course of adaptation, and not immediately upon introduction of the force field, we compared the gain during the null period, with gains measured during early and late parts of adaptation using a repeated measures ANOVA. Values are mean ± SEM across participants. Statistics: ***p<10−3 and n.s. p>0.05.
Figure 7.
Figure 7.. Cortical reaching commands are integrated in a subcortical area.
(A) Stroke survivors (n = 14) participated in a set of clinical exams to measure functional impairment. Shown are isolated images for an extension-based task, for the non-paretic (top) and paretic (bottom) arms of an example participant (S015). The instruction is to place a rectangular block on the elevated surface. Images show the moment of maximal extension for the paretic (right) and nonparetic (left) arms. (B) To improve the range of motion of the arm, patients and healthy controls performed reaching movements holding the robotic handle, with the arm supported by an air sled. Shown are example trajectories during an initial null field period for the representative patient (black is nonparetic, red is paretic) in A, and a control participant (blue). (C) Example force traces during null field block in channel trials. The solid line denotes forces during moving. The dashed line denotes forces during holding still. (D and E) We measured the integral of moving forces (D) and holding forces (E) on each channel trial. We measured the trial-by-trial variability (standard deviation) of these quantities across all movements in the null field. (F, H, I, and J) We compared trial-by-trial fluctuations in moving and holding forces during the null field period (F, left panel). Next, we gradually adapted subjects to a velocity-dependent force field and compared within-trial integral of moving forces with subsequent holding force (F, right panel). Data are shown for a representative stroke patient and healthy control. We calculated the correlation coefficient between reaching and holding forces during the initial null field period (H) and force field period (I). We measured the slope of the integration function (i.e., the integration gain) across all trials within individual subjects (J). (G) Our conjecture that the cortex generates reaching commands which are then integrated in a subcortical area spared by cortical stroke. Values are mean ± SEM across participants. Points represent individual trials in F. Points represent individual subjects in D, E, H, and I. Statistics: *p<0.05, and n.s. p>0.05.
Author response image 1.

References

    1. Albert ST, Shadmehr R. The neural feedback response to error as a teaching signal for the motor learning system. Journal of Neuroscience. 2016;36:4832–4845. doi: 10.1523/JNEUROSCI.0159-16.2016. - DOI - PMC - PubMed
    1. Cannon SC, Robinson DA. Loss of the neural integrator of the oculomotor system from brain stem lesions in monkey. Journal of Neurophysiology. 1987;57:1383–1409. doi: 10.1152/jn.1987.57.5.1383. - DOI - PubMed
    1. Cheron G, Godaux E, Laune JM, Vanderkelen B. Lesions in the cat prepositus complex: effects on the vestibulo-ocular reflex and saccades. The Journal of Physiology. 1986;372:75–94. doi: 10.1113/jphysiol.1986.sp015998. - DOI - PMC - PubMed
    1. Coderre AM, Zeid AA, Dukelow SP, Demmer MJ, Moore KD, Demers MJ, Bretzke H, Herter TM, Glasgow JI, Norman KE, Bagg SD, Scott SH. Assessment of upper-limb sensorimotor function of subacute stroke patients using visually guided reaching. Neurorehabilitation and Neural Repair. 2010;24:528–541. doi: 10.1177/1545968309356091. - DOI - PubMed
    1. Cohen B, Komatsuzaki A. Eye movements induced by stimulation of the pontine reticular formation: evidence for integration in oculomotor pathways. Experimental Neurology. 1972;36:101–117. doi: 10.1016/0014-4886(72)90139-2. - DOI - PubMed

Publication types