. 2020 Jun;1469(1):105-124.
doi: 10.1111/nyas.14308. Epub 2020 Feb 11.

Environmental catastrophes, climate change, and attribution

Affiliations

Environmental catastrophes, climate change, and attribution

Elisabeth A Lloyd et al. Ann N Y Acad Sci. 2020 Jun.

Abstract

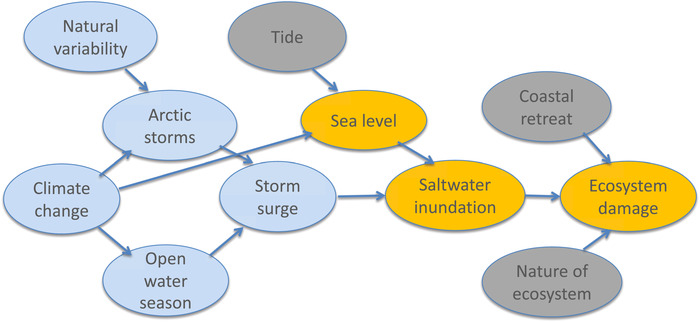
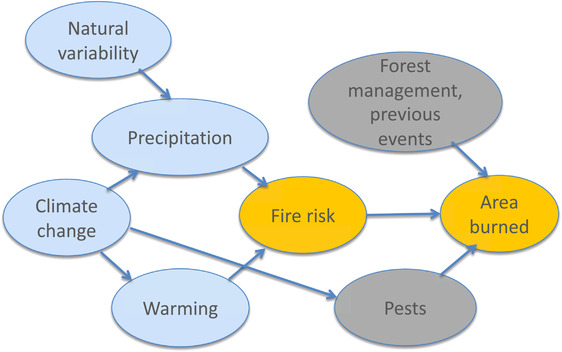
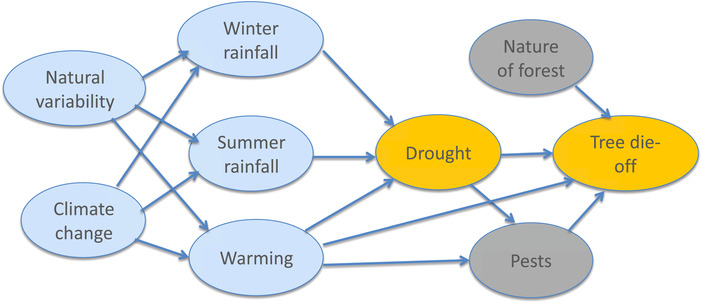
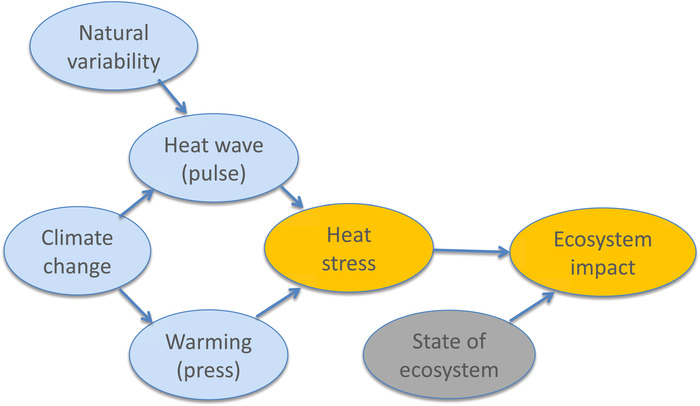
In our discussion of environmental and ecological catastrophes or disasters resulting from extreme weather events, we unite disparate literatures, the biological and the physical. Our goal is to tie together biological understandings of extreme environmental events with physical understandings of extreme weather events into joint causal accounts. This requires fine-grained descriptions, in both space and time, of the ecological, evolutionary, and biological moving parts of a system together with fine-grained descriptions, also in both space and time, of the extreme weather events. We find that both the "storyline" approach to extreme event attribution and the probabilistic "risk-based" approach have uses in such descriptions. However, the storyline approach is more readily aligned with the forensic approach to evidence that is prevalent in the ecological literature, which cultivates expert-based rules of thumb, that is, heuristics, and detailed methods for analyzing causes and mechanisms. We introduce below a number of preliminary examples of such studies as instances of what could be pursued in the future in much more detail.

Keywords: attribution; climate change; ecology; ecosystems; environmental catastrophe; extreme weather events.


Figures

Figure 1
Figure 1
The effect of anthropogenic climate change on July heat waves over western Russia, motivated by the extreme heat wave of summer 2010. In both panels, the actual event magnitude is indicated with the solid black line and the July mean temperature during the 1960s with the dashed blue line, together with modeled estimates of the likelihood of exceeding a particular temperature threshold for both 1960s (green) and 2000s (blue) conditions, in terms of either probability or return time. The left panel shows magnitude versus probability, while the right panel shows probability versus magnitude. The two black arrows in each panel point to the observed event in the factual calculation. Anthropogenic climate change is seen to have increased both the magnitude and the probability of the heat wave. From Ref. 2, and adapted from Ref. 16.
Figure 2
Figure 2
CMIP5 projections of changes in annual mean temperature (top) and in boreal winter and summer precipitation (middle and bottom) by the end of the century under the RCP8.5 forcing scenario. Stippling indicates where the model projections are robust, in the sense of agreeing on the sign of the change; otherwise, the models do not agree. Hatching indicates where the average model changes are small compared with internal variability, but this does not mean that individual model changes are small. Warming is robust over all land areas. Precipitation changes can be of either sign and are nonrobust over the regions and seasons discussed in our case studies. From Ref. 64.
Figure 3
Figure 3
The modeled effect of anthropogenic climate change on wintertime flooding in the Thames Valley, motivated by the flooding in winter 2013/2014. Top left: January mean precipitation over Southern England. Top right: Return periods for a “stuck” jet stream, labeled “ZO.” Bottom left: Return periods for 30‐day peak flows for the Thames at Kingston, close to London. Bottom right: Difference in number of properties at risk of flooding as a function of return period. The estimates from the factual calculation are shown as a set of red points, and from each counterfactual calculation (using different estimates of the anthropogenic change in sea‐surface temperatures) as a set of light blue points, with the average shown in dark blue. From Ref. 20, with permission.
Figure 4
Figure 4
Causal network for discussion of Thames Valley flooding. Arrows indicate the direction of causal influence, but can include the effects of feedbacks. Note that “warming” and “jet stream” are not independent, as they are both affected by “climate change.” The blue shading indicates elements whose causality lies in the weather and climate domain, the gray shading indicates those in the environment and ecosystems domain, and the orange shading indicates a combination of the two. See the text for further details concerning this example.
Figure 5
Figure 5
Causal network for discussion of Arctic ecosystem collapse. Arrows indicate direction of causal influence but can include the effects of feedbacks. The blue shading indicates elements whose causality lies in the weather and climate domain, the gray shading those in the environment and ecosystems domain, and the orange shading a combination of the two. See text for further details concerning this example.
Figure 6
Figure 6
Causal network for discussion of wildfires. Arrows indicate direction of causal influence but can include the effects of feedbacks. The blue shading indicates elements whose causality lies in the weather and climate domain, the gray shading those in the environment and ecosystems domain, and the orange shading a combination of the two. See text for further details concerning this example.
Figure 7
Figure 7
Causal network for discussion of tree die‐off. Arrows indicate direction of causal influence but can include the effects of feedbacks. The blue shading indicates elements whose causality lies in the weather and climate domain, the gray shading those in the environment and ecosystems domain, and the orange shading a combination of the two. See text for further details concerning this example.
Figure 8
Figure 8
Causal network for discussion of heat stress–driven ecosystem tipping points. Arrows indicate direction of causal influence but can include the effects of feedbacks. The blue shading indicates elements whose causality lies in the weather and climate domain, the gray shading those in the environment and ecosystems domain, and the orange shading a combination of the two. See text for further details concerning this example.

References

    1. Intergovernmental Science‐Policy Platform on Biodiversity and Ecosystem Services 2019. Summary for policymakers of the global assessment report on biodiversity and ecosystem services of the Intergovernmental Science‐Policy Platform on Biodiversity and Ecosystem Services. Bonn, Germany: IPBES Secretariat.
    1. National Academies of Sciences, Engineering and Medicine 2016. Attribution of Extreme Weather Events in the Context of Climate Change. Washington, DC: The National Academies Press.
    1. Intergovernmental Panel on Climate Change 2012. Managing the risks of extreme events and disasters to advance climate change adaptation. A Special Report of Working Groups I and II of the Intergovernmental Panel on Climate Change. Cambridge University Press.
    1. Shepherd, T.G. 2016. A common framework for approaches to extreme event attribution. Curr. Clim. Change Rep. 2: 28–38.
    1. Zscheischler, J. , Westra S., van den Hurk B.J.J.M., et al 2018. Future climate risk from compound events. Nat. Clim. Change 8: 469–477.

Publication types