

Machine learning models for net photosynthetic rate prediction using poplar leaf phenotype data
- PMID: 32045452
- PMCID: PMC7012418
- DOI: 10.1371/journal.pone.0228645
Machine learning models for net photosynthetic rate prediction using poplar leaf phenotype data
Abstract
Background: As an essential component in reducing anthropogenic CO2 emissions to the atmosphere, tree planting is the key to keeping carbon dioxide emissions under control. In 1992, the United Nations agreed to take action at the Earth Summit to stabilize and reduce net zero global anthropogenic CO2 emissions. Tree planting was identified as an effective method to offset CO2 emissions. A high net photosynthetic rate (Pn) with fast-growing trees could efficiently fulfill the goal of CO2 emission reduction. Net photosynthetic rate model can provide refernece for plant's stability of photosynthesis productivity.
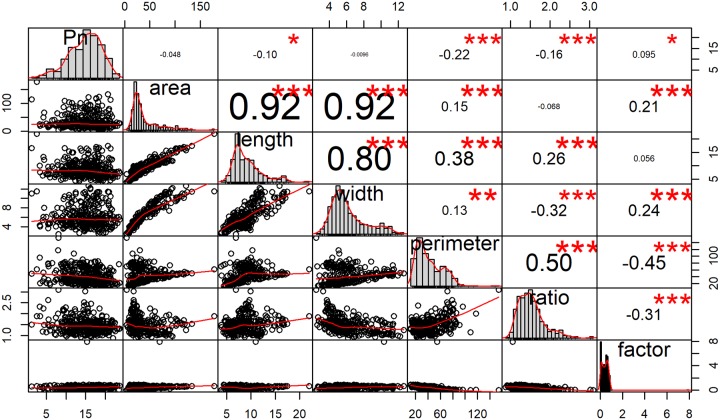
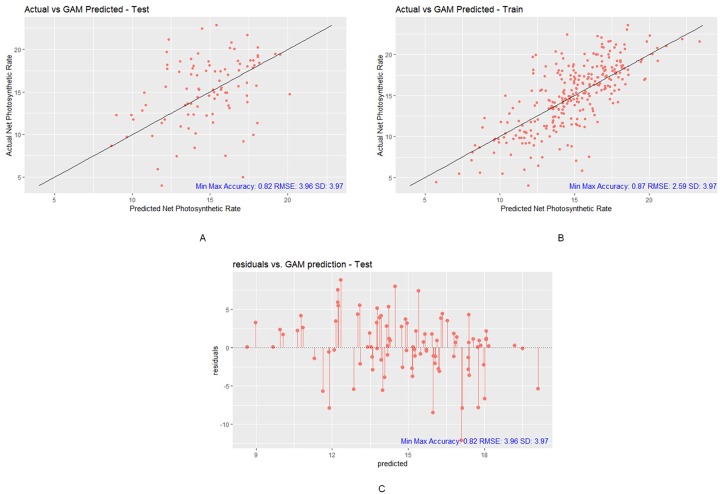
Methods and results: Using leaf phenotype data to predict the Pn can help effectively guide tree planting policies to offset CO2 release into the atmosphere. Tree planting has been proposed as one climate change solution. One of the most popular trees to plant are poplars. This study used a Populus simonii (P. simonii) dataset collected from 23 artificial forests in northern China. The samples represent almost the entire geographic distribution of P. simonii. The geographic locations of these P. simonii trees cover most of the major provinces of northern China. The northwestern point reaches (36°30'N, 98°09'E). The northeastern point reaches (40°91'N, 115°83'E). The southwestern point reaches (32°31'N, 108°90'E). The southeastern point reaches (34°39'N, 113°74'E). The collected data on leaf phenotypic traits are sparse, noisy, and highly correlated. The photosynthetic rate data are nonnormal and skewed. Many machine learning algorithms can produce reasonably accurate predictions despite these data issues. Influential outliers are removed to allow an accurate and precise prediction, and cluster analysis is implemented as part of a data exploratory analysis to investigate further details in the dataset. We select four regression methods, extreme gradient boosting (XGBoost), support vector machine (SVM), random forest (RF) and generalized additive model (GAM), which are suitable to use on the dataset given in this study. Cross-validation and regularization mechanisms are implemented in the XGBoost, SVM, RF, and GAM algorithms to ensure the validity of the outputs.
Conclusions: The best-performing approach is XGBoost, which generates a net photosynthetic rate prediction that has a 0.77 correlation with the actual rates. Moreover, the root mean square error (RMSE) is 2.57, which is approximately 35 percent smaller than the standard deviation of 3.97. The other metrics, i.e., the MAE, R2, and the min-max accuracy are 1.12, 0.60, and 0.93, respectively. This study demonstrates the ability of machine learning models to use noisy leaf phenotype data to predict the net photosynthetic rate with significant accuracy. Most net photosynthetic rate prediction studies are conducted on herbaceous plants. The net photosynthetic rate prediction of P. simonii, a kind of woody plant, illustrates significant guidance for plant science or environmental science regarding the predictive relationship between leaf phenotypic characteristics and the Pn for woody plants in northern China.
Conflict of interest statement
Author Andrew Siu was employed by Amgen. This disclosure does not alter our adherence to the PLOS ONE polices on sharing data and materials. All authors declare no competing interests.
Figures


References
-
- Masson-Delmotte V, Zhai P, Pörtner HO, Roberts D, J Skea PRS, Pirani A, et al. 2018: Global warming of 1.5°C. An IPCC Special Report on the impacts of global warming of 1.5°C above pre-industrial levels and related global greenhouse gas emission pathways, in the context of strengthening the global response to the threat of climate change, sustainable development, and efforts to eradicate poverty. 2018.
-
- Tyrchniewicz A, Meyer M. Offsetting CO2 emissions tree planting on the prairies. 2002.
-
- Shipley B, Vile D, Garnier E, Wright IJ, Poorter H. Functional linkages between leaf traits and net photosynthetic rate: reconciling empirical and mechanistic models. Functional Ecology. 2005;19(4):602–615. 10.1111/j.1365-2435.2005.01008.x - DOI
-
- Glime JM. Bryophyte Ecology, Vol. 1. Physiological Ecology. Michigan Technological University and the International Association of Bryologists; 2007. Available from: www.bryoecol.mtu.edu.
-
- Long S, Incoll L. The prediction and measurement of photosynthetic rate of Spartina townsendii (sensu lato) in the field. Journal of Applied Ecology. 1979; p. 879–891. 10.2307/2402861 - DOI
Publication types
MeSH terms
LinkOut - more resources
Full Text Sources
Research Materials
