. 2020 Apr;9(4):e1004.
doi: 10.1002/mbo3.1004. Epub 2020 Feb 11.

Changes in the community structure of the symbiotic microbes of wild amphibians from the eastern edge of the Tibetan Plateau

Affiliations

Changes in the community structure of the symbiotic microbes of wild amphibians from the eastern edge of the Tibetan Plateau

Liang Liang Xu et al. Microbiologyopen. 2020 Apr.

Abstract

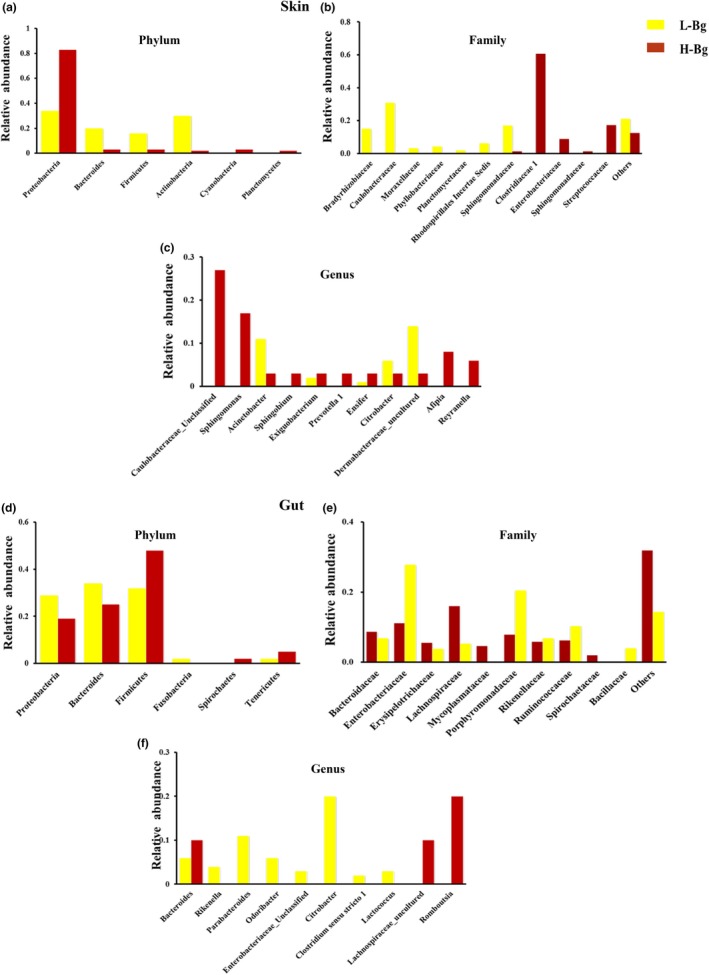
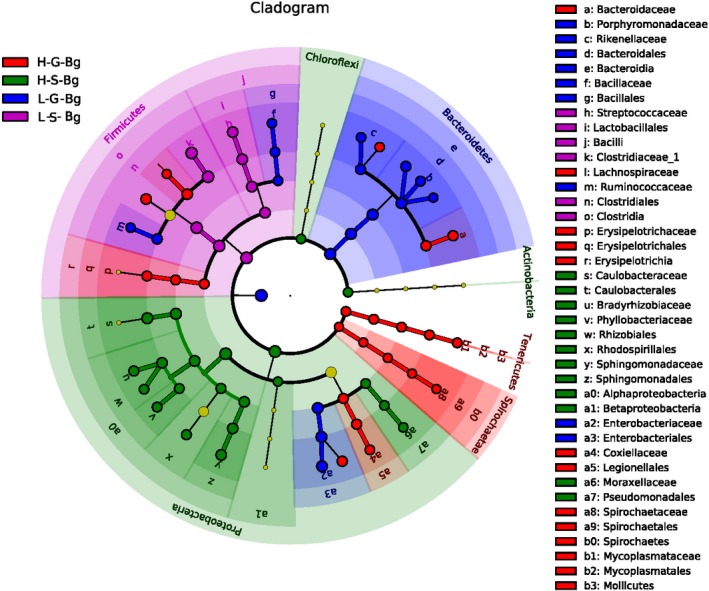
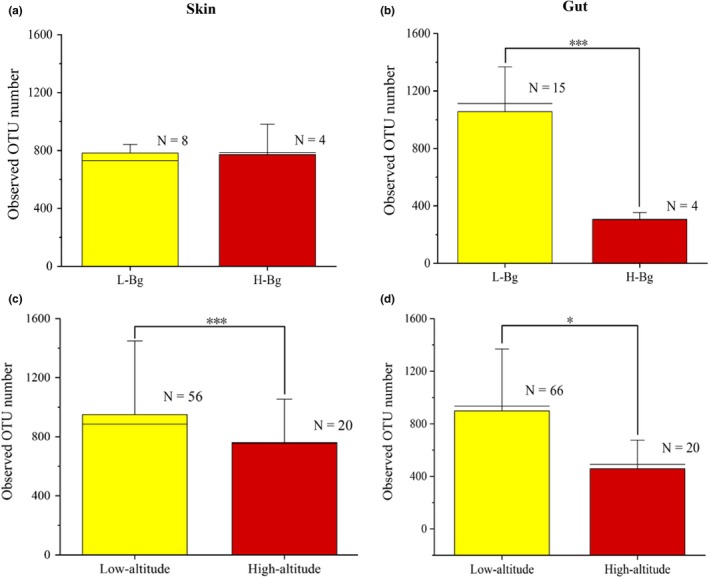
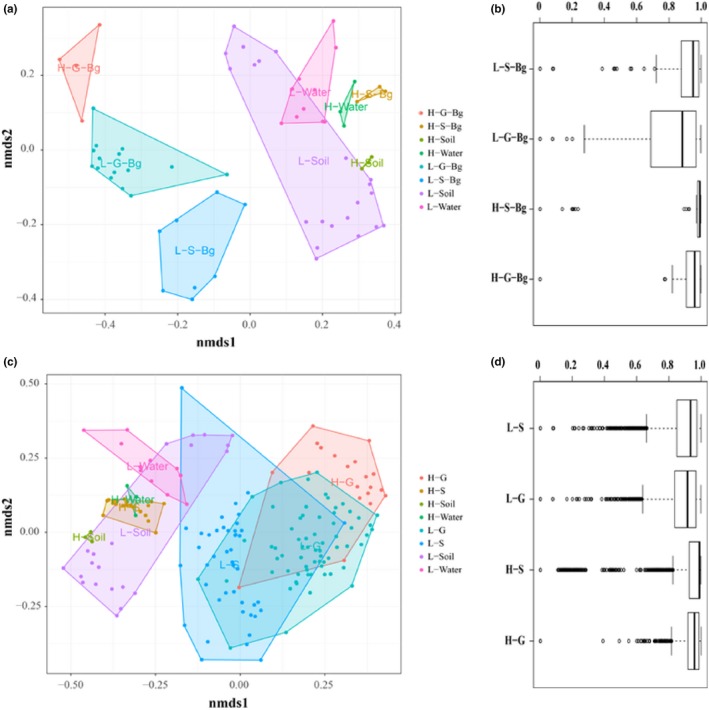
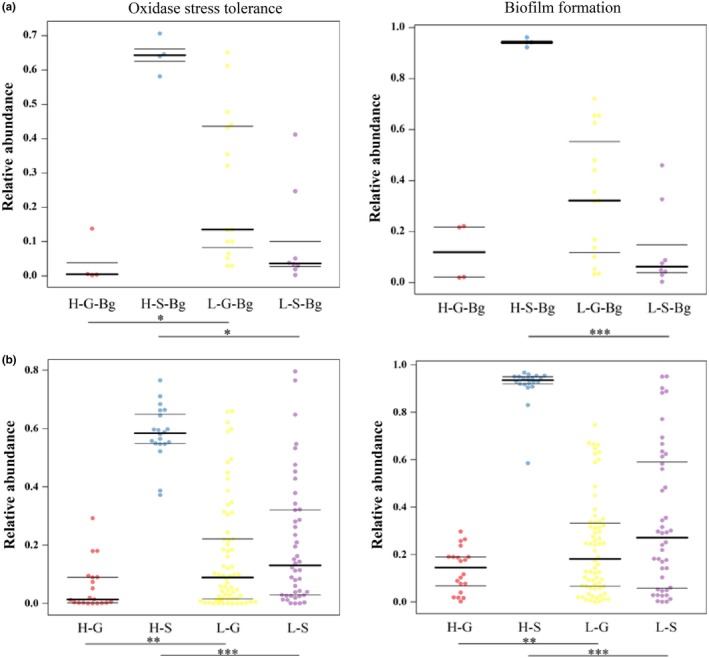
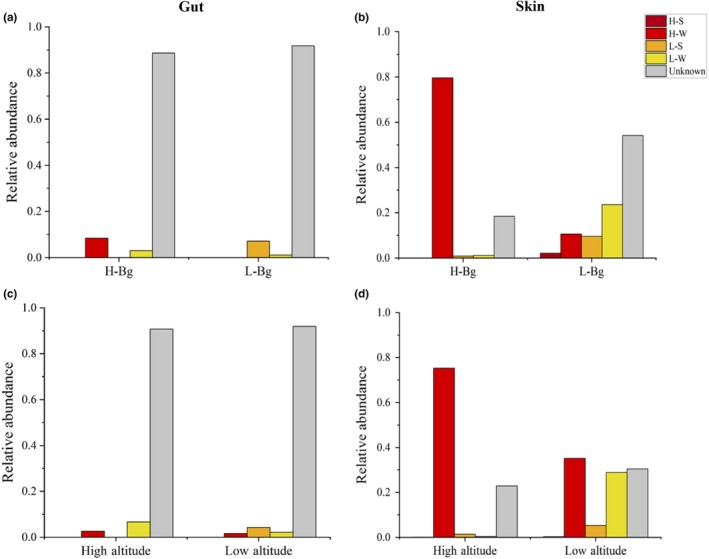
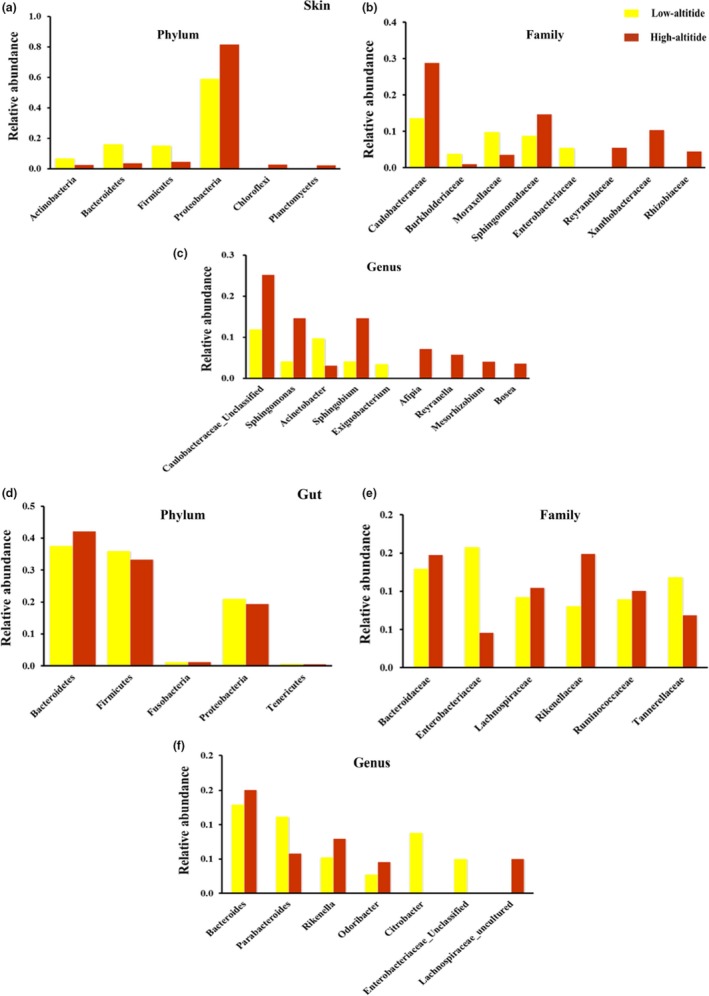
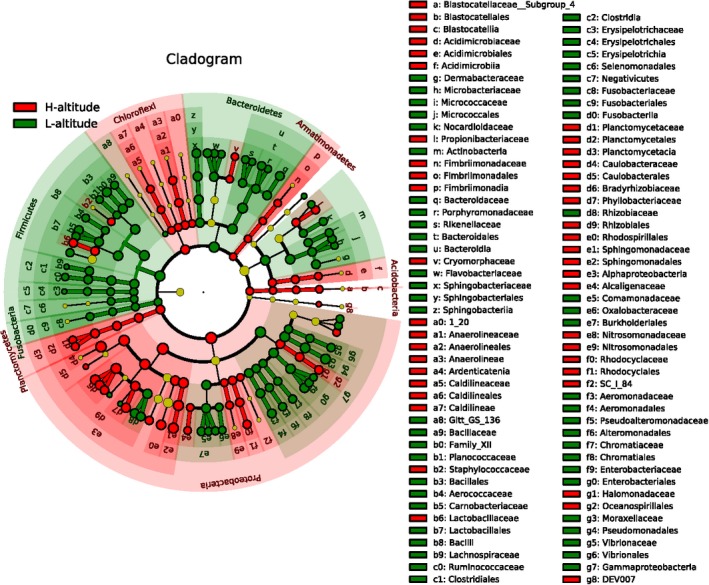
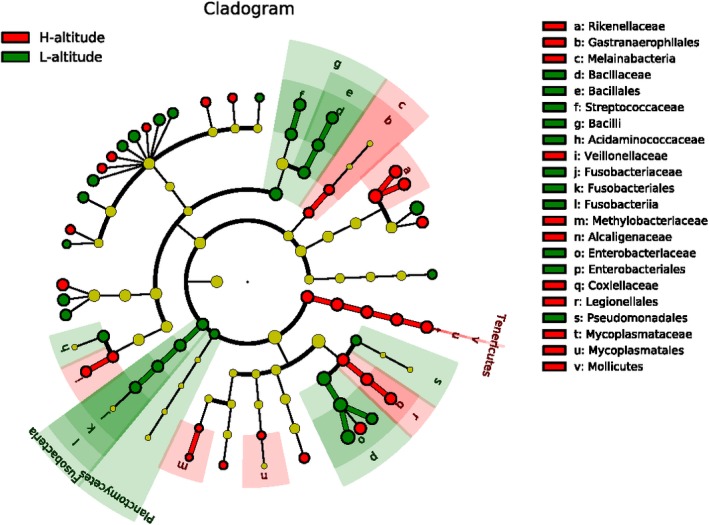
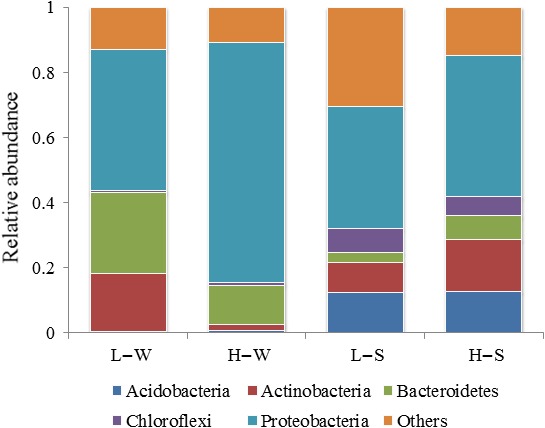
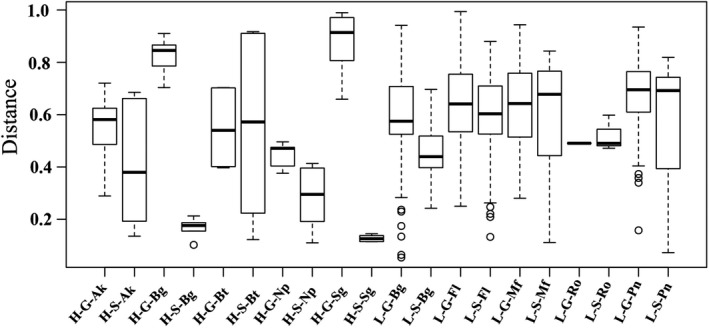
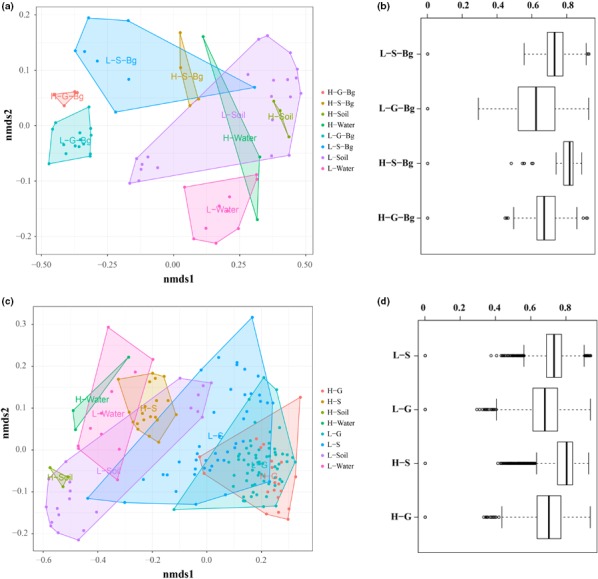
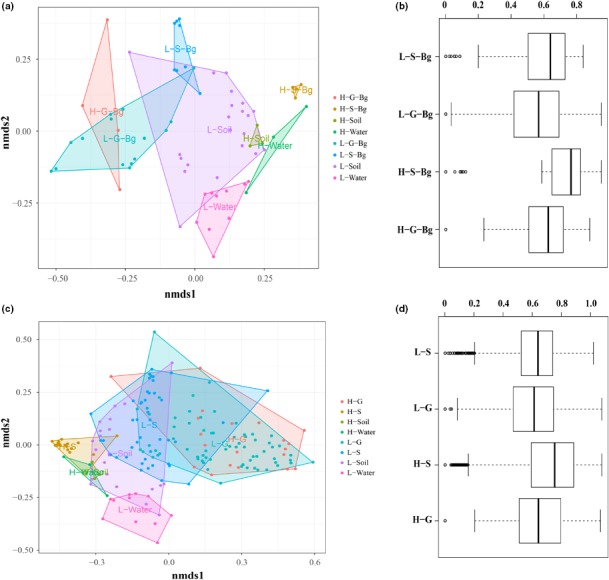
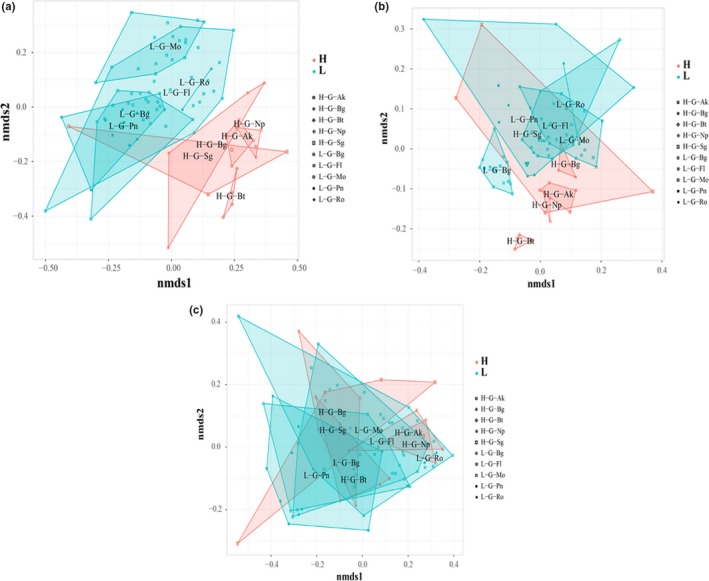
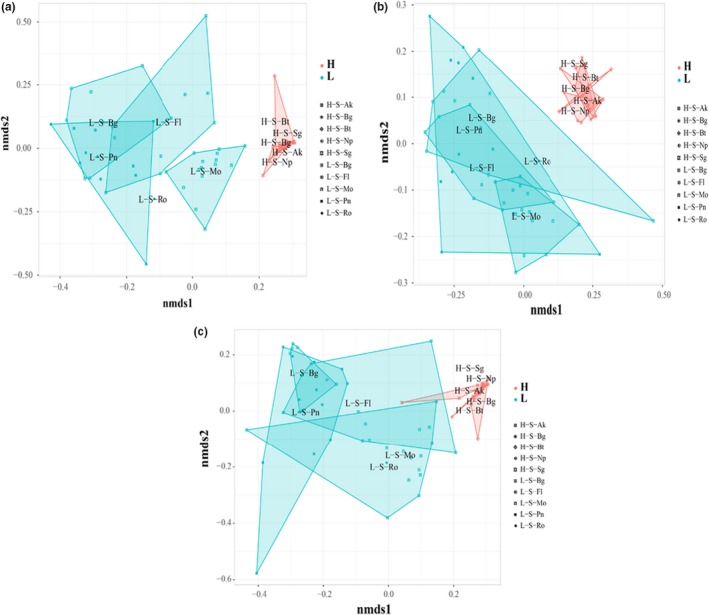
Environment has a potential effect on the animal symbiotic microbiome. Here, to study the potential relationship of the symbiotic microbiomes of wild amphibians with altitude, we collected the gut and skin samples from frogs (nine species) and the environmental samples (water and soil samples) from the Leshan Mountains (altitude: 360-410 m) and Gongga Mountains (altitude: 3340-3989 m) on the eastern edge of the Tibetan Plateau. Bufo gargarizans (Bg) samples were collected from both the Leshan and Gongga mountain regions (Bg was the only species sampled on both mountains). The DNA extracted from each sample was performed high-throughput sequencing (MiSeq) of bacterial 16S rRNA gene amplicons. High relative abundance of Caulobacteraceae and Sphingomonadaceae was found in skin samples from both Bg and the other high-altitude amphibians (nine species combined). High relative abundance of Coxiellaceae and Mycoplasmataceae was found in gut samples from both Bg and the other high-altitude amphibians. Furthermore, the alpha and beta diversities of skin and gut samples from Bg and the other amphibian species (nine species combined) were similar. In terms of the symbiotic microbial community, the low-altitude samples were less diverse and more similar to each other than the high-altitude samples were. We speculated that extreme high-altitude environments and host phylogeny may affect the amphibian microbiome. Despite the distinct microbial community differences between the skin and gut microbiomes, some functions were similar in the Bg and combined high-altitude samples. The Bg and high-altitude skin samples had higher oxidative stress tolerance and biofilm formation than the low-altitude skin samples. However, the opposite results were observed for the Bg and high-altitude gut samples. Further study is required to determine whether these characteristics favor high-altitude amphibian adaptation to extreme environments.

Keywords: Bufo gargarizans; altitude; amphibians; environmental adaptation; gut microbes; skin microbes.


Conflict of interest statement

None declared.

Figures

Figure 1
Figure 1
Symbiotic microbiome of Bufo gargarizans living at different altitudes. Histogram of the skin microbiota of B. gargarizans living at high and low altitudes at the phylum, family, and genus levels (a, b, c). Histogram of the gut flora of B. gargarizans living at high and low altitudes at the phylum, family, and genus levels (d, e, f)
Figure 2
Figure 2
Linear discriminant analysis effect size (LEfSe) of the skin and gut microbiome in Bufo gargarizans living at high and low altitudes. Cladogram of the LDA scores computed for differentially abundant features between low‐ and high‐altitude skin microbiomes. H‐, high altitude; L‐, low altitude; S‐, skin microbes; G‐, gut microbes; Bg (B. gargarizans). From the outside to the inside, the red‐ and green‐colored nodes represent the bacteria that displayed significant differences at the phylum, class, order, family, genus, and species levels. The yellow‐colored nodes represent bacteria displaying no significant difference
Figure 3
Figure 3
The alpha diversity of symbiotic microbiomes from Bufo gargarizans and amphibians living at different altitudes. Comparisons of the observed OTU number (average) for the skin microbes (a) and gut microbes (b) between low‐ and high‐altitude B. gargarizans. Comparisons of the observed OTU number (average) for the skin microbes (b) and gut microbes (d) between low‐ and high‐altitude amphibians (including all species in this study). The Mann–Whitney U test was used to test the differences between groups (*p < .05; ***p < .001). The error bars represent the standard deviation, and the long horizontal black line represents the link function, indicating the two samples involved in the comparison (n: represents sample size)
Figure 4
Figure 4
Effects of altitude on the symbiotic microbial community. The dissimilarities (Bray–Curtis distance) among the symbiotic microbiomes of Bufo gargarizans (a) and amphibians (c) living at different altitudes were quantified using nonmetric multidimensional scaling (NMDS). The summarized dissimilarity within the same type of symbiotic microbiome for B. gargarizans (b) and amphibians (d). H‐G, high‐altitude gut samples; H‐S, high‐altitude skin samples; H‐S‐Bg, high‐altitude B. gargarizans skin samples; H‐G‐Bg, high‐altitude B. gargarizans gut samples. H‐Soil, high‐altitude soil samples; H‐Water, high‐altitude water samples; L‐G, low‐altitude gut samples; L‐S, low‐altitude skin samples; L‐S‐Bg, low‐altitude B. gargarizans skin samples; L‐G‐Bg, low‐altitude B. gargarizans gut samples; L‐Soil, low‐altitude soil samples; L‐Water, low‐altitude water samples
Figure 5
Figure 5
Putative oxygen‐related functions enriched in symbiotic microbiomes. H‐, high altitude; L‐, low altitude. Black lines represent quartiles. The statistical test is based on nonparametric differentiation tests (Mann–Whitney U test). *p < .05, **p < .01; ***p < .001. Each spot represents one sample. (a) For Bufo gargarizans; (b) for amphibians including all species in this study
Figure 6
Figure 6
The correlation between symbiotic microbiome in amphibians and the surrounding environmental microbiome. Source‐tracking analysis of skin microbes b, d), gut microorganisms (a, c), and the environmental microbiome in Bufo gargarizans and amphibians (including all species in this study) living at high and low elevations. The value on the x‐axis is the predicted proportion of the source microbiomes in the sink samples. H‐S, high‐altitude soil; H‐W, high‐altitude water; L‐S, low‐altitude soil; L‐W, low‐altitude water. Unknown (unknown source): the portion of a sink sample that is unlikely to be assigned to any of the known sources in this study may come from other unknown sources (Knights et al., 2011); H‐Bg: B. gargarizans at high altitude; L‐Bg: B. gargarizans at low altitude. The value on the y‐axis represents the relative abundance of the samples. Each graph represents a microbial sample, and the height of the color histogram represents the proportion of each source in the samples
Figure A1
Figure A1
Symbiotic microbiome of amphibians living at different altitudes. Histogram of skin obtained from different phyla, families, and genera of amphibians living at high or low altitudes (a, b, c); histogram of intestinal flora at the phylum, family, and genus level of amphibians living at high or low altitudes (d, e, f)
Figure A2
Figure A2
Linear discriminant analysis effect size (LEfSe) analysis of skin microbiome in amphibians living at high and low altitudes. Histogram of the LDA scores computed for differentially abundant features between low‐altitude and high‐altitude gut microbes. H‐, high altitude; L‐, low altitude. From the outside to the inside, the red‐ and green‐colored nodes represent bacteria of the phylum, class, order, family, genus, and species, which display significant differences. The yellow‐colored nodes represent the bacteria displaying no significant difference
Figure A3
Figure A3
Linear discriminant analysis effect size (LEfSe) analysis of intestinal microbiome in amphibians living at high and low altitudes. Histogram of the LDA scores computed for differentially abundant features between low‐altitude and high‐altitude gut microbes. H‐, high altitude; L‐, low altitude. From the outside to the inside, the red‐ and green‐colored nodes represent bacteria of the phylum, class, order, family, genus, and species, which display significant differences. The yellow‐colored nodes represent the bacteria displaying no significant difference
Figure A4
Figure A4
Composition of microbiome at phylum level in environmental samples at high and low altitudes. L‐W: low‐altitude water samples; L‐S: low‐altitude soil samples; H‐W: high‐altitude water samples; H‐S: high‐altitude soil samples
Figure A5
Figure A5
Bray–Curtis distances of skin and intestinal microbiome based on different species at high and low elevations: H‐G‐Ak, H‐S‐Ak, H‐G‐Bg, H‐S‐Bg, H‐G‐Bt, H‐S‐Bt, H‐G‐Np, H‐S‐Np, H‐G‐Sg, H‐S‐Sg, L‐G‐Bg, L‐S‐Bg, L‐G‐Fl, L‐S‐Fl, L‐G‐Mf, L‐S‐Mf, L‐G‐Ro, L‐S‐Ro, L‐G‐Pn, L‐S‐Pn, respectively (H‐, represents high altitude; L‐, represents low altitude; G‐, represents gut microbes; S‐, represents skin microbes; Ak, represents Amolops kangtingensi; Bg, represents Bufo gargarizans; Bt, represents Batrachuperus tibetanus; Np, represents Nanorana parkeri; Sg, represents Scutiger glandulatus; Fl, represents Fejervarya limnocharis; Mf, represents Microhyla fissipes; Ro, represents Rana omeimontis; Pn, represents Pelophylax nigromaculatus)
Figure A6
Figure A6
The dissimilarities (unweighted_unifrac distance) among the symbiotic microbiome of Bufo gargarizans (a) and all species (c) living at different altitudes were quantified using nonmetric multidimensional scaling (NMDS). The summarized dissimilarity within the same type of symbiotic microbiome for Bufo gargarizans (b) and all species (d). H‐G, high‐altitude gut samples; H‐S, high‐altitude skin samples; H‐S‐Bg, high‐altitude Bufo gargarizans skin samples; H‐G‐Bg, high‐altitude Bufo gargarizans gut samples. H‐Soil, high‐altitude soil samples; H‐Water, high‐altitude water samples; L‐G, low‐altitude gut samples; L‐S, low‐altitude skin samples; L‐S‐Bg, low‐altitude Bufo gargarizans skin samples; L‐G‐Bg, low‐altitude Bufo gargarizans gut samples; L‐Soil, low‐altitude soil samples; L‐Water, low‐altitude water samples
Figure A7
Figure A7
The dissimilarities (weighted_unifrac distance) among the symbiotic microbiome of Bufo gargarizans (a) and all species (c) living at different altitudes were quantified using nonmetric multidimensional scaling (NMDS). The summarized dissimilarity within the same type of symbiotic microbiome for Bufo gargarizans (b) and all species (d). H‐G, high‐altitude gut samples; H‐S, high‐altitude skin samples; H‐S‐Bg, high‐altitude Bufo gargarizans skin samples; H‐G‐Bg, high‐altitude Bufo gargarizans gut samples. H‐Soil, high‐altitude soil samples; H‐Water, high‐altitude water samples; L‐G, low‐altitude gut samples; L‐S, low‐altitude skin samples; L‐S‐Bg, low‐altitude Bufo gargarizans skin samples; L‐G‐Bg, low‐altitude Bufo gargarizans gut samples; L‐Soil, low‐altitude soil samples; L‐Water, low‐altitude water samples
Figure A8
Figure A8
The dissimilarities on bray_curtis distance (a), unweighted _unifrac distance (b), and weighted_unifrac distance (c) among the gut microbiome of Bufo gargarizans and other species living at different altitudes were quantified using nonmetric multidimensional scaling (NMDS). H‐G‐Ak, H‐S‐Ak, H‐G‐Bg, H‐S‐Bg, H‐G‐Bt, H‐S‐Bt, H‐G‐Np, H‐S‐Np, H‐G‐Sg, H‐S‐Sg, L‐G‐Bg, L‐S‐Bg, L‐G‐Fl, L‐S‐Fl, L‐G‐Mf, L‐S‐Mf, L‐G‐Ro, L‐S‐Ro, L‐G‐Pn, L‐S‐Pn, respectively (H‐, represents high altitude; L‐, represents low altitude; G‐, represents gut microbes; S‐, represents skin microbes; Ak, represents Amolops kangtingensi; Bg, represents Bufo gargarizans; Bt, represents Batrachuperus tibetanus; Np, represents Nanorana parkeri; Sg, represents Scutiger glandulatus; Fl, represents Fejervarya limnocharis; Mf, represents Microhyla fissipes; Ro, represents Rana omeimontis; Pn, represents Pelophylax nigromaculatus)
Figure A9
Figure A9
The dissimilarities on bray_curtis distance (a), unweighted _unifrac distance (b), and weighted_unifrac distance (c) among the skin microbiome of Bufo gargarizans and other species living at different altitudes were quantified using nonmetric multidimensional scaling (NMDS). H‐G‐Ak, H‐S‐Ak, H‐G‐Bg, H‐S‐Bg, H‐G‐Bt, H‐S‐Bt, H‐G‐Np, H‐S‐Np, H‐G‐Sg, H‐S‐Sg, L‐G‐Bg, L‐S‐Bg, L‐G‐Fl, L‐S‐Fl, L‐G‐Mf, L‐S‐Mf, L‐G‐Ro, L‐S‐Ro, L‐G‐Pn, L‐S‐Pn, respectively (H‐, represents high altitude; L‐, represents low altitude; G‐, represents gut microbes; S‐, represents skin microbes; Ak, represents Amolops kangtingensi; Bg, represents Bufo gargarizans; Bt, represents Batrachuperus tibetanus; Np, represents Nanorana parkeri; Sg, represents Scutiger glandulatus; Fl, represents Fejervarya limnocharis; Mf, represents Microhyla fissipes; Ro, represents Rana omeimontis; Pn, represents Pelophylax nigromaculatus)

Similar articles

Cited by

References

    1. Anderson, M. J. (2010). A new method for non‐parametric multivariate analysis of variance. Austral Ecology, 26, 32–46.
    1. Caporaso, J. G. , Kuczynsk, J. , Stombaugh, J. , Bittinger, K. , Bushman, F. D. , Costello, E. K. , … Knight, R. (2010). QIIME allows integration and analysis of high‐throughput community sequencing data. Nature Methods, 7, 335–336. - PMC - PubMed
    1. Caporaso, J. G. , Lauber, C. L. , Walters, W. A. , Berg‐Lyons, D. , Huntley, J. , Fierer, N. , … Knight, R. (2012). Ultra‐high‐throughput microbial community analysis on the Illumina HiSeq and MiSeq platforms. The ISME Journal: Multidisciplinary Journal of Microbial Ecology, 6, 1621–1624. 10.1038/ismej.2012.8 - DOI - PMC - PubMed
    1. César, F. N. E. , Fany, R. , Lucía, F. , & Robert, E. H. (2013). Bacterial biofilm development as a multicellular adaptation: Antibiotic resistance and new therapeutic strategies. Current Opinion in Microbiology, 16, 580–589. 10.1016/j.mib.2013.06.013 - DOI - PubMed
    1. Chang, C. W. , Huang, B. H. , Lin, S. M. , Huang, C. L. , & Liao, P. C. (2016). Changes of diet and dominant intestinal microbes in farmland frogs. BMC Microbiology, 16, 1–13. 10.1186/s12866-016-0660-4 - DOI - PMC - PubMed

Publication types

Substances

LinkOut - more resources