

Transcriptomic and Metabolomic Changes Triggered by Fusarium solani in Common Bean (Phaseolus vulgaris L.)
- PMID: 32046085
- PMCID: PMC7073522
- DOI: 10.3390/genes11020177
Transcriptomic and Metabolomic Changes Triggered by Fusarium solani in Common Bean (Phaseolus vulgaris L.)
Abstract
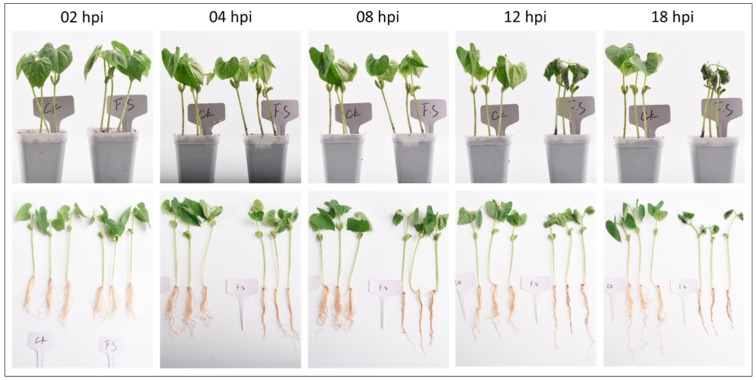
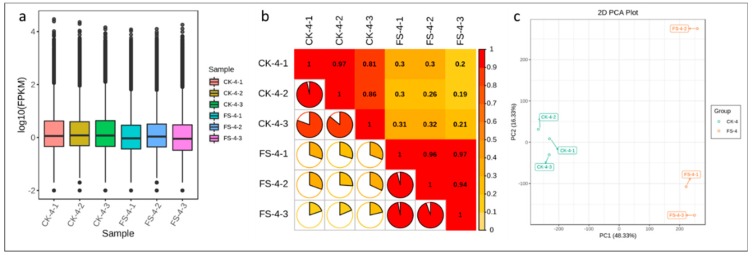
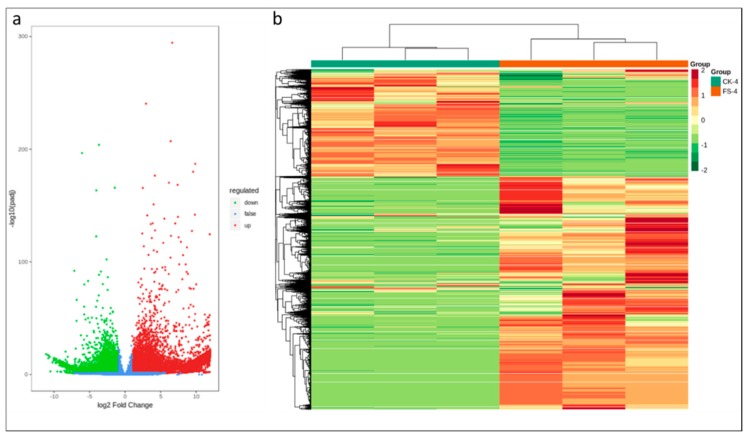
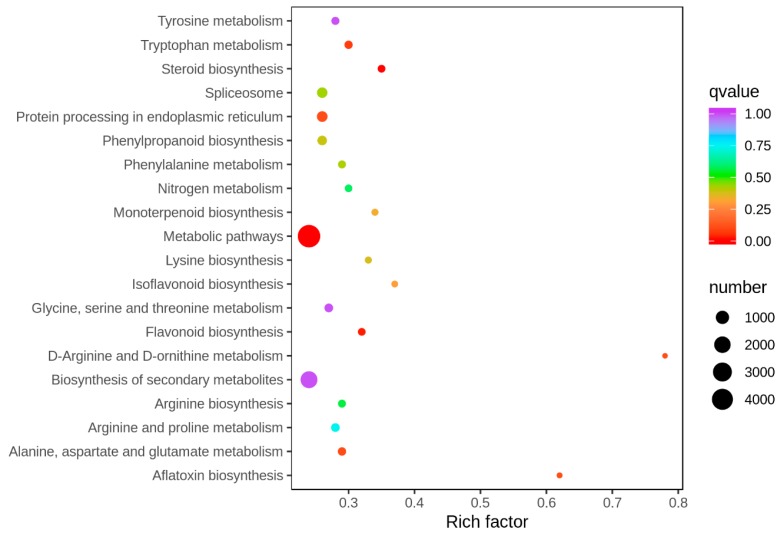
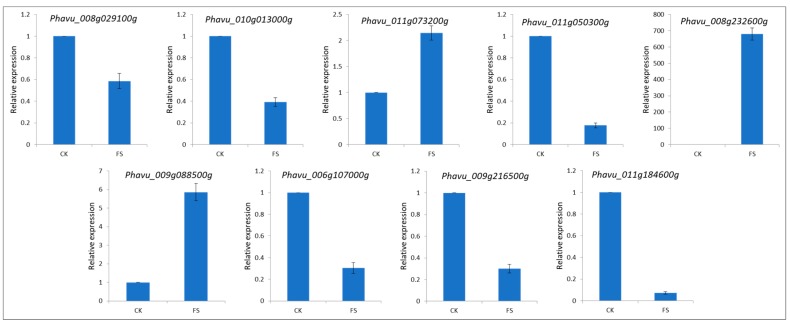
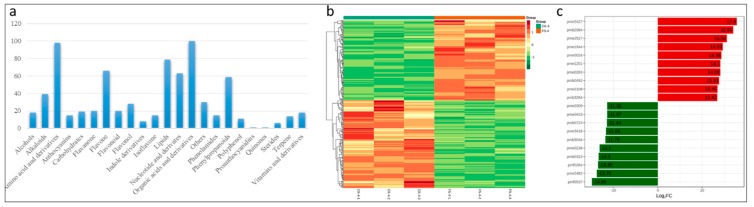
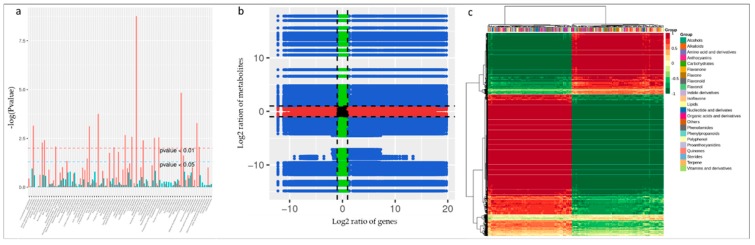
Common bean (Phaseolus vulgaris L.) is a major legume and is frequently attacked by fungal pathogens, including Fusarium solani f. sp. phaseoli (FSP), which cause Fusarium root rot. FSP substantially reduces common bean yields across the world, including China, but little is known about how common bean plants defend themselves against this fungal pathogen. In the current study, we combined next-generation RNA sequencing and metabolomics techniques to investigate the changes in gene expression and metabolomic processes in common bean infected with FSP. There were 29,722 differentially regulated genes and 300 differentially regulated metabolites between control and infected plants. The combined omics approach revealed that FSP is perceived by PAMP-triggered immunity and effector-triggered immunity. Infected seedlings showed that common bean responded by cell wall modification, ROS generation, and a synergistic hormone-driven defense response. Further analysis showed that FSP induced energy metabolism, nitrogen mobilization, accumulation of sugars, and arginine and proline metabolism. Importantly, metabolic pathways were most significantly enriched, which resulted in increased levels of metabolites that were involved in the plant defense response. A correspondence between the transcript pattern and metabolite profile was observed in the discussed pathways. The combined omics approach enhances our understanding of the less explored pathosystem and will provide clues for the development of common bean cultivars' resistant to FSP.
Keywords: Fusarium sp; common bean; fungus–plant interactions; induced response; metabolome; transcriptome.
Conflict of interest statement
The authors declare no conflict of interest.
Figures
Similar articles
-
Combined De Novo Transcriptome and Metabolome Analysis of Common Bean Response to Fusarium oxysporum f. sp. phaseoli Infection.Int J Mol Sci. 2019 Dec 12;20(24):6278. doi: 10.3390/ijms20246278. Int J Mol Sci. 2019. PMID: 31842411 Free PMC article.
-
Differentially Expressed Genes in Resistant and Susceptible Common Bean (Phaseolus vulgaris L.) Genotypes in Response to Fusarium oxysporum f. sp. phaseoli.PLoS One. 2015 Jun 1;10(6):e0127698. doi: 10.1371/journal.pone.0127698. eCollection 2015. PLoS One. 2015. PMID: 26030070 Free PMC article.
-
Exploring associations between metabolites and gene transcripts of common bean (Phaseolus vulgaris L.) in response to rust (Uromyces appendiculatus) infection.BMC Plant Biol. 2025 May 1;25(1):568. doi: 10.1186/s12870-025-06584-w. BMC Plant Biol. 2025. PMID: 40307747 Free PMC article.
-
A methyl esterase 1 (PvMES1) promotes the salicylic acid pathway and enhances Fusarium wilt resistance in common beans.Theor Appl Genet. 2021 Aug;134(8):2379-2398. doi: 10.1007/s00122-021-03830-1. Epub 2021 Jun 14. Theor Appl Genet. 2021. PMID: 34128089
-
Metabolomics as an Emerging Tool for the Study of Plant-Pathogen Interactions.Metabolites. 2020 Jan 29;10(2):52. doi: 10.3390/metabo10020052. Metabolites. 2020. PMID: 32013104 Free PMC article. Review.
Cited by
-
Transcriptome and Metabolome Analysis of the Synthesis Pathways of Allelochemicals in Eupatorium adenophorum.ACS Omega. 2022 May 4;7(19):16803-16816. doi: 10.1021/acsomega.2c01816. eCollection 2022 May 17. ACS Omega. 2022. PMID: 35601343 Free PMC article.
-
Genetic Improvement of Cereals and Grain Legumes.Genes (Basel). 2020 Oct 25;11(11):1255. doi: 10.3390/genes11111255. Genes (Basel). 2020. PMID: 33113769 Free PMC article.
-
Faba Bean (Vicia faba L. minor) Bitterness: An Untargeted Metabolomic Approach to Highlight the Impact of the Non-Volatile Fraction.Metabolites. 2023 Aug 21;13(8):964. doi: 10.3390/metabo13080964. Metabolites. 2023. PMID: 37623907 Free PMC article.
-
Integrated analysis of transcriptome, metabolome, and histochemistry reveals the response mechanisms of different ages Panax notoginseng to root-knot nematode infection.Front Plant Sci. 2023 Sep 14;14:1258316. doi: 10.3389/fpls.2023.1258316. eCollection 2023. Front Plant Sci. 2023. PMID: 37780502 Free PMC article.
-
Integrating multi-omics and machine learning for disease resistance prediction in legumes.Theor Appl Genet. 2025 Jun 27;138(7):163. doi: 10.1007/s00122-025-04948-2. Theor Appl Genet. 2025. PMID: 40579624 Free PMC article. Review.
References
-
- Li L., Yang T., Liu R., Redden B., Maalouf F., Zong X. Food legume production in China. Crop J. 2017;5:115–126. doi: 10.1016/j.cj.2016.06.001. - DOI
-
- Ongom P., Rubaihayo P., Nkalubo S., Gibson P. Inheritance of resistance to Fusarium root rot in three common bean genotypes. Electron. J. Plant Breed. 2012;3:892–897.
-
- Wang W., Jacobs J.L., Chilvers M.I., Mukankusi C.M., Kelly J.D., Cichy K.A. QTL analysis of Fusarium root rot resistance in an Andean× middle American common bean RIL population. Crop Sci. 2018;58:1166–1180. doi: 10.2135/cropsci2017.10.0608. - DOI
-
- Mukankusi C., Derera J., Melis R., Gibson P.T., Buruchara R. Genetic analysis of resistance to Fusarium root rot in common bean. Euphytica. 2011;182:11. doi: 10.1007/s10681-011-0413-2. - DOI
Publication types
MeSH terms
Substances
LinkOut - more resources
Full Text Sources
