. 2020 Feb 7;9(2):384.
doi: 10.3390/cells9020384.

WNT5a-ROR Signaling Is Essential for Alveologenesis

Affiliations

WNT5a-ROR Signaling Is Essential for Alveologenesis

Changgong Li et al. Cells. .

Abstract

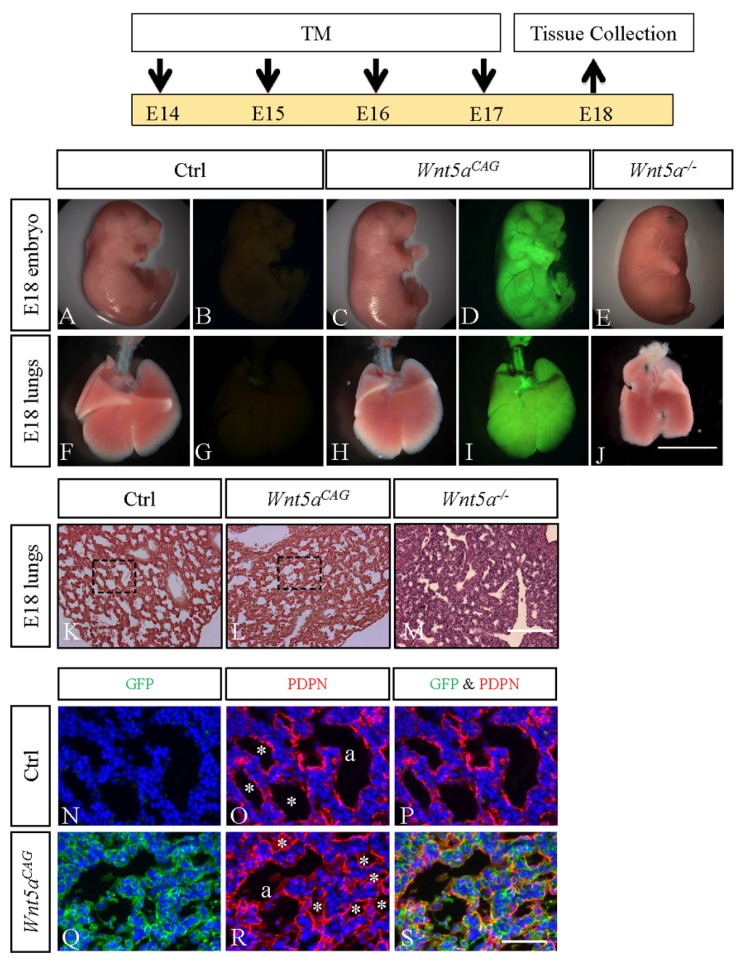
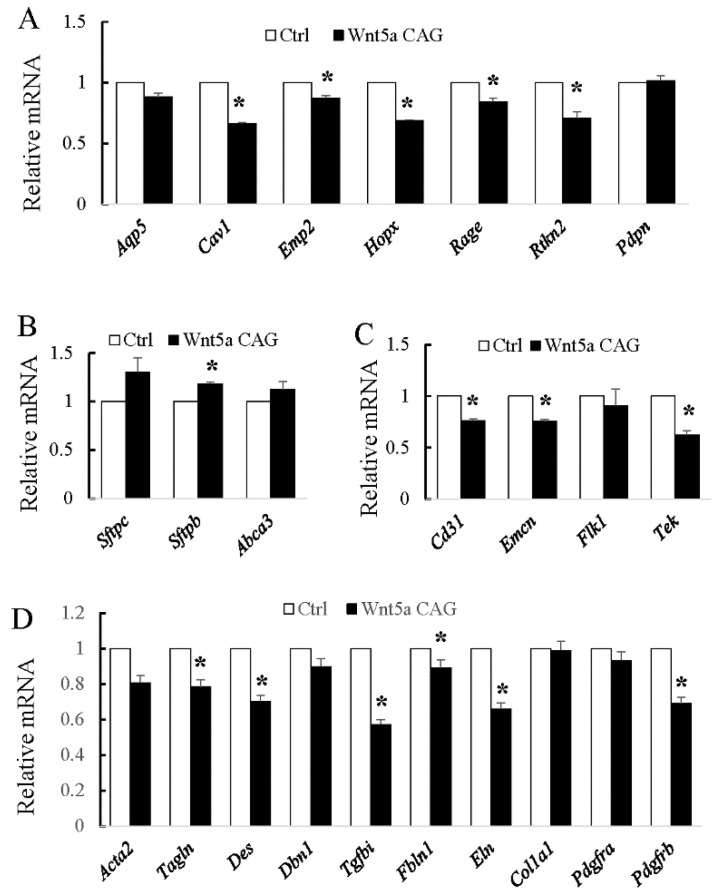
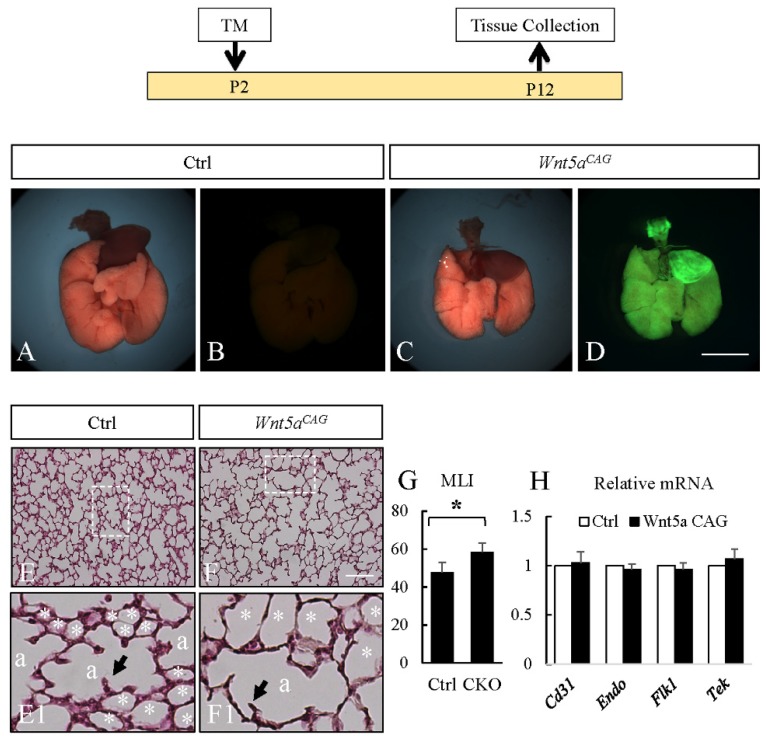
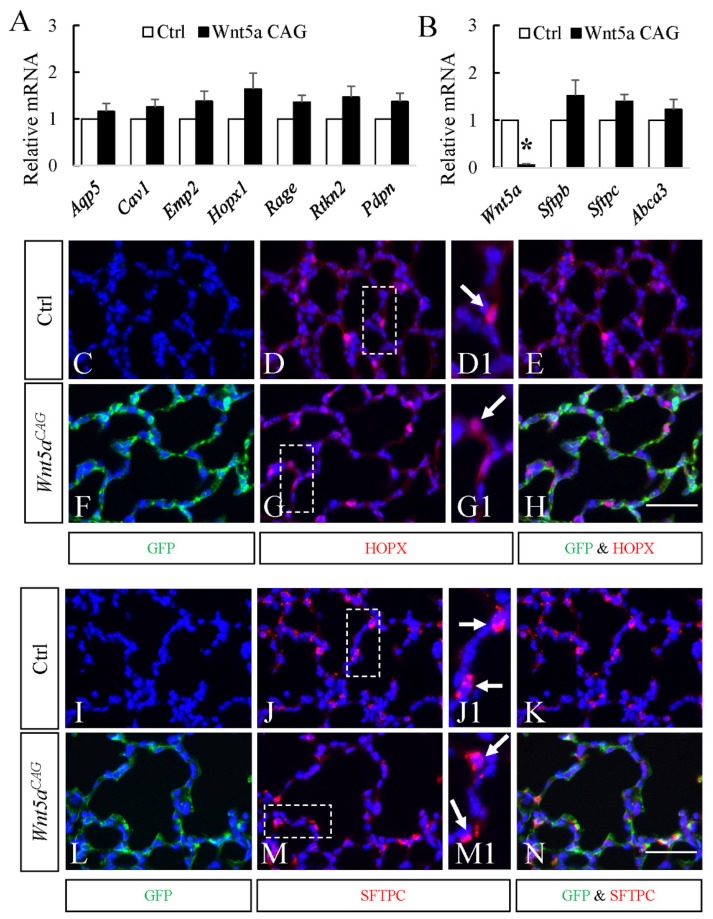
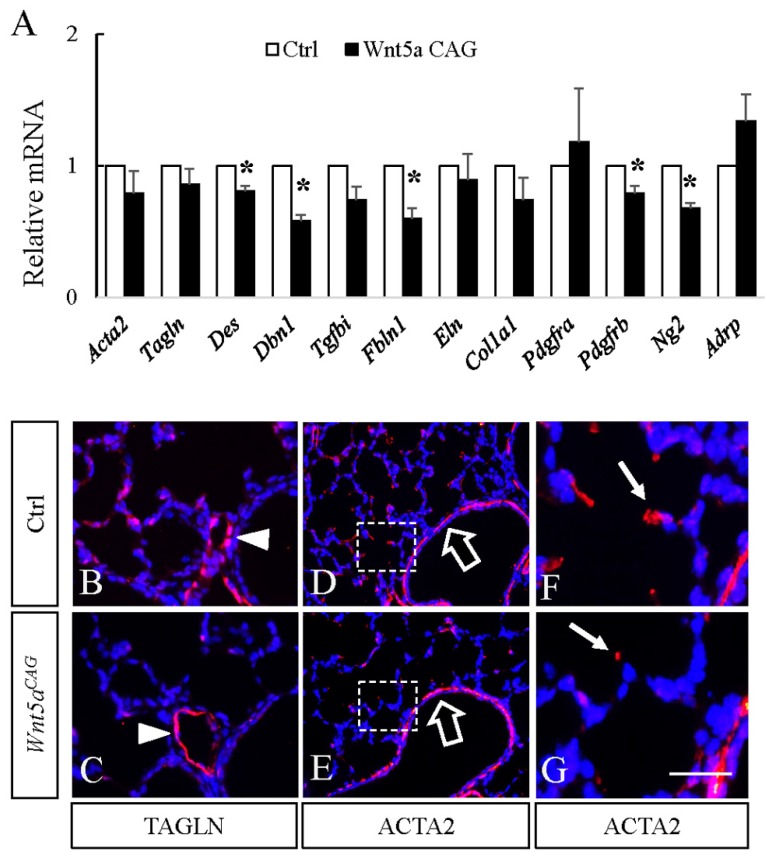
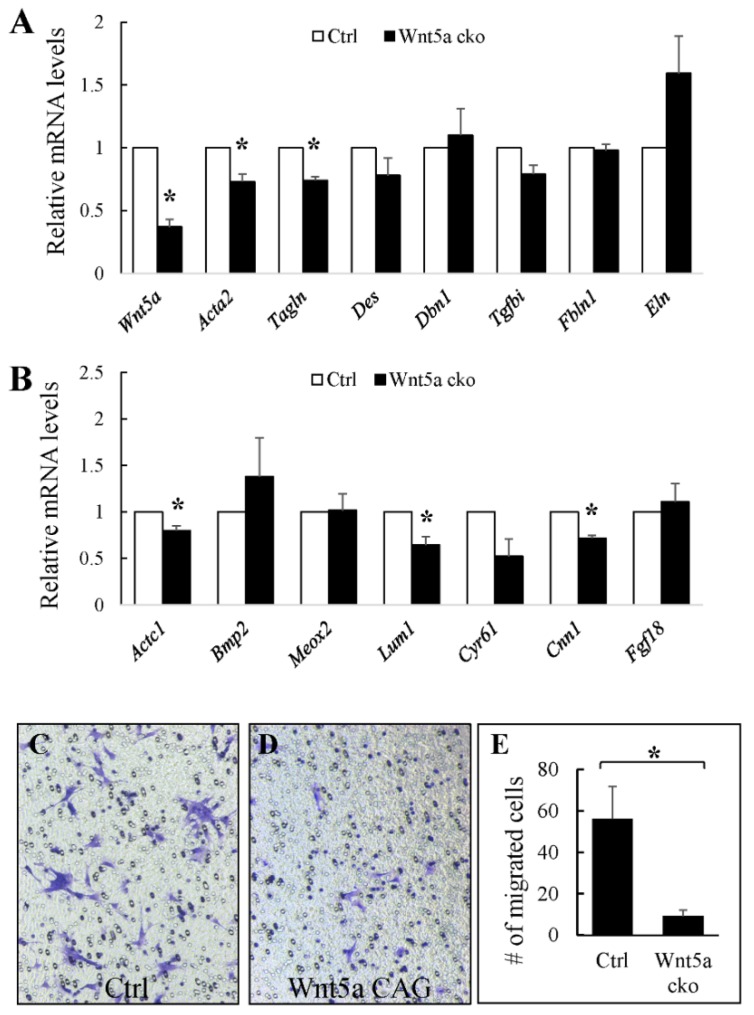
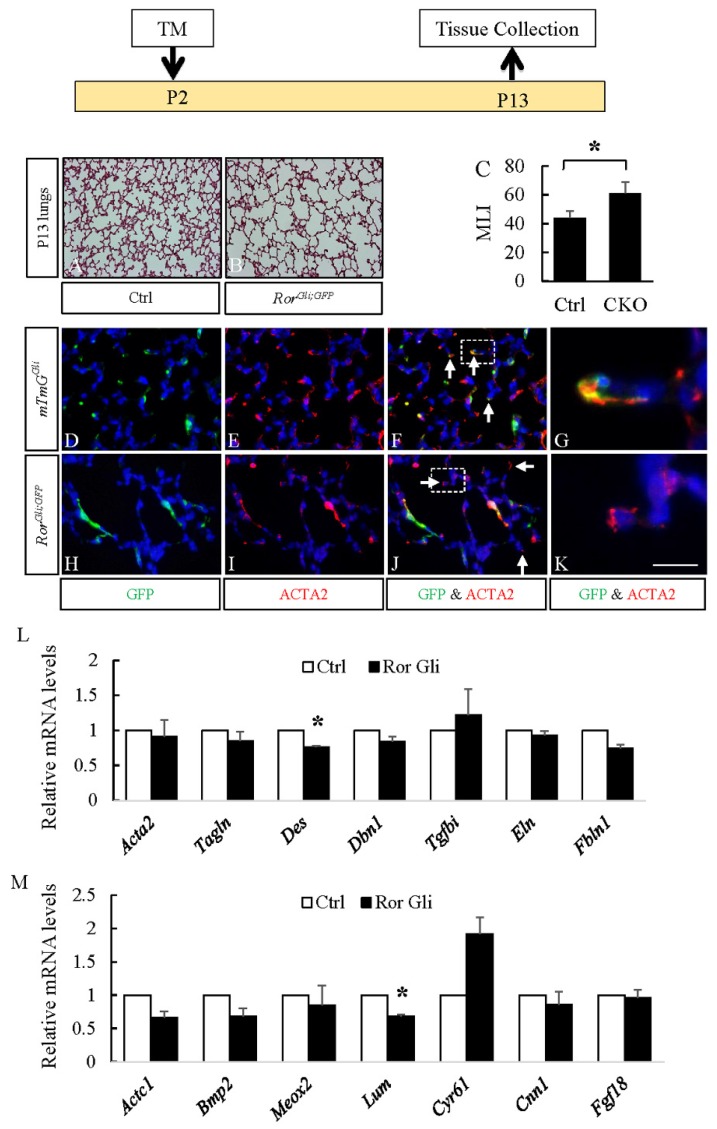
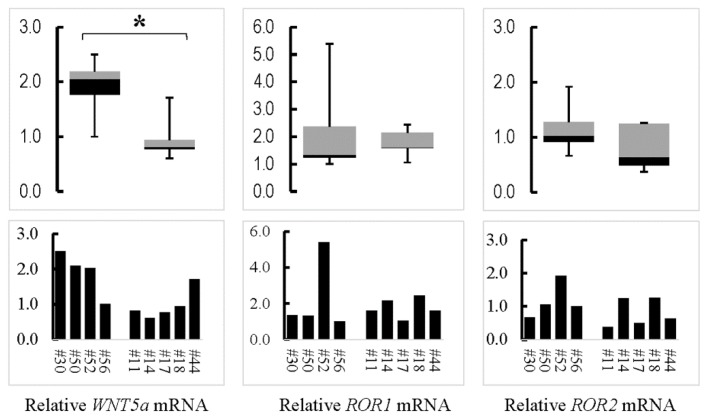
WNT5a is a mainly "non-canonical" WNT ligand whose dysregulation is observed in lung diseases such as idiopathic pulmonary fibrosis (IPF), chronic obstructive pulmonary disease (COPD) and asthma. Germline deletion of Wnt5a disrupts embryonic lung development. However, the temporal-specific function of WNT5a remains unknown. In this study, we generated a conditional loss-of-function mouse model (Wnt5aCAG) and examined the specific role of Wnt5a during the saccular and alveolar phases of lung development. The lack of Wnt5a in the saccular phase blocked distal airway expansion and attenuated differentiation of endothelial and alveolar epithelial type I (AT1) cells and myofibroblasts. Postnatal Wnt5a inactivation disrupted alveologenesis, producing a phenotype resembling human bronchopulmonary dysplasia (BPD). Mutant lungs showed hypoalveolization, but endothelial and epithelial differentiation was unaffected. The major impact of Wnt5a inactivation on alveologenesis was on myofibroblast differentiation and migration, with reduced expression of key regulatory genes. These findings were validated in vitro using isolated lung fibroblasts. Conditional inactivation of the WNT5a receptors Ror1 and Ror2 in alveolar myofibroblasts recapitulated the Wnt5aCAG phenotype, demonstrating that myofibroblast defects are the major cause of arrested alveologenesis in Wnt5aCAG lungs. Finally, we show that WNT5a is reduced in human BPD lung samples, indicating the clinical relevance and potential role for WNT5a in pathogenesis of BPD.

Keywords: ROR; WNT5a; alveologenesis; lung; migration; secondary crest myofibroblast.


Conflict of interest statement

The authors declare no competing or financial interests.

Figures

Figure 1
Figure 1
Wnt5a inactivation attenuated saccular stage lung development. Top: Schematic of the experimental plan. AE: Gross morphology of E18 control (A and B), Wnt5aCAG (C and D) and Wnt5a-/- (E) embryos. Panels A, C and E show the bright-field images. Panels B and D show the green fluorescent images of control and Wnt5aCAG embryos, respectively. FJ: Gross morphology of E18 control (F and G), Wnt5aCAG (H and I) and Wnt5a-/- (J) lungs. Panels F, H and J show the bright-field images. Panels G and I show the green fluorescent images of control and Wnt5aCAG lungs, respectively. Scale bars (J): 10 mm for AE, 4 mm for FJ. KM: H&E staining of E18 control (K), Wnt5aCAG (L) and Wnt5a-/- (M) lungs. Scale bar (M): 200 μm for K–M. NS: Immunostaining of GFP (green) and PDPN (red) in E18 control (NP) and Wnt5aCAG (QS) lungs. Panels NP and QS correlate to the boxed areas in Panels K and L, respectively. Asterisk indicates saccules. “a” indicates the junction between bronchiole and saccules. Scale bars (S): 50 μm for NS.
Figure 2
Figure 2
Wnt5a inactivation attenuates differentiation of AT1 and endothelial cells and myofibroblasts during the saccular stage of lung development. AD: Relative mRNA for AT1 (A), AT2 (B), endothelial (C) and myofibroblast (D) markers in E18 Wnt5aCAG lungs (Wnt5a CAG) compared to control lungs by real-time RT-PCR analysis. Data represent the mean ± standard error of the mean (SEM). * indicates p < 0.05. n = 3.
Figure 3
Figure 3
Postnatal inactivation of Wnt5a attenuates alveologenesis. Top: Schematic of the experimental plan. AD: Gross morphology of P12 control (AB) and Wnt5aCAG (CD) lungs. Panels A and C show bright-field images. Panels B and D show green fluorescent images of control and Wnt5aCAG embryos, respectively. Scale bars (D): 4 mm for AD. EF: H&E staining of P12 control (E) and Wnt5aCAG (F) lungs. E1 and F1 show higher magnification views of boxed areas (rotated 90 degree clockwise in E1) in E and F, respectively. Please note that distal alveolar units (*) surrounding the dividing alveolar space (a) are profoundly enlarged in the mutant lungs. Arrows indicate 2nd crests. Scale bars (F): 100 μm for E and F; 25 μm for E1 and F1. G: Mean linear intercept (MLI) of control and Wnt5aCAG lungs (CKO). H: Relative mRNA for endothelial markers in Wnt5aCAG lungs (Wnt5a CAG, P12-13) compared to the littermate control lungs by real-time RT-PCR analysis. Data represent the mean ± SEM. * indicates p < 0.05. n = 4.
Figure 4
Figure 4
No significant changes in AT1 and AT2 cell markers in P12 Wnt5aCAG lungs. AB: Relative mRNA for AT1(A) and AT2 (B) cell markers in Wnt5aCAG lungs (Wnt5a CAG, P12-13) compared to littermate control lungs by real-time RT-PCR analysis. CH: Immunostaining of GFP (green) and HOPX (red) in P12 control (C, D, D1 and E) and Wnt5aCAG (F, G, G1 and H) lungs. D1 and G1 show higher magnification views of boxed areas in D and G, respectively. Arrows indicate HOPX-positive cells. Scale bar (H): 50 μm for C, D, E, F, G and H; 25 μm for D1 and G1. IN: Immunostaining of GFP (green) and SFTPC (red) in P12 control (I, J, J1 and K) and Wnt5aCAG (L, M, M1 and N) lungs. J1 and M1 show higher magnification views of boxed areas (rotated 90 degree clockwise in M1) in J and M, respectively. Arrows indicate SFTPC-positive cells. Scale bar (N): 50 μm for I, J, K, L, M and N; 25 μm for J1 and M1. Data represent the mean ± SEM. * indicates p < 0.05. n = 4.
Figure 5
Figure 5
Postnatal inactivation of Wnt5a decreases expression of genes enriched in myofibroblasts. A: Relative mRNA for genes enriched in myofibroblasts in Wnt5aCAG lungs (Wnt5a CAG, P12-13) compared to the littermate control lungs by real-time RT-PCR analysis. Data represent the mean ± SEM. * indicates p < 0.05. n = 4. BG: Immunostaining of TAGLN (B and C) and ACTA2 (DG) in P12 control (B, D and F) and Wnt5aCAG (C, E and G) lungs. Panels F and G show higher magnification views of boxed areas in D and E, respectively. Nuclei are counterstained with DAPI. Arrowheads in B and C indicate TAGLN-positive perivascular smooth muscle cells. Block arrows in D and E indicate ACTA2 positive parabronchial smooth muscle cells. Arrows in F and G indicate ACTA2 positive alveolar myofibroblast cells. Scale bars (G): 50 μm for B and C, 100 μm for D and E, 25 μm for F and G.
Figure 6
Figure 6
Inactivation of Wnt5a in vitro disrupts differentiation and migration of cultured fibroblasts. Fibroblasts from P5 neonatal lungs were isolated, cultured and treated with tamoxifen (1.5 μg/mL) for 24 h before RNA isolation. A: Relative mRNA for myofibroblasts-enriched genes in Wnt5aCAG fibroblasts compared to control lung fibroblasts determined by real-time RT-PCR analysis. B: Relative mRNA of cell migration genes in Wnt5aCAG fibroblasts compared to control lung fibroblasts determined by real-time RT-PCR analysis. Data represent the mean ± SEM. * indicates p < 0.05. n = 4. CD: Transwell migration assay. Control (C) and Wnt5aCAG (D) fibroblasts treated with tamoxifen (1.5 μg/mL, 24 h) were plated on 12-micron Transwell membranes and cultured for 24 h. Cells migrated to the lower side of the Transwell were stained with crystal violet and counted. E: Quantification of the number of cells that migrated to the lower side in unit area. Four areas from each experiment (each Transwell) were imaged, counted and the means calculated. Date represent the mean of three independent experiments ± SEM. * indicates p < 0.05.
Figure 7
Figure 7
Postnatal inactivation of Ror1 and Ror2 attenuated alveologenesis. Top: Schematic of the experimental plan. AB: H&E staining of P13 control (A) and RorGli;GFP (B) lungs. C: Mean linear intercept (MLI) of P13 control and RorGli;GFP (CKO) lungs. DK: Immunostaining of GFP (green) and ACTA2 (red) in P13 mTmGGli (DG, control) and RorGli;GFP (HK) lungs. Panels G and K show higher magnification views of boxed areas in F and J, respectively. Nuclei are counterstained with DAPI. Scale bars (K): 200 μm for A and B, 50 μm for DF and HJ, 11 μm for G and K. LM: Relative mRNA for myofibroblast enriched genes and cell migration genes in P13 RorGli;GFP (Ror Gli) lungs compared to control lungs by real-time RT-PCR analysis. Data represent the mean ± SEM. * indicates p < 0.05. n = 3.
Figure 8
Figure 8
Expression of WNT5a, ROR1 and ROR2 in human bronchopulmonary dysplasia (BPD) lungs. Human lung samples from deceased donors were collected and processed at the University of Rochester following the protocol approved by University of Rochester Institutional Review Board. Relative mRNA for the examined genes is presented in a 2-D column chart with levels of #56 arbitrarily set as “1”. Data distribution of the non-BPD (#30, #50, #52, #56) and the BPD (#11, #14, #17, #18, #44) samples is shown by the boxplot. * indicates p < 0.05.
Figure 9
Figure 9
A simplified model indicating the role of WNT5a in AT1 and AT2 cell differentiation. During the saccular stage, WNT5a activity is required for differentiation of AT1 cells from NKX2.1posHOPXpos AT1 progenitors. During alveologenesis, WNT5a activity does not appear to be required for AT1 and AT2 cell differentiation. AEP: alveolar epithelial progenitors.

References

    1. Shi W., Bellusci S., Warburton D. Lung Development and Adult Lung Diseases. Chest. 2007;132:651–656. doi: 10.1378/chest.06-2663. - DOI - PubMed
    1. Frank D.B., Penkala I.J., Zepp J.A., Sivakumar A., Linares-Saldana R., Zacharias W.J., Stolz K.G., Pankin J., Lu M., Wang Q., et al. Early lineage specification defines alveolar epithelial ontogeny in the murine lung. Proc. Natl. Acad. Sci. 2019;116:4362–4371. doi: 10.1073/pnas.1813952116. - DOI - PMC - PubMed
    1. Branchfield K., Li R., Lungova V., Verheyden J.M., McCulley D., Sun X. A three-dimensional study of alveologenesis in mouse lung. Dev. Biol. 2016;409:429–441. doi: 10.1016/j.ydbio.2015.11.017. - DOI - PMC - PubMed
    1. Boström H., Willetts K., Pekny M., Levéen P., Lindahl P., Hedstrand H., Pekna M., Hellström M., Gebre-Medhin S., Schalling M., et al. PDGF-A Signaling Is a Critical Event in Lung Alveolar Myofibroblast Development and Alveogenesis. Cell. 1996;85:863–873. doi: 10.1016/S0092-8674(00)81270-2. - DOI - PubMed
    1. Lindahl P., Karlsson L., Hellström M., Gebre-Medhin S., Willetts K., Heath J.K., Betsholtz C. Alveogenesis failure in PDGF-A-deficient mice is coupled to lack of distal spreading of alveolar smooth muscle cell progenitors during lung development. Development. 1997;124:3943–3953. - PubMed

Publication types