. 2020 Feb 7;12(2):384.
doi: 10.3390/cancers12020384.

Role of Polymer Micelles in the Delivery of Photodynamic Therapy Agent to Liposomes and Cells

Affiliations

Role of Polymer Micelles in the Delivery of Photodynamic Therapy Agent to Liposomes and Cells

Laure Gibot et al. Cancers (Basel). .

Abstract

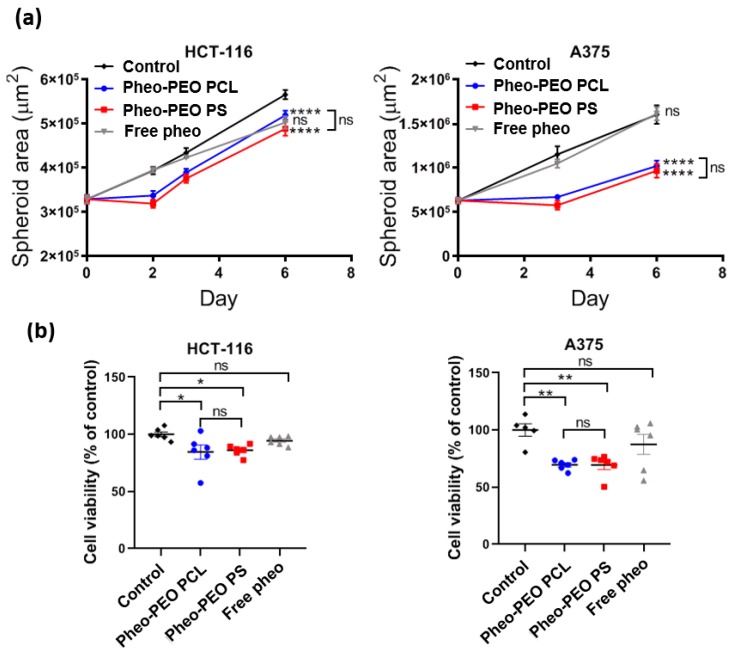
The use of nanocarriers for hydrophobic photosensitizers, in the context of photodynamic therapy (PDT) to improve pharmacokinetics and bio-distribution, is well-established. However, the mechanisms at play in the internalization of nanocarriers are not well-elucidated, despite its importance in nanocarrier design. In this study, we focus on the mechanisms involved in copolymer poly(ethylene oxide)-block-poly(-caprolactone) PEO-PCL and poly(ethylene oxide)-block-poly styrene PEO-PS micelles - membrane interactions through complementary physico-chemical studies on biomimetic membranes, and biological experiments on two-dimensional (2D) and three-dimensional (3D) cell cultures. Förster Resonance Energy Transfer measurements on fluorescently-labelled lipid vesicles, and flow cytometry on two cancerous cell lines enabled the evaluation in the uptake of a photosensitizer, Pheophorbide a (Pheo), and copolymer chains towards model membranes, and cells, respectively. The effects of calibrated light illumination for PDT treatment on lipid vesicle membranes, i.e., leakage and formation of oxidized lipids, and cell viability, were assessed. No significant differences were observed between the ability of PEO-PCL and PEO-PS micelles in delivering Pheo to model membranes, but Pheo was found in higher concentrations in cells in the case of PEO-PCL. These higher Pheo concentrations did not correspond to better performances in PDT treatment. We demonstrated that there are subtle differences in PEO-PCL and PEO-PS micelles for the delivery of Pheo.

Keywords: PEO-PCL; PEO-PS; Photodynamic therapy; Polymer; Self-assembly; model membranes.


Conflict of interest statement

The authors declare no conflict of interest. The funders had no role in the design of the study; in the collection, analyses, or interpretation of data; in the writing of the manuscript, or in the decision to publish the results.

Figures

Figure A1
Figure A1
Morphological aspect of 2D monolayers and 3D tumor spheroids produced with human colorectal HCT-116 and human melanoma A375 cell lines.
Figure 1
Figure 1
The transfer of Pheophorbide from PEO-PCL and PEO-PS micelles to Large Unilamellar Vesicles LUVs. (a) Determination of Pheo association constant, Kas, for the polymer micelles assessed by fluorescence experiments. Statistical analysis by t-test, *** = p < 0.001 (b). The transfer of Pheo from PBS solution (free Pheo) and Pheo loaded copolymer micelles to liposomes assessed by Förster Resonance Energy Transfer. Ktr is the constant of Pheo transfer in the different conditions. Statistical analysis by One-way Anova followed by Tukey’s multiple comparisons test. ns = non-significant; Data are represented as the mean value ± SEM.
Figure 2
Figure 2
Pheophorbide fluorescence in human tumor cells exposed to Pheo loaded PEO-PCL and PEO-PS micelles. (a) Quantification by flow cytometry of Pheo fluorescence in HCT-116 when incubated over 24 h with Pheo in PBS (free Pheo) or Pheo loaded PEO-PCL or PEO-PS micelles. (b) Quantification by flow cytometry of Pheo fluorescence in A375 cells when incubated over 24 h with Pheo in PBS (free Pheo) or Pheo loaded PEO-PCL or PEO-PS micelles. n = 4. Data are represented as the mean value ± SEM.
Figure 3
Figure 3
Transfer of polymers from micelles to LUVs. (a) Analysis of Rhodamine labelled PEO-PCL transfer from PEO-PCL micelles to NBD-LUVs, assessed by FRET. (b) Carboxyfluoresceine leakage from DOPC LUVs alone and DOPC LUVs challenged with free Pheo and with the PEO-PCL and PEO-PS micelles.
Figure 4
Figure 4
Internalization of PEO-PCL by human tumor cells. (a) Comparison of cell penetration kinetics of Pheo loaded PEO-PCL micelles and rhodamine labelled PEO-PCL micelles, quantified by flow cytometry in HCT-116. (b) Comparison of cell penetration kinetics of Pheo loaded PEO-PCL micelles and rhodamine labelled PEO-PCL micelles, quantified by flow cytometry in HCT-116. n = 4. Data are represented as the mean value ± SEM.
Figure 5
Figure 5
Analysis of Pheo loaded micelles interactions with liposomes under light irradiation. (a) The permeability of liposomes was quantified by fluorescence through carboxyfluoresceine (CBF) leakage. Dashed bar indicates light irradiation. LUV = Large Unilamellar Vesicle. (b) P = permeability constant. (c) Singlet oxygen quantum yield of free Pheo of Pheo loaded micelles quantified by spectrophotometric analysis. (d) Determination of oxidation rate constant from fitted UPLC-MS data. *** = p < 0.001.
Figure 6
Figure 6
Assessment of tumor cell viability after PDT treatment with Pheo loaded PEO-PCL and PEO-PS micelles in 2D monolayers and flow cytometry analysis of Pheo levels in cells. (a) Cell viability was quantified 24 h after PDT treatment on monolayers using prestoblue assay. n = 3, n > 15. (b and c) After 30 min of incubation with Pheo loaded micelles or free Pheo, cells were analyzed by flow cytometry for positively labelled cells percentage (b) and the fluorescence intensity of Pheo in positively labelled cells (c). Statistical analysis by one-way ANOVA followed by Tukey’s multiple comparisons test. ns = non-significant; **** = p < 0.0001. Data are represented as the mean value ± SEM.
Figure 7
Figure 7
Assessment of tumor cell viability after PDT treatment with Pheo loaded PEO-PCL and PEO-PS micelles on 3D spheroids. (a) Growth curve of tumor spheroids after PDT treatment. n = 6. (b) Cell viability assessed 6 days after PDT treatment by intracellular ATP quantification on spheroids. n = 6. Statistical analysis by one (b) or two (a) –way ANOVA followed by Tukey’s multiple comparisons test. ns = non-significant; * = p < 0.1, ** = p < 0.05, **** = p < 0.0001. Data are represented as the mean value ± SEM.

References

    1. Doogue M.P., Polasek T.M. The ABCD of clinical pharmacokinetics. Ther. Adv. Drug Saf. 2013;4:5–7. doi: 10.1177/2042098612469335. - DOI - PMC - PubMed
    1. Riehemann K., Schneider S.W., Luger T.A., Godin B., Ferrari M., Fuchs H. Nanomedicine—Challenge and Perspectives. Angew. Chem. Int. Ed. 2009;48:872–897. doi: 10.1002/anie.200802585. - DOI - PMC - PubMed
    1. Beija M., Salvayre R., Lauth-de Viguerie N., Marty J.-D. Colloidal systems for drug delivery: From design to therapy. Trends Biotechnol. 2012;30:485–496. doi: 10.1016/j.tibtech.2012.04.008. - DOI - PubMed
    1. Matsumura Y., Maeda H. A New Concept for Macromolecular Therapeutics in Cancer Chemotherapy: Mechanism of Tumoritropic Accumulation of Proteins and the Antitumor Agent Smancs. Cancer Res. 1986;46:6387–6392. - PubMed
    1. Maeda H. Tumor-Selective Delivery of Macromolecular Drugs via the EPR Effect: Background and Future Prospects. Bioconjug. Chem. 2010;21:797–802. doi: 10.1021/bc100070g. - DOI - PubMed

LinkOut - more resources