Review
. 2020 Feb 8;13(3):784.
doi: 10.3390/ma13030784.

Antimicrobial Nanostructured Coatings: A Gas Phase Deposition and Magnetron Sputtering Perspective

Affiliations
Review

Antimicrobial Nanostructured Coatings: A Gas Phase Deposition and Magnetron Sputtering Perspective

Giulio Benetti et al. Materials (Basel). .

Abstract

Antimicrobial coatings are a promising strategy to counteract the spreading of multi-drug-resistant pathogens through cross-contamination of surfaces. Coatings with nanostructured characteristics can exploit the different antimicrobial mechanisms of nanomaterials provided the composition, the morphology and the mechanical properties of the film can be tuned by the specific synthesis methods. This review addresses the synthesis of antibacterial nanostructured coatings with a focus on physical synthesis methods. After a short description of the bacteria-NP interaction mechanism, leading to the killing of cells, paradigmatic examples of coatings, obtained by magnetron sputtering and supersonic cluster beam deposition, are discussed, with an emphasis on the possibility of combining different elements into the coating to widen the bactericidal spectrum.

Keywords: antimicrobial coatings; clusters; granular materials, functional materials; magnetron sputtering; mechanical properties; metals; oxides; single and multi-element nanoparticles; supersonic beams.


Conflict of interest statement

The authors declare no conflict of interest.

Figures

Figure 1
Figure 1
Schematic representation of a bacterium on a surface of a nanostructured coating. The major coating/bacterium interaction mechanisms are listed.
Figure 2
Figure 2
(a) Scheme of the magnetron sputtering process.; (b) scheme of the beam synthesis from pulsed gas sources.
Figure 3
Figure 3
(A) Plot of the X-ray diffraction intensity versus 2θ showing single phase cubic AgO and mixed phase AgO and Ag2O deposited at lower oxygen partial pressure; (B) scanning electron micrograph showing the typical surface microstructure of the silver oxide deposited at room temperature. The microstructure can be impacted by deposition pressure, deposition power, oxygen partial pressure, and coating thickness. Reprinted from [67] under the Creative Commons Attribution License 4.0.
Figure 4
Figure 4
(a) Hardness H (gray squares), effective Young’s modulus E* (black circles); and (b) elastic recovery We (gray squares) and H/E* ratio (black circles) of Zr–Cu–N coatings sputtered on Si (100) substrates as a function of Cu content. Reprinted from [121], Copyright 2015, with permission from AIP Publishing LLC.
Figure 5
Figure 5
(a) Normalized O1s core level spectra obtained from the as-deposited Ag NPs film (curve 0d) and from the same film two days (curve 2d), seven days (curve 7d) and fifteen days (curve 15d) after the deposition. In the bottom panel the difference spectra show that the variation of the peak observed after 2 days (curve 2d-0d) remains mostly unchanged up to 15 days. (b) O1s core level obtained from the Ag NPs film two days after deposition, with the peaks resulting from the least square fitting procedure. The AgO related peak (dark gray) is at 530.2 eV binding energy while the SiO2 related peak (light gray) is at 531.6 eV binding energy. (c) intensity dependence of the relative area of the two peaks as a function of time.
Figure 6
Figure 6
(a) The NPs virtual thin film (dimensions LX × LY × LZ = 35 nm × 20 nm × 30 nm) obtained by MD simulations. The NPs are divided into blue (large, diameter ~ 6 nm) and green (small, diameter ~ 1 nm). (b) Experimental AFM image of the 30 nm-thick Ag NPs film. (c) Computed AFM images obtained from the simulated cell and taking into account tip convolution effects. The computed images are obtained from intermediate deposition steps of the MD simulations, i.e., subsequent shots of the simulation resulting in films of average thickness ⟨tF⟩ = 9, 14, 23, 27, and 31 nm for shots one through five, respectively. Adapted from [132] (https://pubs.acs.org/doi/10.1021/acs.jpcc.7b05795), with permission from ACS (further permissions related to the material excerpted should be directed to the ACS).
Figure 7
Figure 7
Quantification of the ME for different extensively drug-resistant phenotypes. All microorganisms were tested in three independent experiments and results were averaged. To calculate standard deviations (SD), when no viable cells were counted, the result was arbitrarily assumed as 4.2 × 101 CFU, representing the detection limit value.
Figure 8
Figure 8
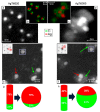
(a,d) TEM images of AgTi8020 and AgTi5050 scattered NPs, respectively, with the relative elemental map plotted in panels (b,c), respectively. The data show that Ag and Ti are phase-separated into the NPs. (e,f) HR-STEM images of the NPs, with the inset showing the FFT analysis of Ag crystalline structure of the zone in the purple rectangle. Red arrows indicate small Ag NPs, and green arrows point to the Ti part of the NPs. The data indicate that Ag is crystalline and Ti is amorphous. (g,h) Schematic representation of the elemental weight in the initial rod and in the NPS, showing the good correspondence of the material concentration. Adapted from Ref. [71] under the Creative Commons Attribution License 4.0.
Figure 9
Figure 9
STEM (a) and corresponding EDX elemental maps (b) for the Mg/Ag/Cu NPs. Scale bar is 20 nm. Adapted from Ref. [146] under the Creative Commons Attribution License 4.0.
Figure 10
Figure 10
Microbicidal tests on S. aureus (blue) and E. coli (red), comparing the count of viable bacteria (reported as CFU per milliliter) of the control before incubation (T0), control bare substrate after incubation (Control), pure Mg NPs (Mg NP), and tri-elemental AgCuMg503020 film. The dashed line at 102 CFU ml−1 is the limit of detection of the experiment. Reproduced from [146] by permission of the PCCP Owner Societies.

References

    1. Jeevanandam J., Barhoum A., Chan Y.S., Dufresne A., Danquah M.K. Review on nanoparticles and nanostructured materials: History, sources, toxicity and regulations. Beilstein J. Nanotechnol. 2018;9:1050–1074. doi: 10.3762/bjnano.9.98. - DOI - PMC - PubMed
    1. Calderon Velasco S., Cavaleiro A., Carvalho S. Functional properties of ceramic-Ag nanocomposite coatings produced by magnetron sputtering. Prog. Mater. Sci. 2016;84:158–191. doi: 10.1016/j.pmatsci.2016.09.005. - DOI
    1. Mazza T., Barborini E., Kholmanov I.N., Piseri P., Bongiorno G., Vinati S., Milani P., Ducati C., Cattaneo D., Li Bassi A., et al. Libraries of cluster-assembled titania films for chemical sensing. Appl. Phys. Lett. 2005;87:103108. doi: 10.1063/1.2035874. - DOI
    1. Baletto F., Ferrando R. Structural properties of nanoclusters: Energetic, thermodynamic, and kinetic effects. Rev. Mod. Phys. 2005;77:371–423. doi: 10.1103/RevModPhys.77.371. - DOI
    1. Grigore M., Biscu E., Holban A., Gestal M., Grumezescu A. Methods of Synthesis, Properties and Biomedical Applications of CuO Nanoparticles. Pharmaceuticals. 2016;9:75. doi: 10.3390/ph9040075. - DOI - PMC - PubMed

LinkOut - more resources