

Expansion of sweet taste receptor genes in grass carp (Ctenopharyngodon idellus) coincided with vegetarian adaptation
- PMID: 32046636
- PMCID: PMC7014666
- DOI: 10.1186/s12862-020-1590-1
Expansion of sweet taste receptor genes in grass carp (Ctenopharyngodon idellus) coincided with vegetarian adaptation
Abstract
Background: Taste is fundamental to diet selection in vertebrates. Genetic basis of sweet taste receptor in the shaping of food habits has been extensively studied in mammals and birds, but scarcely studied in fishes. Grass carp is an excellent model for studying vegetarian adaptation, as it exhibits food habit transition from carnivory to herbivory.
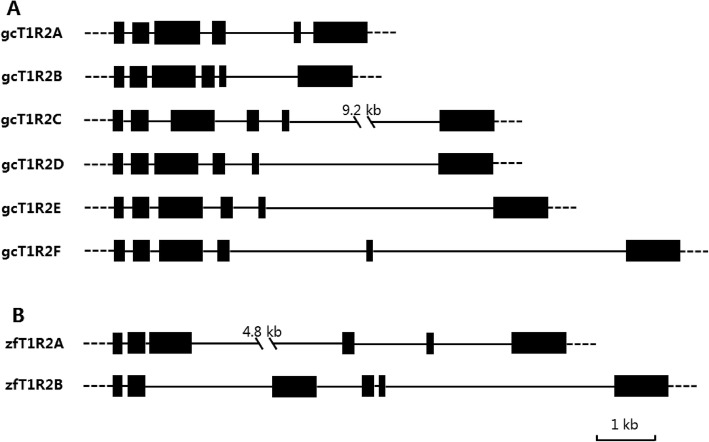
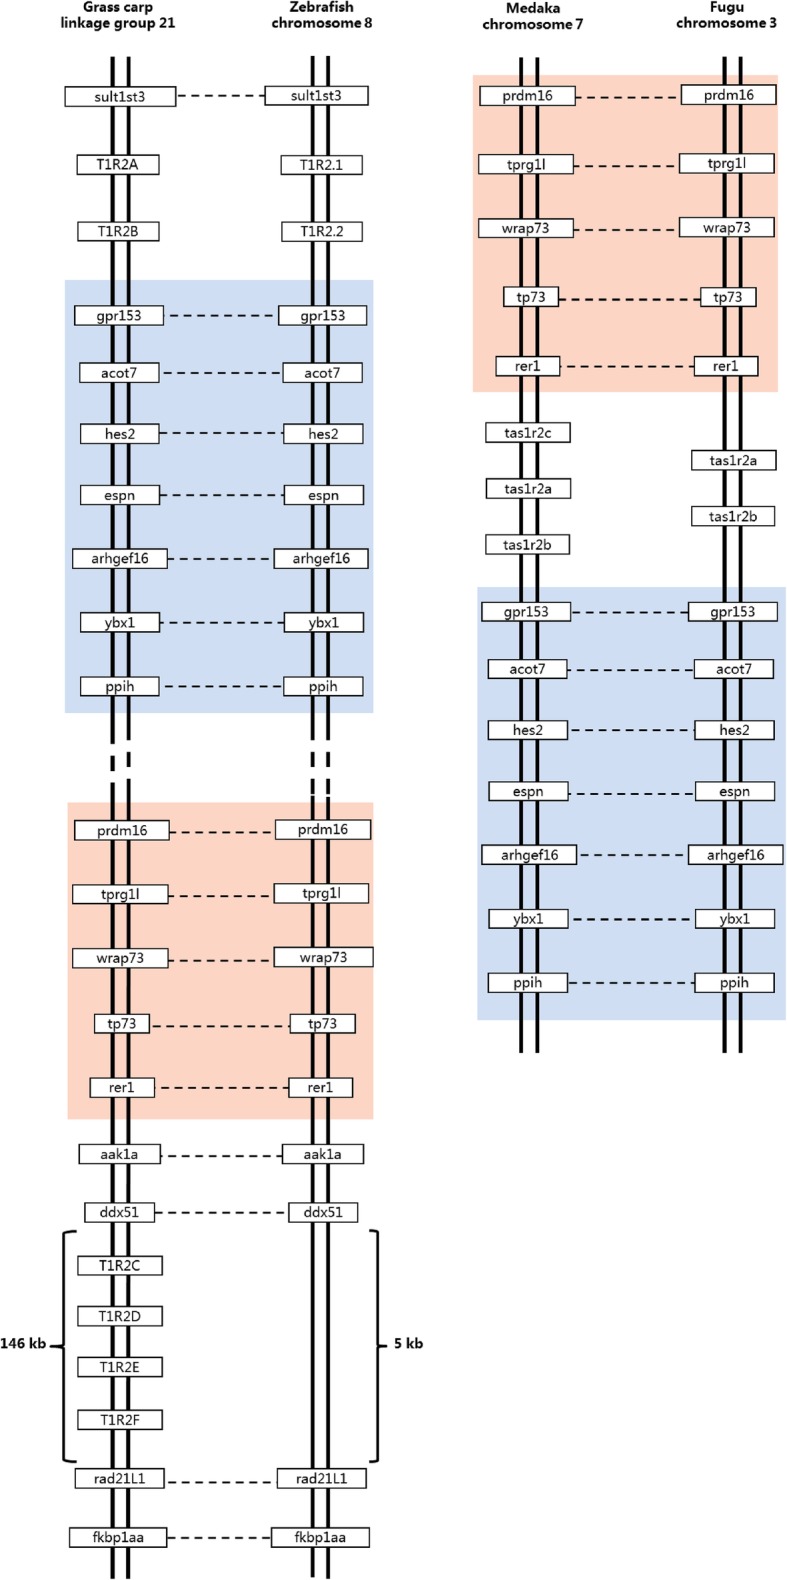
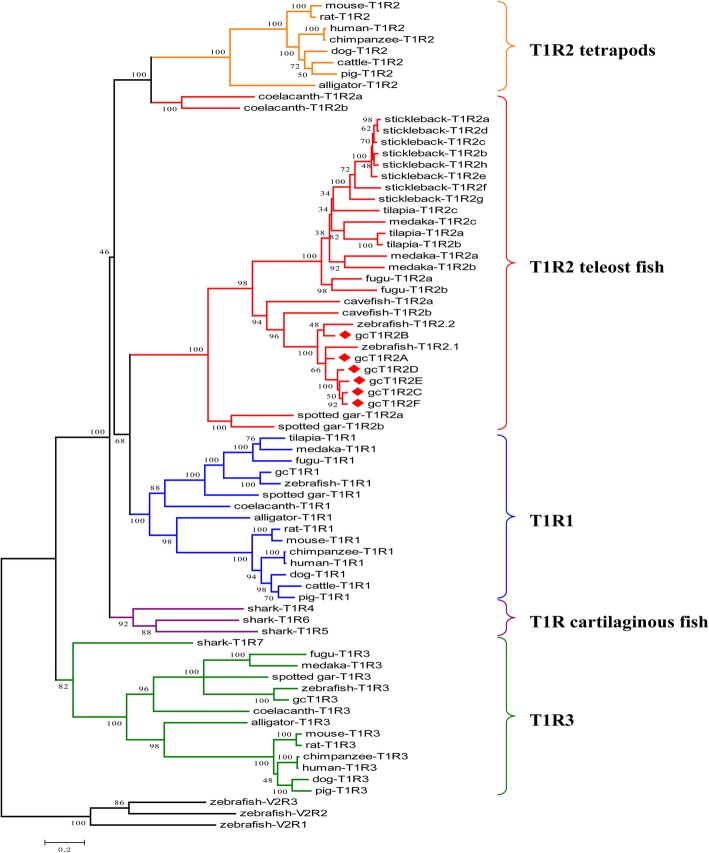
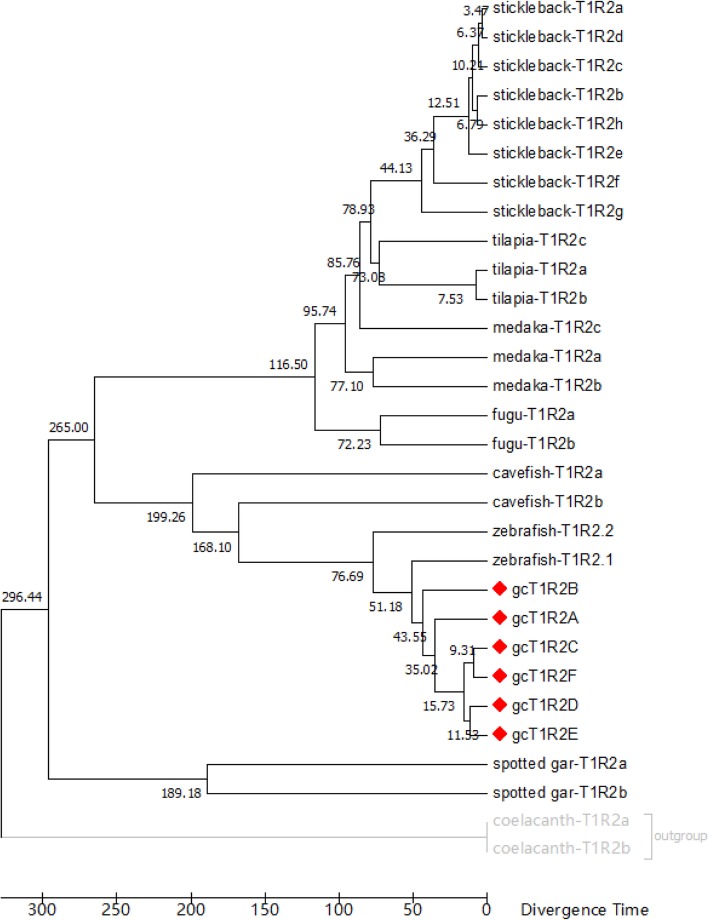
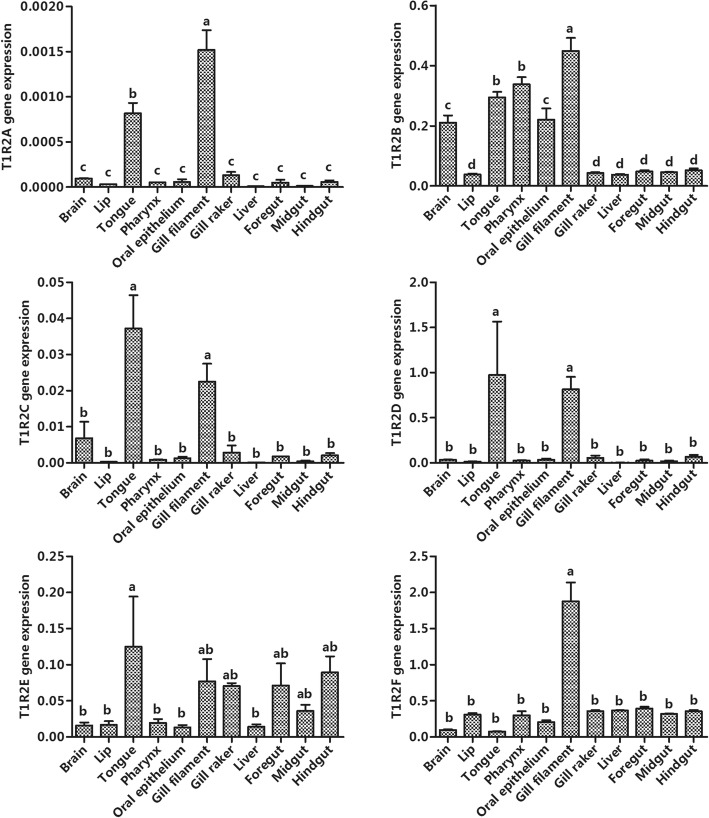
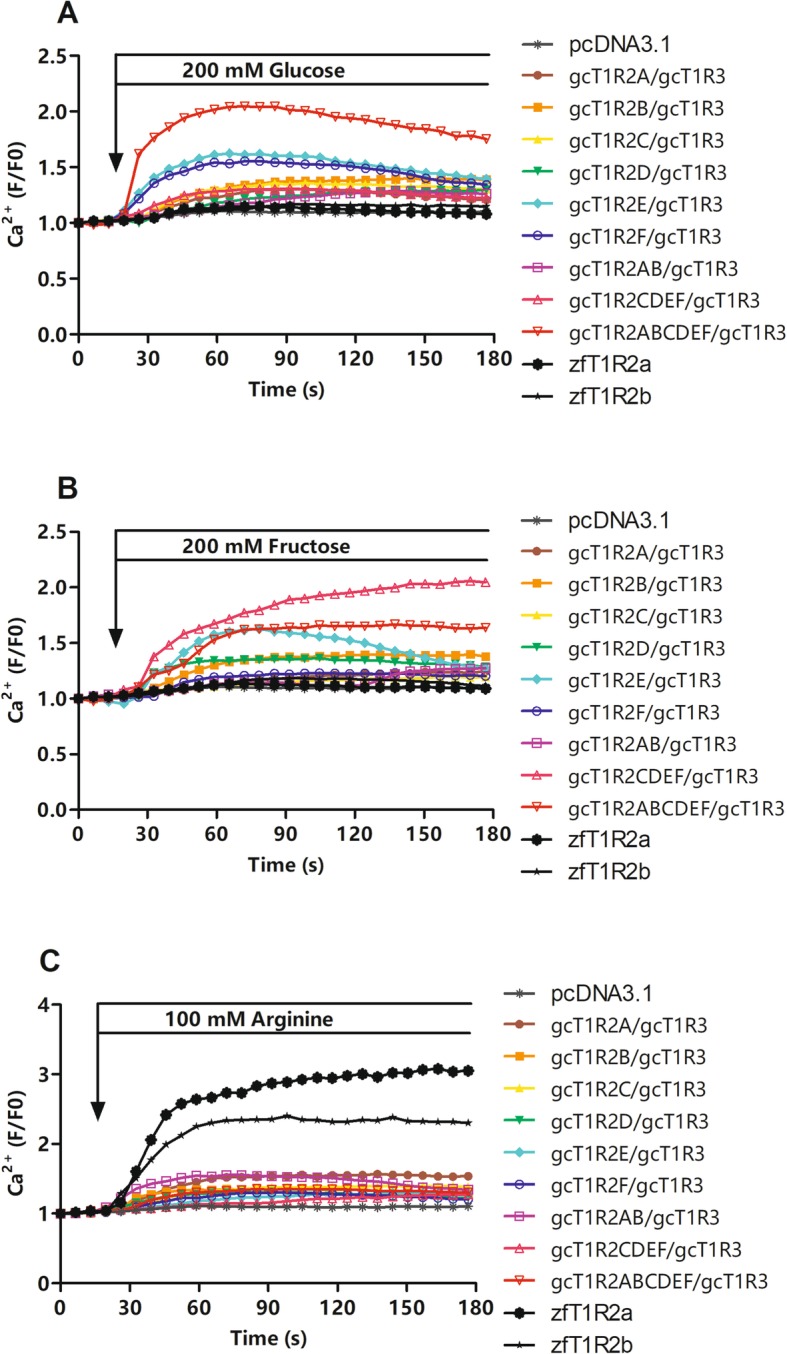
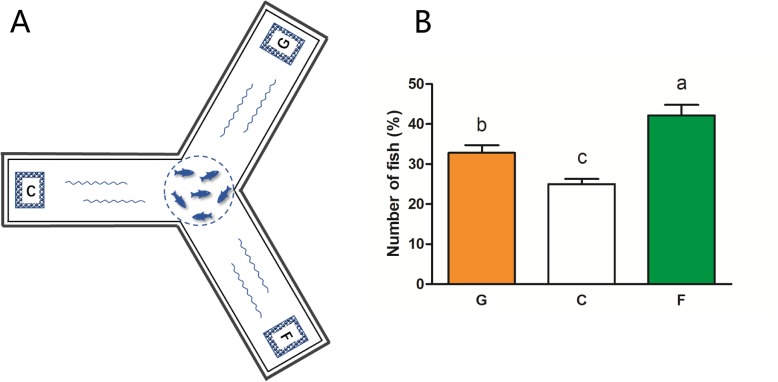
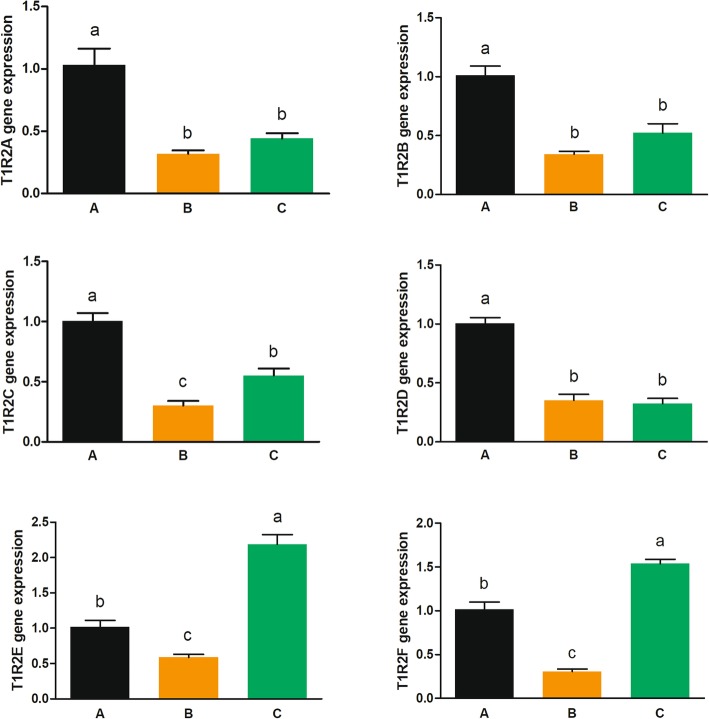
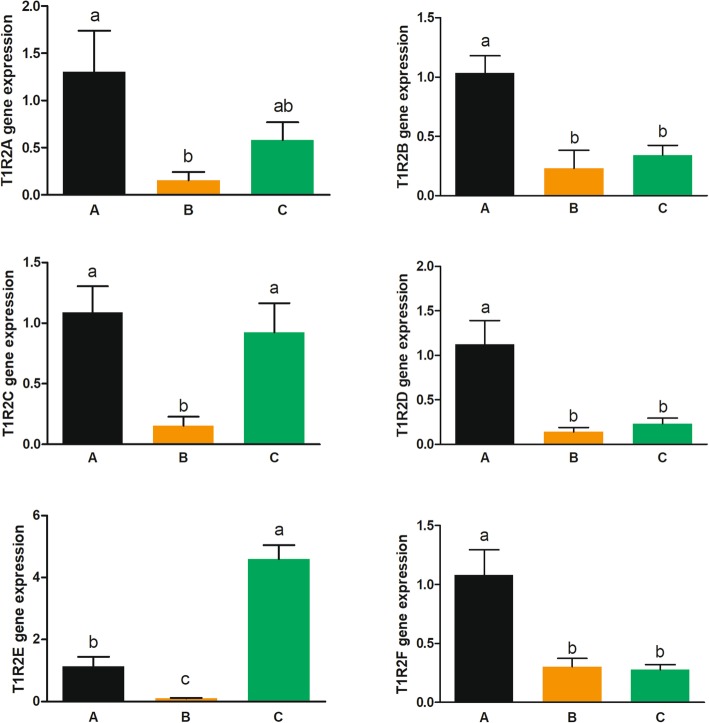
Results: We identified six sweet taste receptors (gcT1R2A-F) in grass carp. The four gcT1R2s (gcT1R2C-F) have been suggested to be evolved from and paralogous to the two original gcT1R2s (gcT1R2A and gcT1R2B). All gcT1R2s were expressed in taste organs and mediated glucose-, fructose- or arginine-induced intracellular calcium signaling, revealing they were functional. In addition, grass carp was performed to prefer fructose to glucose under a behavioral experiment. Parallelly, compared with gcT1R2A-F/gcT1R3 co-transfected cells, gcT1R2C-F/gcT1R3 co-transfected cells showed a higher response to plant-specific fructose. Moreover, food habit transition from carnivory to herbivory in grass carp was accompanied by increased gene expression of certain gcT1R2s.
Conclusions: We suggested that the gene expansion of T1R2s in grass carp was an adaptive strategy to accommodate the change in food environment. Moreover, the selected gene expression of gcT1R2s might drive the food habit transition from carnivory to herbivory in grass carp. This study provided some evolutional and physiological clues for the formation of herbivory in grass carp.
Keywords: Adaptive evolution; Food habit transition; Gene expansion; Herbivory; Taste receptor.
Conflict of interest statement
The authors declare that they have no competing interests.
Figures
Similar articles
-
Transcriptome analysis of food habit transition from carnivory to herbivory in a typical vertebrate herbivore, grass carp Ctenopharyngodon idella.BMC Genomics. 2015 Jan 22;16(1):15. doi: 10.1186/s12864-015-1217-x. BMC Genomics. 2015. PMID: 25608568 Free PMC article.
-
DNA Methylation of T1R1 Gene in the Vegetarian Adaptation of Grass Carp Ctenopharyngodon idella.Sci Rep. 2018 May 2;8(1):6934. doi: 10.1038/s41598-018-25121-4. Sci Rep. 2018. PMID: 29720695 Free PMC article.
-
The draft genome of the grass carp (Ctenopharyngodon idellus) provides insights into its evolution and vegetarian adaptation.Nat Genet. 2015 Jun;47(6):625-31. doi: 10.1038/ng.3280. Epub 2015 May 4. Nat Genet. 2015. PMID: 25938946
-
Molecular cloning of the MARCH family in grass carp (Ctenopharyngodon idellus) and their response to grass carp reovirus challenge.Fish Shellfish Immunol. 2017 Apr;63:480-490. doi: 10.1016/j.fsi.2017.02.030. Epub 2017 Feb 20. Fish Shellfish Immunol. 2017. PMID: 28232196
-
Cats lack a sweet taste receptor.J Nutr. 2006 Jul;136(7 Suppl):1932S-1934S. doi: 10.1093/jn/136.7.1932S. J Nutr. 2006. PMID: 16772462 Free PMC article. Review. No abstract available.
Cited by
-
Comparative genomic analysis of immune-related genes and chemosensory receptors provides insights into the evolution and adaptation of four major domesticated Asian carps.BMC Genomics. 2025 May 26;26(1):529. doi: 10.1186/s12864-025-11719-2. BMC Genomics. 2025. PMID: 40419972 Free PMC article.
-
Insights into the Function and Evolution of Taste 1 Receptor Gene Family in the Carnivore Fish Gilthead Seabream (Sparus aurata).Int J Mol Sci. 2020 Oct 19;21(20):7732. doi: 10.3390/ijms21207732. Int J Mol Sci. 2020. PMID: 33086689 Free PMC article.
-
Sugar-sensing swodkoreceptors and swodkocrine signaling.Animal Model Exp Med. 2025 May;8(5):944-961. doi: 10.1002/ame2.70007. Epub 2025 Mar 20. Animal Model Exp Med. 2025. PMID: 40110750 Free PMC article.
-
The Chinese longsnout catfish genome provides novel insights into the feeding preference and corresponding metabolic strategy of carnivores.Genome Res. 2024 Aug 20;34(7):981-996. doi: 10.1101/gr.278476.123. Genome Res. 2024. PMID: 39122473 Free PMC article.
-
Zebrafish and medaka T1R (taste receptor type 1) proteins mediate highly sensitive recognition of l-proline.FEBS Open Bio. 2023 Mar;13(3):468-477. doi: 10.1002/2211-5463.13558. Epub 2023 Jan 30. FEBS Open Bio. 2023. PMID: 36651084 Free PMC article.
References
Publication types
MeSH terms
Substances
LinkOut - more resources
Full Text Sources
Research Materials
