

A 19-isolate reference-quality global pangenome for the fungal wheat pathogen Zymoseptoria tritici
- PMID: 32046716
- PMCID: PMC7014611
- DOI: 10.1186/s12915-020-0744-3
A 19-isolate reference-quality global pangenome for the fungal wheat pathogen Zymoseptoria tritici
Abstract
Background: The gene content of a species largely governs its ecological interactions and adaptive potential. A species is therefore defined by both core genes shared between all individuals and accessory genes segregating presence-absence variation. There is growing evidence that eukaryotes, similar to bacteria, show intra-specific variability in gene content. However, it remains largely unknown how functionally relevant such a pangenome structure is for eukaryotes and what mechanisms underlie the emergence of highly polymorphic genome structures.
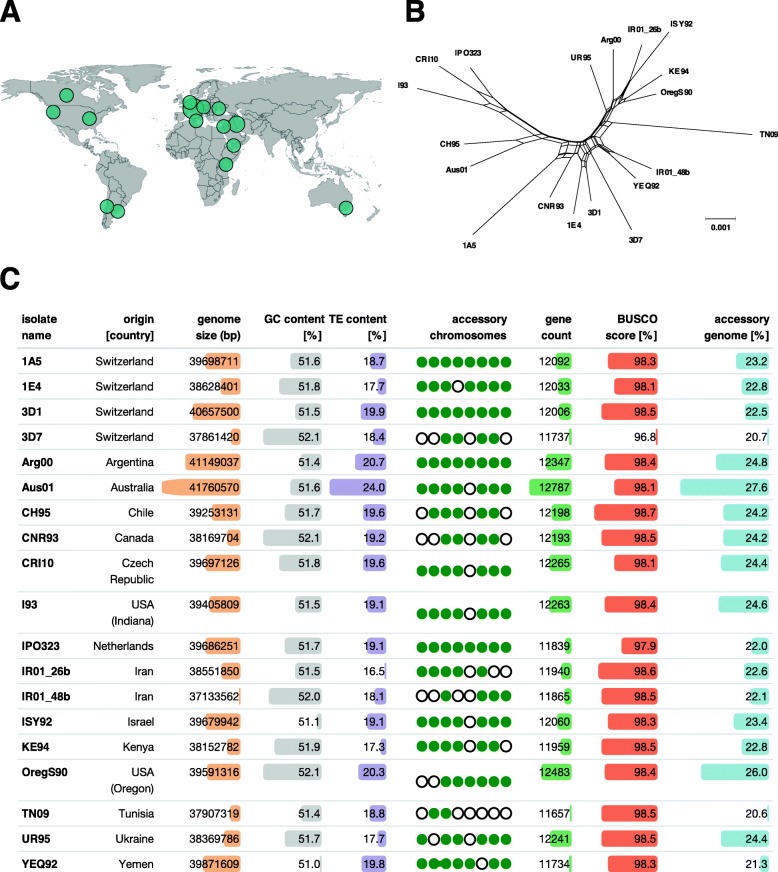
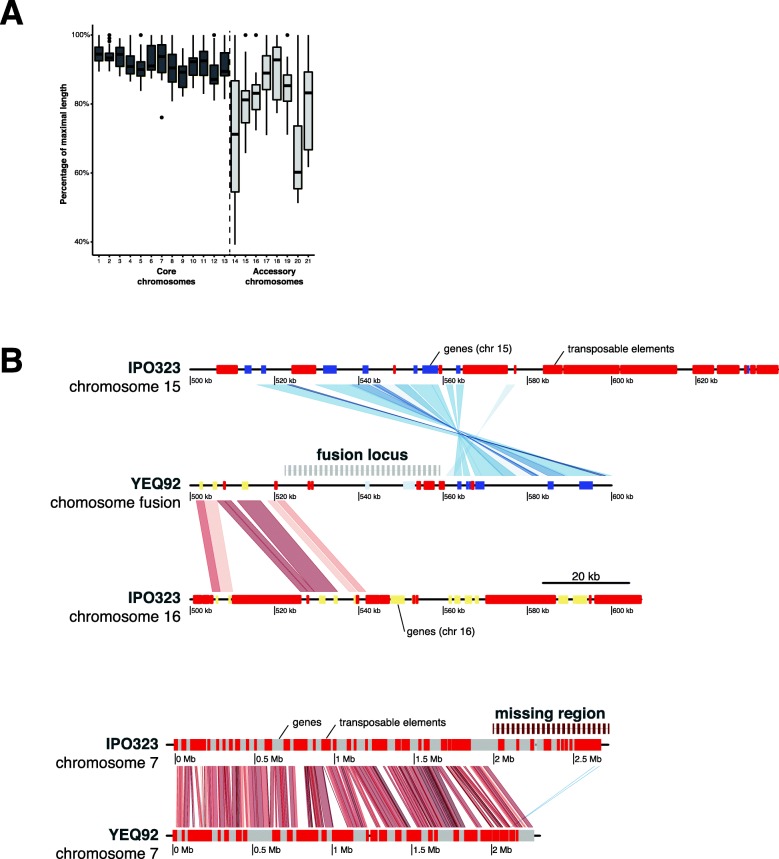
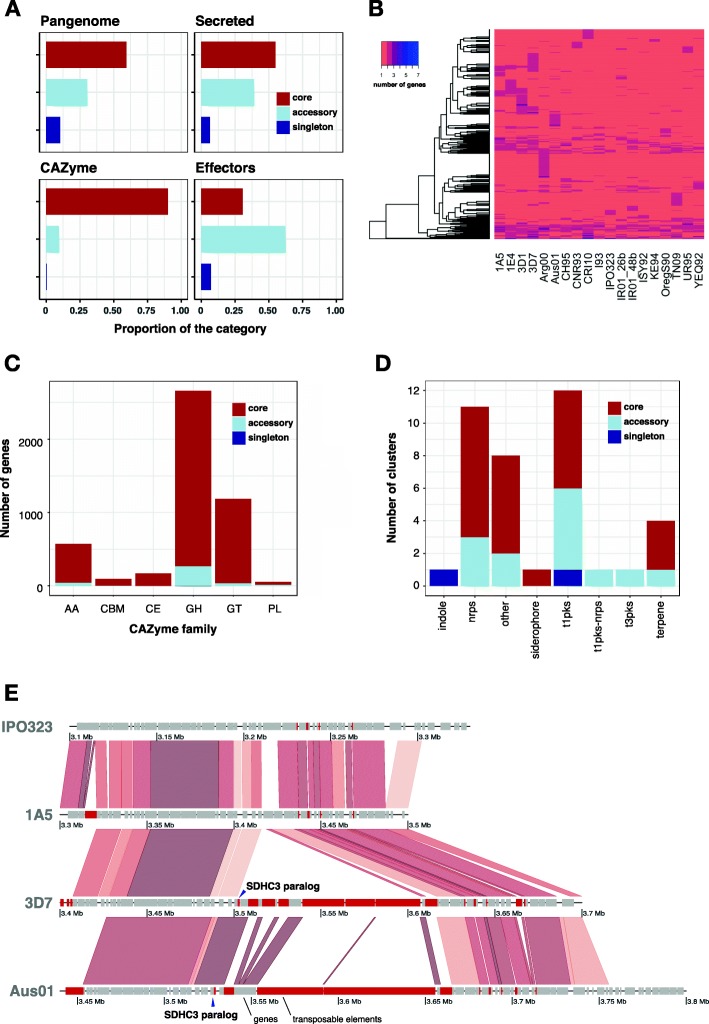
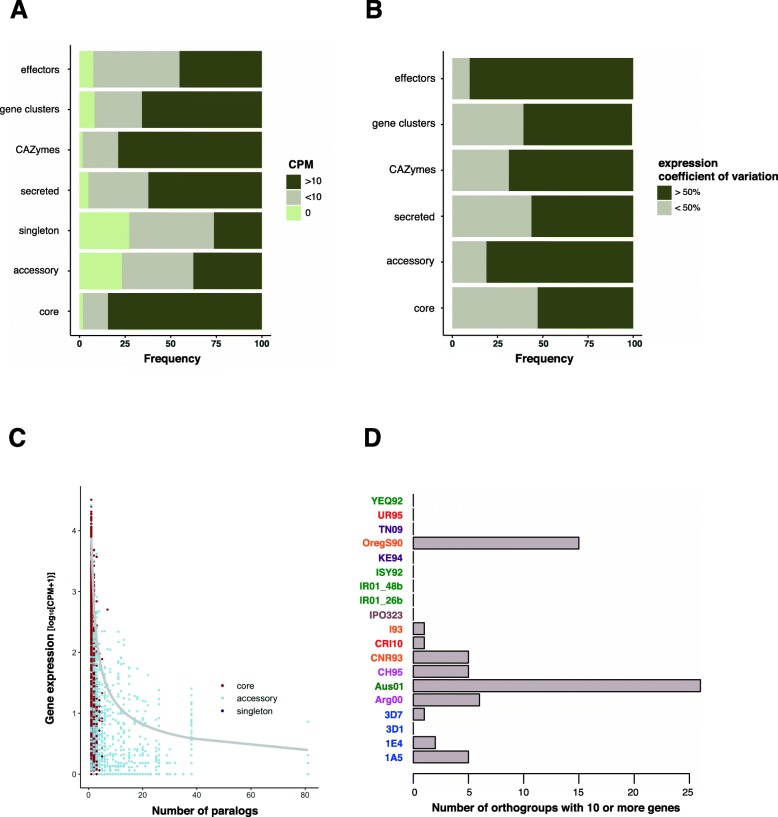
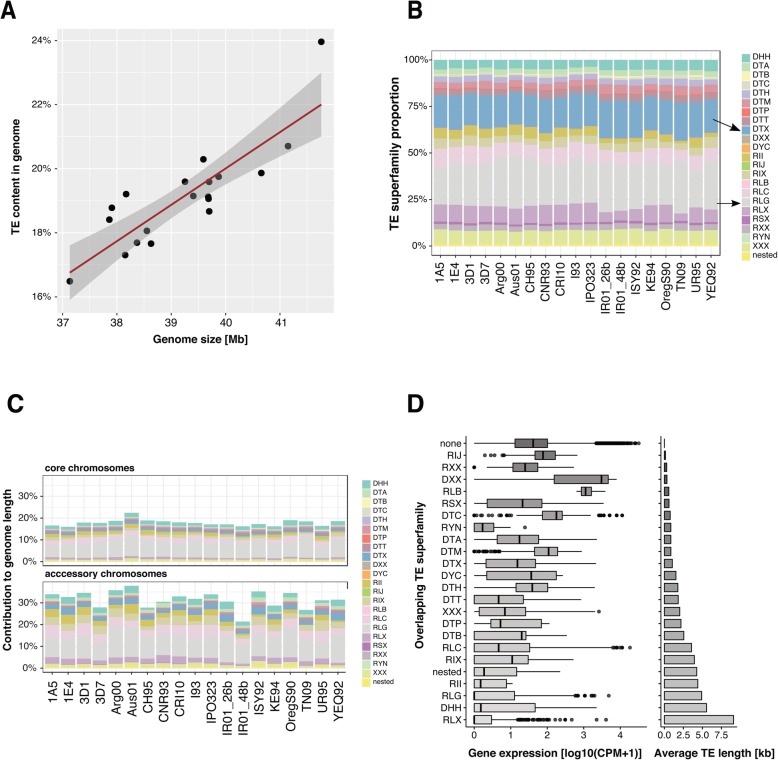
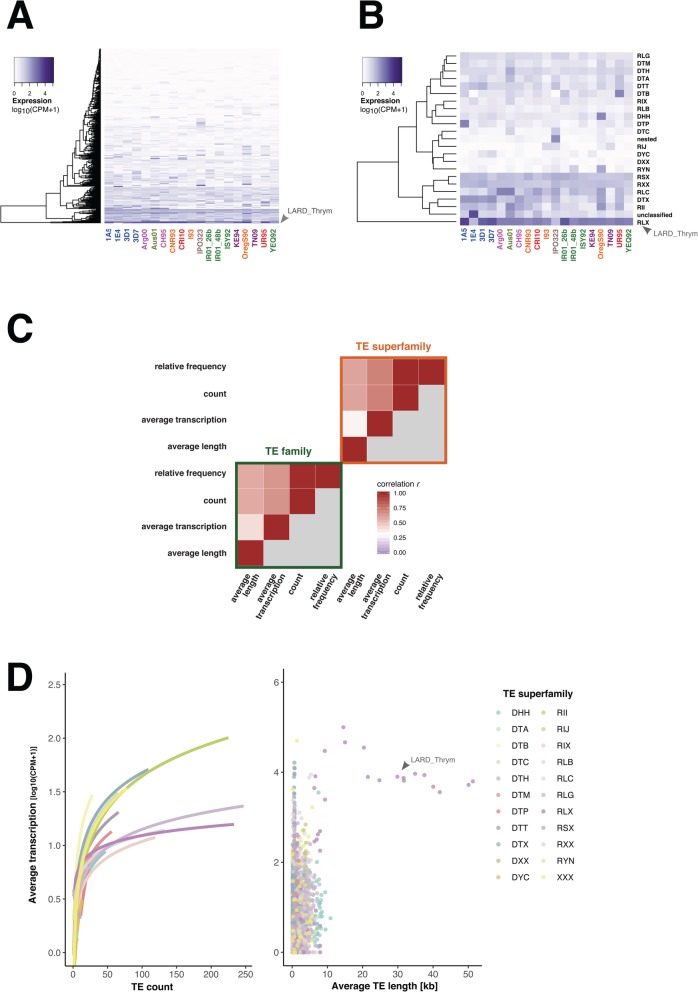
Results: Here, we establish a reference-quality pangenome of a fungal pathogen of wheat based on 19 complete genomes from isolates sampled across six continents. Zymoseptoria tritici causes substantial worldwide losses to wheat production due to rapidly evolved tolerance to fungicides and evasion of host resistance. We performed transcriptome-assisted annotations of each genome to construct a global pangenome. Major chromosomal rearrangements are segregating within the species and underlie extensive gene presence-absence variation. Conserved orthogroups account for only ~ 60% of the species pangenome. Investigating gene functions, we find that the accessory genome is enriched for pathogenesis-related functions and encodes genes involved in metabolite production, host tissue degradation and manipulation of the immune system. De novo transposon annotation of the 19 complete genomes shows that the highly diverse chromosomal structure is tightly associated with transposable element content. Furthermore, transposable element expansions likely underlie recent genome expansions within the species.
Conclusions: Taken together, our work establishes a highly complex eukaryotic pangenome providing an unprecedented toolbox to study how pangenome structure impacts crop-pathogen interactions.
Conflict of interest statement
The authors declare that they have no competing interests.
Figures
Similar articles
-
Pangenome analyses of the wheat pathogen Zymoseptoria tritici reveal the structural basis of a highly plastic eukaryotic genome.BMC Biol. 2018 Jan 11;16(1):5. doi: 10.1186/s12915-017-0457-4. BMC Biol. 2018. PMID: 29325559 Free PMC article.
-
The Evolution of Orphan Regions in Genomes of a Fungal Pathogen of Wheat.mBio. 2016 Oct 18;7(5):e01231-16. doi: 10.1128/mBio.01231-16. mBio. 2016. PMID: 27795389 Free PMC article.
-
RNA-seq-Based Gene Annotation and Comparative Genomics of Four Fungal Grass Pathogens in the Genus Zymoseptoria Identify Novel Orphan Genes and Species-Specific Invasions of Transposable Elements.G3 (Bethesda). 2015 Apr 27;5(7):1323-33. doi: 10.1534/g3.115.017731. G3 (Bethesda). 2015. PMID: 25917918 Free PMC article.
-
Overview of genomic and bioinformatic resources for Zymoseptoria tritici.Fungal Genet Biol. 2015 Jun;79:13-6. doi: 10.1016/j.fgb.2015.04.011. Fungal Genet Biol. 2015. PMID: 26092784 Review.
-
The wheat-Septoria conflict: a new front opening up?Trends Plant Sci. 2014 Sep;19(9):602-10. doi: 10.1016/j.tplants.2014.04.011. Epub 2014 Jun 20. Trends Plant Sci. 2014. PMID: 24957882 Review.
Cited by
-
Recent loss of the Dim2 DNA methyltransferase decreases mutation rate in repeats and changes evolutionary trajectory in a fungal pathogen.PLoS Genet. 2021 Mar 22;17(3):e1009448. doi: 10.1371/journal.pgen.1009448. eCollection 2021 Mar. PLoS Genet. 2021. PMID: 33750960 Free PMC article.
-
A thousand-genome panel retraces the global spread and adaptation of a major fungal crop pathogen.Nat Commun. 2023 Feb 24;14(1):1059. doi: 10.1038/s41467-023-36674-y. Nat Commun. 2023. PMID: 36828814 Free PMC article.
-
Quantitative trait locus mapping of osmotic stress response in the fungal wheat pathogen Zymoseptoria tritici.G3 (Bethesda). 2023 Dec 6;13(12):jkad226. doi: 10.1093/g3journal/jkad226. G3 (Bethesda). 2023. PMID: 37774498 Free PMC article.
-
A conserved fungal Knr4/Smi1 protein is crucial for maintaining cell wall stress tolerance and host plant pathogenesis.PLoS Pathog. 2025 Jan 9;21(1):e1012769. doi: 10.1371/journal.ppat.1012769. eCollection 2025 Jan. PLoS Pathog. 2025. PMID: 39787257 Free PMC article.
-
Comparative Genomics Reveals Sources of Genetic Variability in the Asexual Fungal Plant Pathogen Colletotrichum lupini.Mol Plant Pathol. 2024 Dec;25(12):e70039. doi: 10.1111/mpp.70039. Mol Plant Pathol. 2024. PMID: 39673077 Free PMC article.
References
Publication types
MeSH terms
Substances
LinkOut - more resources
Full Text Sources
