. 2020 Feb 11;19(1):27.
doi: 10.1186/s12934-020-01299-z.

Effect of the TetR family transcriptional regulator Sp1418 on the global metabolic network of Saccharopolyspora pogona

Affiliations

Effect of the TetR family transcriptional regulator Sp1418 on the global metabolic network of Saccharopolyspora pogona

Haocheng He et al. Microb Cell Fact. .

Abstract

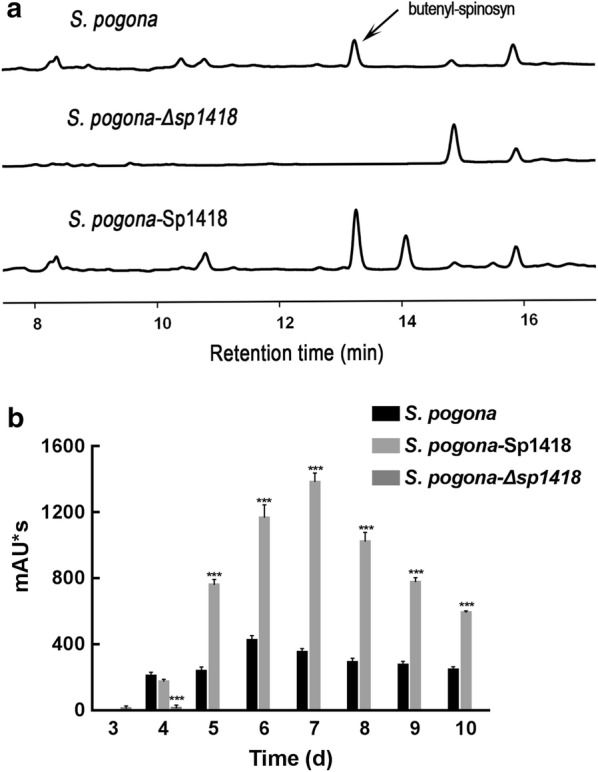
Background: Saccharopolyspora pogona is a prominent industrial strain due to its production of butenyl-spinosyn, a high-quality insecticide against a broad spectrum of insect pests. TetR family proteins are diverse in a tremendous number of microorganisms and some are been researched to have a key role in metabolic regulation. However, specific functions of TetR family proteins in S. pogona are yet to characterize.

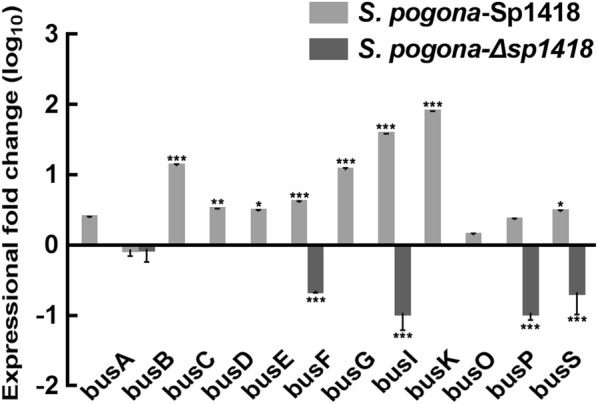
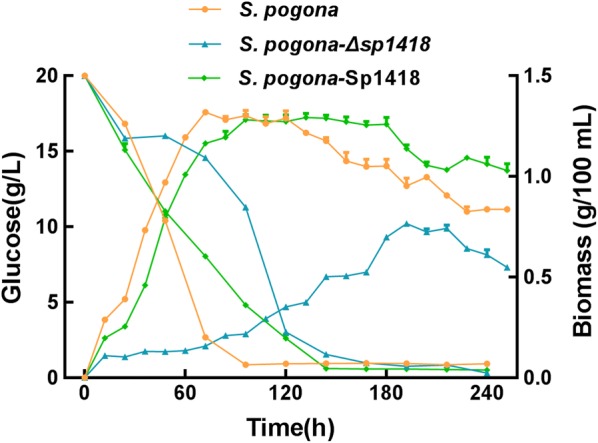
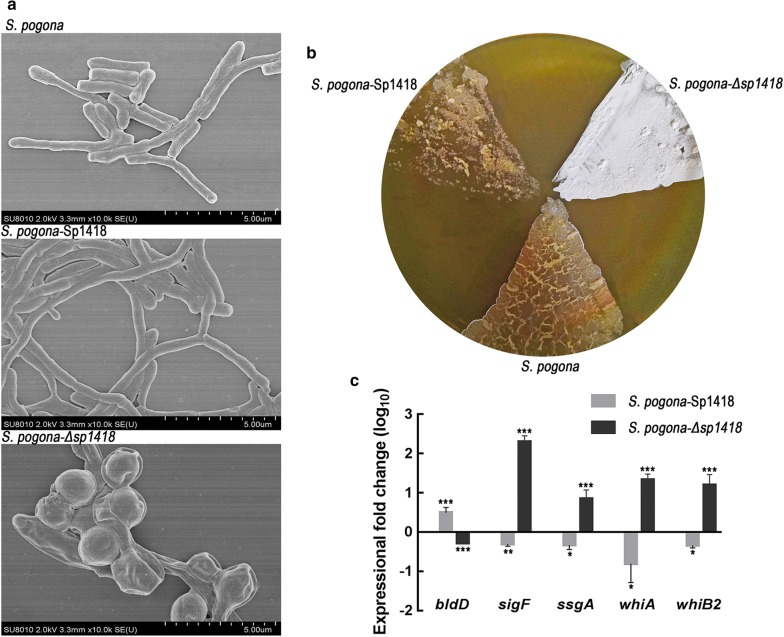
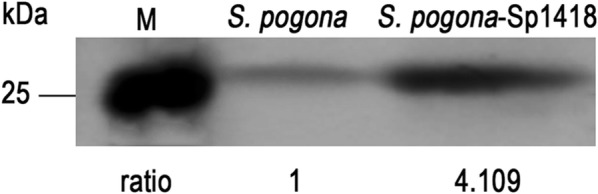
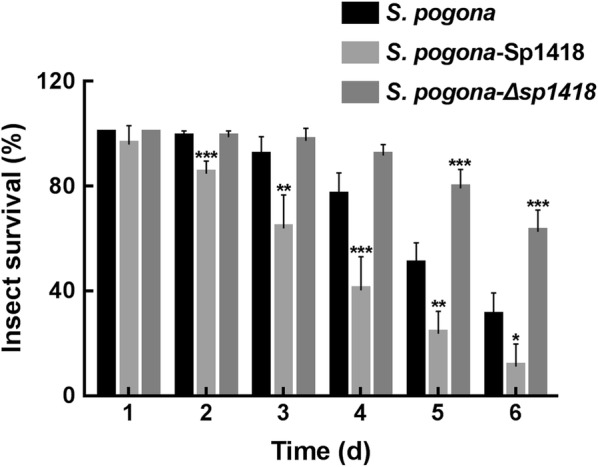
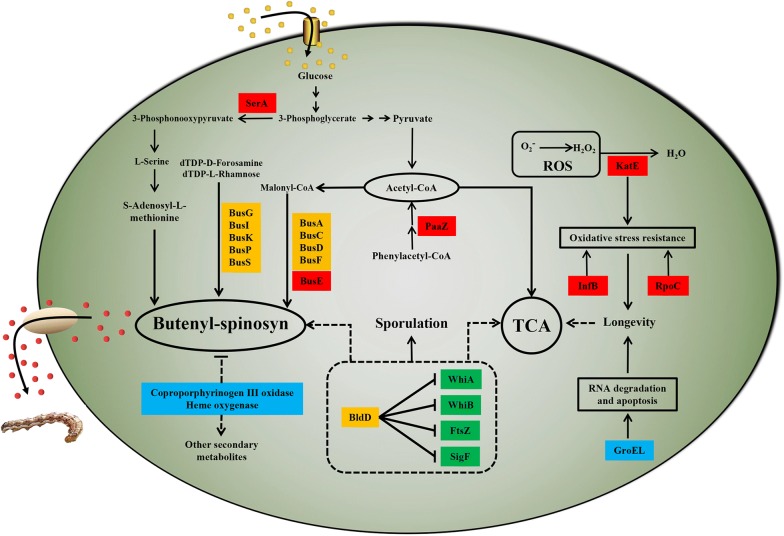
Results: In the present study, the overexpression of the tetR-like gene sp1418 in S. pogona resulted in marked effects on vegetative growth, sporulation, butenyl-spinosyn biosynthesis, and oxidative stress. By using qRT-PCR analysis, mass spectrometry, enzyme activity detection, and sp1418 knockout verification, we showed that most of these effects could be attributed to the overexpression of Sp1418, which modulated enzymes related to the primary metabolism, oxidative stress and secondary metabolism, and thereby resulted in distinct growth characteristics and an unbalanced supply of precursor monomers for butenyl-spinosyn biosynthesis.

Conclusion: This study revealed the function of Sp1418 and enhanced the understanding of the metabolic network in S. pogona, and provided insights into the improvement of secondary metabolite production.

Keywords: Butenyl-spinosyn; Oxidative stress; Saccharopolyspora pogona; TetR family transcriptional regulator.


Conflict of interest statement

The authors declare that they have no competing interests.

Figures

Fig. 1
Fig. 1
Butenyl-spinosyn production analysis. a The HPLC profiles of the wild-type and mutant strains. The detection wavelength was set at 250 nm during the analysis, and the chromatographic peak of butenyl-spinosyn appeared at 13.1 min. b Butenyl-spinosyn was detected for 10 days in the wild-type and mutant strains. The maximum production of butenyl-spinosyn in S. pogona was 424.3 mAU*s, and that of S. pogona-Sp1418 was 1382.9 mAU*s, while butenyl-spinosyn was hardly detected in S. pogonasp1418 under the same conditions. The maximum concentration of butenyl-spinosyn produced by S. pogona-Sp1418 increased by 225.9% as compared to that produced by wild type. *, **and *** indicated P < 0.05, P < 0.01 and P < 0.005, respectively, compared to S. pogona under the same conditions. Error bars indicated standard errors of results from n = 3 replicates
Fig. 2
Fig. 2
Expression levels of the bus genes in S. pogona and mutant strains. mRNA samples were isolated from wild-type and engineering strain cells cultured for 144 h, The transcriptional levels (log10) of the genes busA, busC, busD, busE, busF, busG, busI, busP, busO, busK and busS genes in S. pogona-Sp1418 were 0.39-, 1.12-, 0.51-, 0.48-, 0.60-, 1.06-, 1.57-, 1.89-, 0.14-, 0.36-, and 0.47-fold higher than those in S. pogona, respectively, which indicated a significant upregulation. Limited expression was detected for many bus genes in, and only busB, busF, busI, busP, and busS were detected, with expression levels (log10) of 0.05, 0.65, 0.96, 0.96 and 0.67 times that of wild-type bacteria. The 16S rRNA gene was used as an internal control to quantify the relative expression of target genes. Gene expression differences are shown by bar height. Error bars represent the standard deviation of the mean. *, **and *** indicated P < 0.05, P < 0.01 and P < 0.005, respectively, compared to S. pogona under the same conditions. Error bars indicated standard errors of results from n = 3 replicates
Fig. 3
Fig. 3
Growth curve and glucose consumption of S. pogona, S. pogonasp1418 and S. pogona-Sp1418. S. pogonasp1418 exhibited a slow growth trend, especially in the logarithmic phase, in which the final biomass values of S. pogonasp1418 were lower compared to those of wild type and S. pogona-Sp1418. S. pogona-Sp1418 showed a slightly slower logarithmic growth and entered stationary phase at 96 h, which was 24 h later compared to the wild-type strain, and lasted up to 180 h, which was greatly extended compared to the wild-type strain. Glucose consumption by the knockout strain was the slowest and exhausted in 168 h, which may be related to its growth restriction. The rate of glucose consumption in the logarithmic phase of the overexpression strain was slower, lasting for 48 h more than the wild-type bacteria, and the result was consistent with the growth curve. Error bars indicated standard errors of results from n = 3 replicates
Fig. 4
Fig. 4
The growth profiles and phenotypic differences in wild type, S. pogonasp1418 and S. pogona-Sp1418. a Cold field emission scanning electron micrographs of mycelium. The mycelium of S. pogona-Sp1418 grew longer and was more branched than that of S. pogona. Little mycelium was found in S. pogonasp1418, exhibiting a specific spore-germination phenotype. b The phenotypic comparison of the wild-type and engineered strains on CSM medium. Spores were produced on the second day of culture on the medium. S. pogonasp1418 exhibited a typically white phenotype, which grew more abundantly and faster than the wild-type strain. The spores of S. pogona-Sp1418 were hardly observed on the medium. c Expression levels of bldD, sigF, ssgA, whiA and whiB in S. pogona and S. pogona-Sp1418. mRNA samples were isolated from wild-type and engineered strain cells after 48 h of incubation. The transcriptional levels (log10) of the bldD gene were 0.49-fold higher in S. pogona-Sp1418 and 0.28-fold lower in S. pogonasp1418 than in S. pogona. The transcriptional levels (log10) of sigF, ssgA, whiA and whiB were 0.31-, 0.33-, 0.81- and 0.34-fold lower in S. pogona-Sp1418 than in S. pogona, respectively, and were 2.30-, 0.85-, 1.33-, 1.20-fold higher in S. pogonasp1418 than in S. pogona, respectively. The 16S rRNA gene was used as an internal control to quantify the relative expression of the target genes. Gene expression differences are shown by the bar height. Error bars represent the standard deviation of the mean. *, **and *** indicated P < 0.05, P < 0.01 and P < 0.005, respectively, compared to S. pogona under the same conditions. Error bars indicated standard errors of results from n = 3 replicates
Fig. 5
Fig. 5
Sp1418 expression level differences between the wild-type and engineered strains. To determine the expression levels of S. pogona and S. pogona-Sp1418, Western blotting was performed, and the results showed that Sp1418 was 3.11-fold higher in S. pogona-Sp1418 than in S. pogona
Fig. 6
Fig. 6
The insecticidal activity against H. armigera. After 2 days, the survival rate of H. armigera showed a significant decrease, which represents that the fermentation of S. pogona-Sp1418 exhibited a stronger toxin to H. armigera than that of the wild-type strain, while S. pogonasp1418 showed weak insecticidal activity. Error bars indicated standard errors of results from n = 3 replicates
Fig. 7
Fig. 7
Regulatory network schematic diagram of the sp1418 gene in S. pogona. Blue rectangle: downregulated protein in S. pogona-Sp1418, red rectangle: upregulated protein in S. pogona-Sp1418; green rectangle: transcriptionally downregulated genes in S. pogona-Sp1418, yellow rectangle: transcriptionally upregulated genes in S. pogona-Sp1418. The upregulation of the sp1418 gene affected KatE, RpoC, and InfB, which regulate the redox balance and maintain cell growth, avoiding the effects of oxidative stress on cells. The downregulation of the groEL gene could reduce RNA degradation and maintain RNA stability. SerA converts 3-phosphoglycerate to 3-phosphonooxypyruvate, and PaaZ promotes the synthesis of acetyl-CoA, the upregulation of which could generate more precursors for butenyl-spinosyn biosynthesis, and the upregulation of bus genes promoted biosynthesis. Coproporphyrinogen III oxidase and haem oxygenase are related to secondary metabolism, the downregulation of which could provide additional raw materials for butenyl-spinosyn biosynthesis. The expression change in genes involved in sporulation revealed differences in phenotypes and is also associated with primary and secondary metabolism

Similar articles

Cited by

References

    1. Lucas X, Senger C, Erxleben A, Gruning BA, Doring K, Mosch J, et al. StreptomeDB: a resource for natural compounds isolated from Streptomyces species. Nucleic Acids Res. 2013;41(Database issue):D1130–D1136. doi: 10.1093/nar/gks1253. - DOI - PMC - PubMed
    1. Newman DJ, Cragg GM. Natural products as sources of new drugs from 1981 to 2014. J Nat Prod. 2016;79(3):629–661. doi: 10.1021/acs.jnatprod.5b01055. - DOI - PubMed
    1. Scherlach K, Hertweck C. Triggering cryptic natural product biosynthesis in microorganisms. Org Biomol Chem. 2009;7(9):1753–1760. doi: 10.1039/b821578b. - DOI - PubMed
    1. Hahn DR, Gustafson G, Waldron C, Bullard B, Jackson JD, Mitchell J. Butenyl-spinosyns, a natural example of genetic engineering of antibiotic biosynthetic genes. J Ind Microbiol Biotechnol. 2005;33(2):94–104. doi: 10.1007/s10295-005-0016-9. - DOI - PubMed
    1. Jha AK, Pokhrel AR, Chaudhary AK, Park SW, Cho WJ, Sohng JK. Metabolic engineering of rational screened Saccharopolyspora spinosa for the enhancement of spinosyns A and D production. Mol Cells. 2014;37(10):727–733. - PMC - PubMed

MeSH terms

Substances

Supplementary concepts

LinkOut - more resources