. 2020 Feb 11;17(1):17.
doi: 10.1186/s12984-020-0649-y.

The effect of tactile augmentation on manipulation and grip force control during force-field adaptation

Affiliations

The effect of tactile augmentation on manipulation and grip force control during force-field adaptation

Chen Avraham et al. J Neuroeng Rehabil. .

Abstract

Background: When exposed to a novel dynamic perturbation, participants adapt by changing their movements' dynamics. This adaptation is achieved by constructing an internal representation of the perturbation, which allows for applying forces that compensate for the novel external conditions. To form an internal representation, the sensorimotor system gathers and integrates sensory inputs, including kinesthetic and tactile information about the external load. The relative contribution of the kinesthetic and tactile information in force-field adaptation is poorly understood.

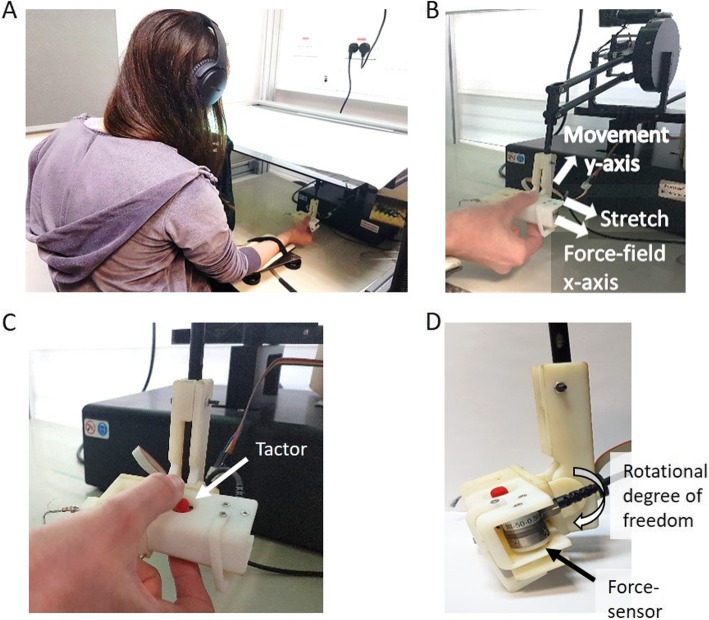
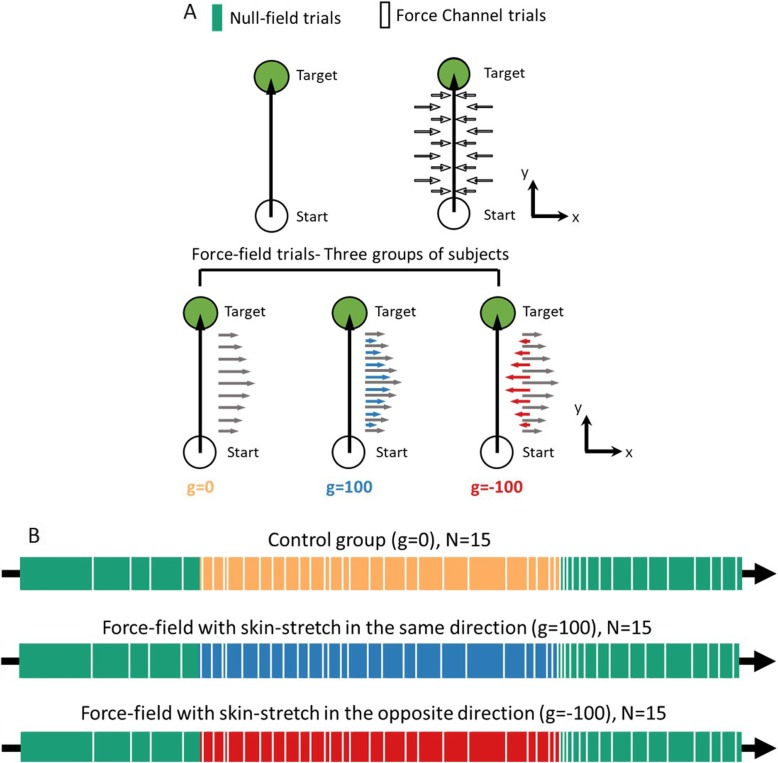
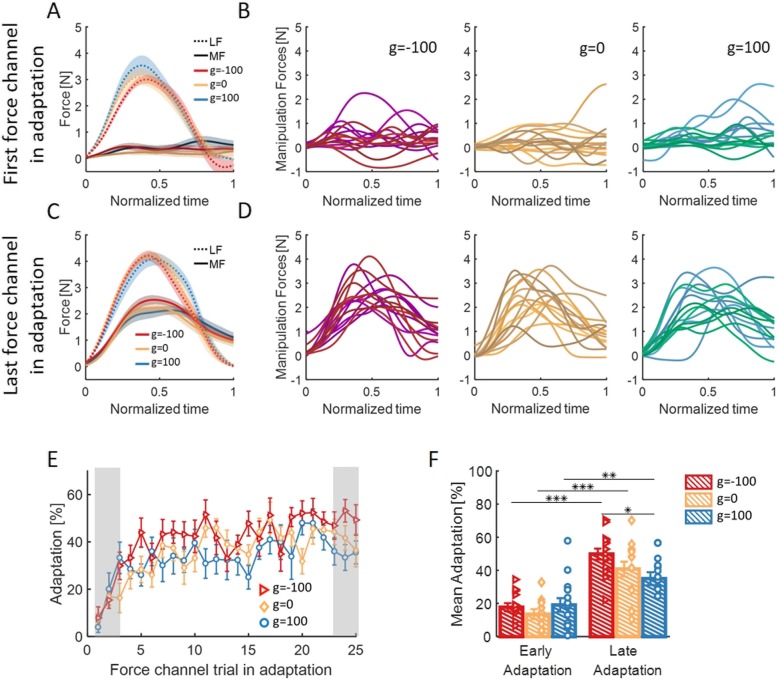
Methods: In this study, we set out to establish the effect of augmented tactile information on adaptation to force-field. Two groups of participants received a velocity-dependent tangential skin deformation from a custom-built skin-stretch device together with a velocity-dependent force-field from a kinesthetic haptic device. One group experienced a skin deformation in the same direction of the force, and the other in the opposite direction. A third group received only the velocity-dependent force-field.

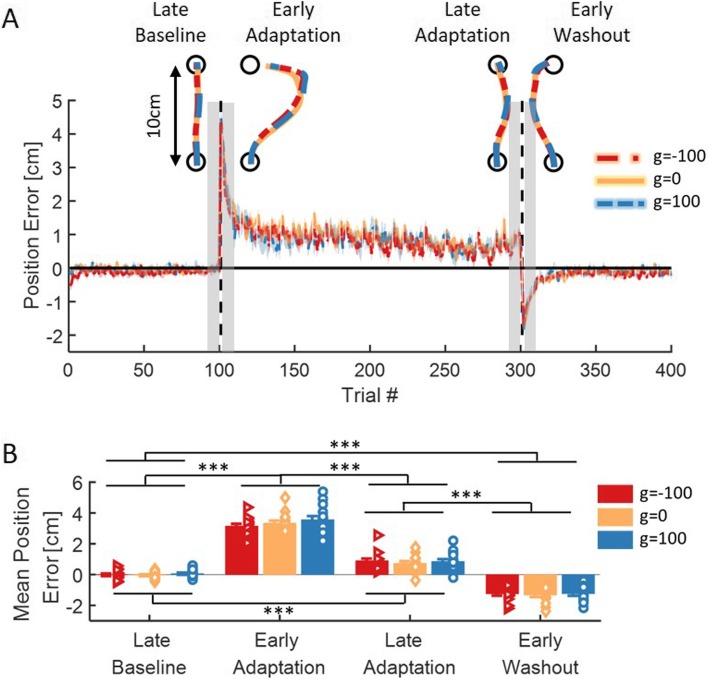
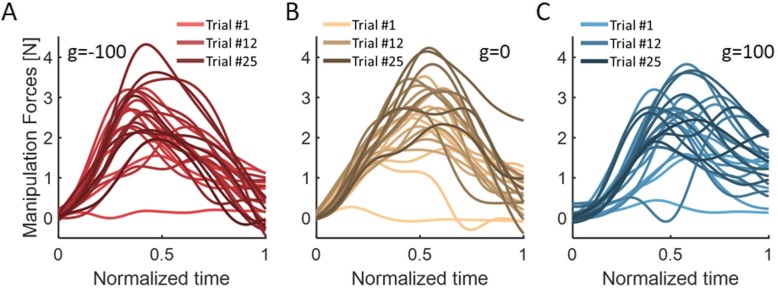
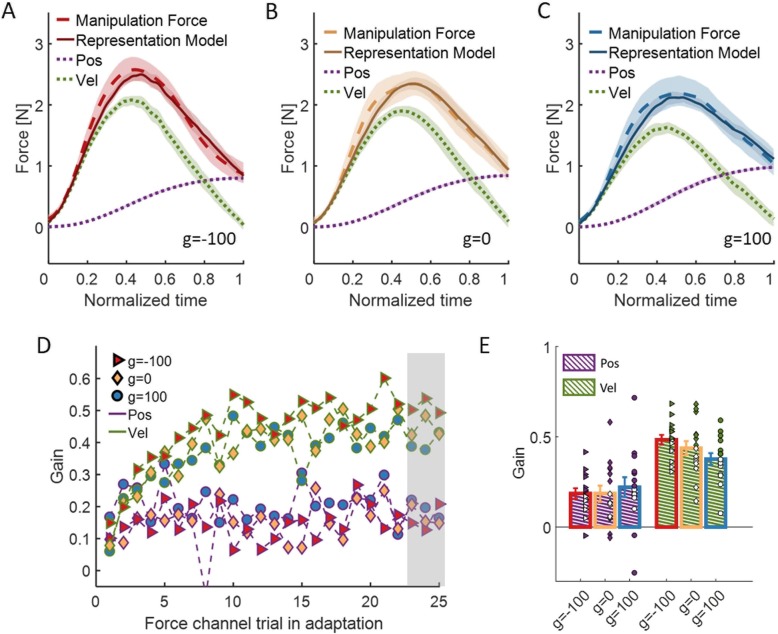
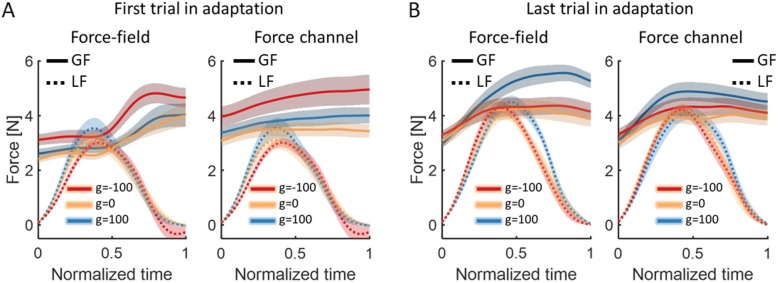
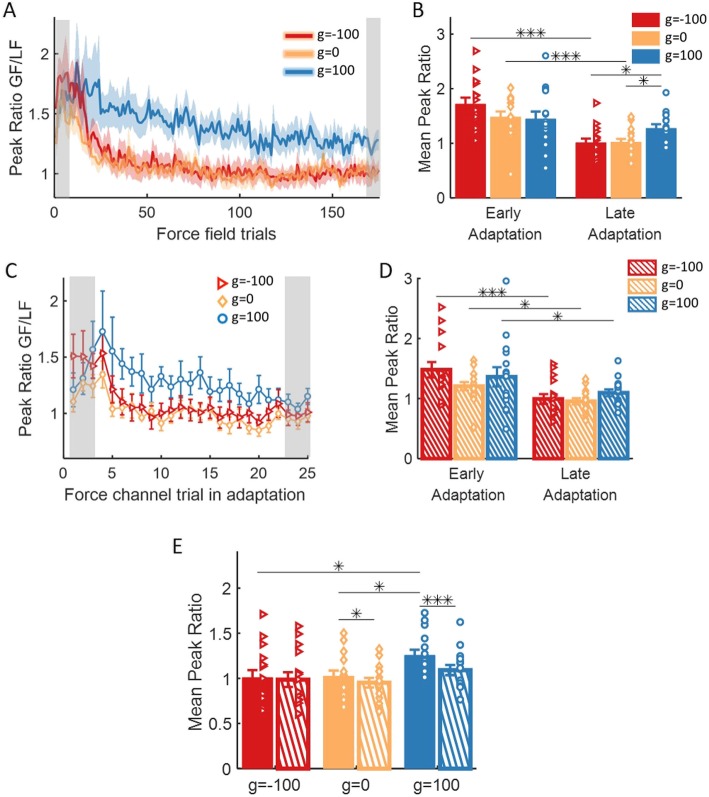
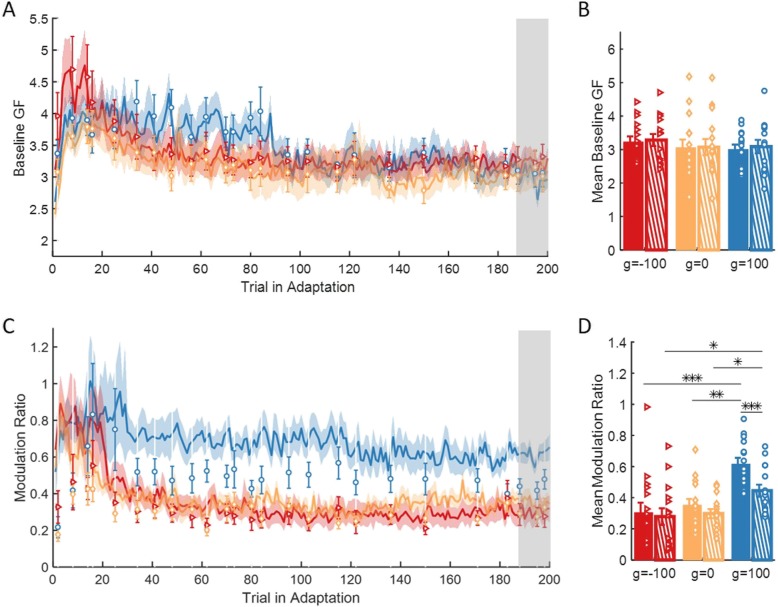
Results: We found that adding a skin deformation did not affect the kinematics of the movement during adaptation. However, participants who received skin deformation in the opposite direction adapted their manipulation forces faster and to a greater extent than those who received skin deformation in the same direction of the force. In addition, we found that skin deformation in the same direction to the force-field caused an increase in the applied grip-force per amount of load force, both in response and in anticipation of the stretch, compared to the other two groups.

Conclusions: Augmented tactile information affects the internal representations for the control of manipulation and grip forces, and these internal representations are likely updated via distinct mechanisms. We discuss the implications of these results for assistive and rehabilitation devices.

Keywords: Force-field adaptation; Grip force control; Manipulation force control; Sensory augmentation; Skin-stretch.


Conflict of interest statement

The authors declare that they have no competing interests.

Figures

Fig. 1
Fig. 1
Experimental setup. a The participants were seated in front of a screen, while holding the skin-stretch device. Participants’ arm was attached to an air-sled wrist supporter, and they wore noise-cancelling headphones. b The skin-stretch device was attached to a haptic device that was used to apply the force-field and to record position, velocity and forces. Desired movement direction was in the frontal, y-axis, away from the body of the participant and in the horizontal plane, and the force-filed and skin-stretch were applied in lateral, x-axis. c Participants’ thumb and index finger were located on the moving tactors (red pins with high-friction surface) that stretched the skin of the finger pad. d A force sensor was used to record the grip force that was applied on the skin-stretch device. In addition, we added a rotational degree of freedom in the connection between the skin-stretch device and the haptic device, such that throughout the movement the stretch will be applied in a perpendicular direction to the desired movement direction
Fig. 2
Fig. 2
Experimental protocol. a In each trial, participants were required to make a reaching movement: move a cursor from a start position (white circle) toward a target (green circle). During null-field trials, no force-field was presented. In force channel trials, participants’ movement was constrained to straight trajectory by using virtual walls. In force-field trials, a velocity-dependent force was applied, perpendicular to movement direction from start to target. Here, we had three conditions: (1) g = 0 – control group (yellow) with only force-field, (2) g = 100 – force-field with skin-stretch in the same direction (blue), and (3) g = − 100 – force-field in one direction and skin-stretch in the opposite direction (red). b The experiment was divided into three sessions: Baseline (green bar), Adaptation (yellow/blue/red bar), and Washout (green bar). During the Baseline and Washout sessions, null-field trials were presented. During the Adaptation session, we presented force-field trials with and without augmented tactile information. Throughout the experiment, in randomly selected trial we applied force channel trials (white bar, see Methods for details)
Fig. 3
Fig. 3
Position error - maximum deviation in the axis perpendicular to the desired movement direction (x-axis). a Mean position error and SE (shaded region) for the three groups of g = − 100 (red), g = 0 (yellow), and g = 100 (blue). Dashed black lines represents the different sessions of Baseline, Adaptation and Washout. For each stage in the experiment (Late Baseline- LB, Early Adaptation- EA, Late Adaptation- LA, Early Washout- EW), a typical trajectory is presented. Shaded gray regions indicate the trials that were used for the statistical analysis. b Mean positional error over three movements in each stage of LB, EA, LA, and EW. Colors are as in (a). Error bars represent ±SE, and the dots represent the data from each participant. ***p < 0.001
Fig. 4
Fig. 4
Manipulation forces from all force channel trials in the Adaptation session from a typical participant in each group of a g = − 100, b g = 0, and c g = 100. Colors are changing from light to dark as adaptation progresses
Fig. 5
Fig. 5
The effect of adaptation on the manipulation forces. a Mean signals of the manipulation forces (MF, solid line) applied in the first force channel in the adaptation session, and the load forces (LF, dashed line) from the previous trial, for the three groups of g = − 100 (red), g = 0 (yellow), and g = 100 (blue). Shaded regions represent ±SE. b Manipulation forces for each participant in the first force channel in Adaptation. The signals are presented for each group separately, from left to right: g = − 100, g = 0, and g = 100. c and d are similar to (a) and (b) for the last force channel in the adaptation session. e Adaptation percentage measured by the regression coefficient between the manipulation forces in a force channel trial and the load forces from the preceding trial. Colors are as in (a), and error bars represents ±SE. Shaded gray regions indicate the trials that were used for the statistical analysis. f Mean and ± SE of adaptation percentage in the two stages of Adaptation: Early – 3 first force channel trials in Adaptation, and Late – 3 last force channels in Adaptation. Colors are as in (a), and the dots represents the data from each participant. *p < 0.05, **p < 0.01, ***p < 0.001
Fig. 6
Fig. 6
Representation analysis. a The actual manipulation forces (dashed red) and model (solid red) for the group with skin-stretch in the opposite direction to the force-field (g = − 100). The motor primitives that were used for modeling the manipulation force are position (dashed purple), and velocity (dashed green). b and c are as in (a) for the control group (g = 0, yellow) and the group with skin-stretch in the same direction as the force-field (g = 100, blue), respectively. d The mean gain across participants of the position (purple) and velocity (green) primitive that was required in order to model the manipulation forces in every force channel trial in Adaptation. The results are presented for the three group of g = − 100 (red triangle) and g = 0 (yellow diamond), and g = 100 (blue circle). Shaded gray region indicates the trials that were used for the representation and statistical analysis. e Mean and ± SE over the three last force channel trials in Adaptation for each motor primitive in every group. Colors are as in (d), and the dots represents the data from each participant
Fig. 7
Fig. 7
The effect of adaptation on the grip forces. a Mean signals across participants of the grip forces (GF, solid line) and the load forces (LF, dashed line) from the first force-field trial (left) and the first force channel trial (right) in Adaptation, for the three groups of g = − 100 (red), g = 0 (yellow), and g = 100 (blue). Shaded regions represent ±SE. b Same as (a) for the last force-field trial (left) and the last force channel trial (right) in Adaptation
Fig. 8
Fig. 8
The effect of adaptation on the ratio between maximum grip force and maximum load force. a Mean and ± SE peak ratio across participants in all force-field trials for the three groups of g = − 100 (red), g = 0 (yellow), and g = 100 (blue). Shaded gray regions indicate the trials that were used for the statistical analysis. b Mean and ± SE of peak ratio measure in the two stages of Adaptation: Early – 3 first force-field trials, and Late – 3 last force-field trials. The dots represents the data from each participant. *p < 0.05, **p < 0.01, ***p < 0.001. c and d are as in (a) and (b) for all force channel trials in Adaptation. e Mean and ± SE of the last three force channel trials (dashed bar) and all force-field trials that were performed between these force channel trials (solid bar). Colors are as in (a), and the dots represents the data from each participant. *p < 0.05, **p < 0.01, ***p < 0.001
Fig. 9
Fig. 9
The effect of adaptation on the baseline grip force and the modulation between grip force and load force. a Mean and ± SE across participants of baseline grip force for the three groups of g = − 100 (red), g = 0 (yellow), and g = 100 (blue). Solid lines and dashed regions are for force-field trials, and markers and error bars are for force channel trials. Shaded gray regions indicate the trials that were used for the statistical analysis. b Mean and ± SE of the last three force channel trials (dashed bar) and all force-field trials that were performed between these force channel trials (solid bar). Colors are as in (a), and the dots represents the data from each participant. *p < 0.05, **p < 0.01, ***p < 0.001. c and d are as in (a) and (b) for the modulation between grip force and load force

Similar articles

Cited by

References

    1. Kandel ER, Schwartz JH, Jessell TM, Siegelbaum SA, Hudspeth AJ. Principles of neural science. New York: McGraw-hill; 2000.
    1. Kuschel M, Di Luca M, Buss M, Klatzky RL. Combination and integration in the perception of visual-haptic compliance information. IEEE Trans Haptics. 2010;3(4):234–244. doi: 10.1109/TOH.2010.9. - DOI - PubMed
    1. Leib R, Karniel A, Nisky I. The effect of force feedback delay on stiffness perception and grip force modulation during tool-mediated interaction with elastic force fields. J Neurophysiol. 2015;113(9):3076–3089. doi: 10.1152/jn.00229.2014. - DOI - PMC - PubMed
    1. Farajian M, Leib R, Zaidenberg T, Mussa-Ivaldi F, Nisky I. Stretching the skin of the fingertip creates a perceptual and motor illusion of touching a harder spring. bioRxiv. 2017:203604.
    1. Danion F, Sarlegna FR. Can the human brain predict the consequences of arm movement corrections when transporting an object? Hints from grip force adjustments. J Neurosci. 2007;27(47):12839–12843. doi: 10.1523/JNEUROSCI.3110-07.2007. - DOI - PMC - PubMed

Publication types

LinkOut - more resources