

Inhibitory components of retinal bipolar cell receptive fields are differentially modulated by dopamine D1 receptors
- PMID: 32046810
- PMCID: PMC7027730
- DOI: 10.1017/S0952523819000129
Inhibitory components of retinal bipolar cell receptive fields are differentially modulated by dopamine D1 receptors
Abstract
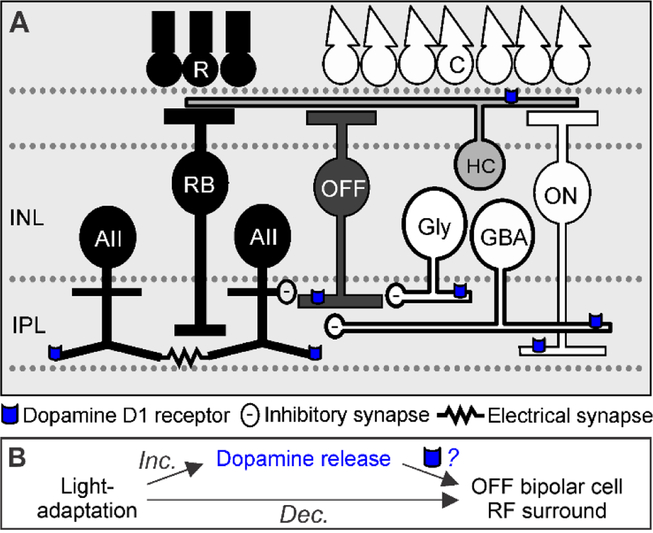
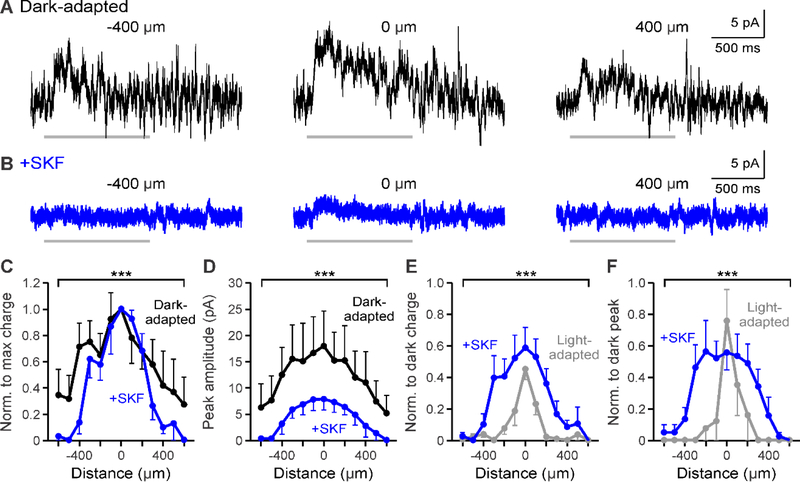
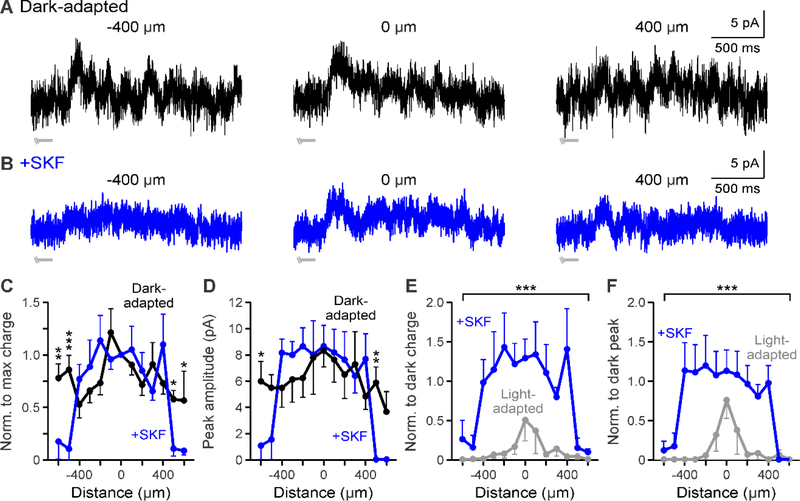
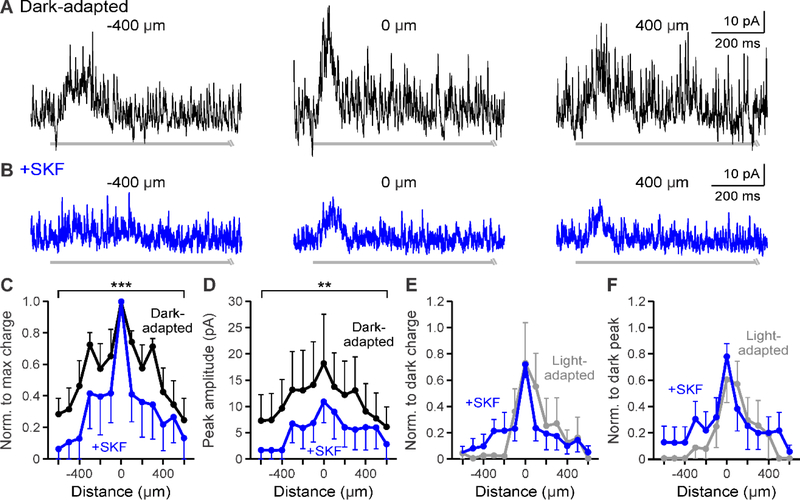
During adaptation to an increase in environmental luminance, retinal signaling adjustments are mediated by the neuromodulator dopamine. Retinal dopamine is released with light and can affect center-surround receptive fields, the coupling state between neurons, and inhibitory pathways through inhibitory receptors and neurotransmitter release. While the inhibitory receptive field surround of bipolar cells becomes narrower and weaker during light adaptation, it is unknown how dopamine affects bipolar cell surrounds. If dopamine and light have similar effects, it would suggest that dopamine could be a mechanism for light-adapted changes. We tested the hypothesis that dopamine D1 receptor activation is sufficient to elicit the magnitude of light-adapted reductions in inhibitory bipolar cell surrounds. Surrounds were measured from OFF bipolar cells in dark-adapted mouse retinas while stimulating D1 receptors, which are located on bipolar, horizontal, and inhibitory amacrine cells. The D1 agonist SKF-38393 narrowed and weakened OFF bipolar cell inhibitory receptive fields but not to the same extent as with light adaptation. However, the receptive field surround reductions differed between the glycinergic and GABAergic components of the receptive field. GABAergic inhibitory strength was reduced only at the edges of the surround, while glycinergic inhibitory strength was reduced across the whole receptive field. These results expand the role of retinal dopamine to include modulation of bipolar cell receptive field surrounds. Additionally, our results suggest that D1 receptor pathways may be a mechanism for the light-adapted weakening of glycinergic surround inputs and the furthest wide-field GABAergic inputs to bipolar cells. However, remaining differences between light-adapted and D1 receptor-activated inhibition demonstrate that non-D1 receptor mechanisms are necessary to elicit the full effect of light adaptation on inhibitory surrounds.
Keywords: Amacrine cell; Bipolar cell; GABA; Glycine; Luminance.
Conflict of interest statement
Disclosures: The authors declare no conflicts of interest regarding the present study.
Figures
Similar articles
-
Dopamine D1 receptor activation reduces local inner retinal inhibition to light-adapted levels.J Neurophysiol. 2019 Apr 1;121(4):1232-1243. doi: 10.1152/jn.00448.2018. Epub 2019 Feb 6. J Neurophysiol. 2019. PMID: 30726156 Free PMC article.
-
Light adaptation alters inner retinal inhibition to shape OFF retinal pathway signaling.J Neurophysiol. 2016 Jun 1;115(6):2761-78. doi: 10.1152/jn.00948.2015. Epub 2016 Feb 24. J Neurophysiol. 2016. PMID: 26912599 Free PMC article.
-
Dopamine D1 receptor activation contributes to light-adapted changes in retinal inhibition to rod bipolar cells.J Neurophysiol. 2018 Aug 1;120(2):867-879. doi: 10.1152/jn.00855.2017. Epub 2018 May 30. J Neurophysiol. 2018. PMID: 29847232 Free PMC article.
-
Dopamine modulation of rod pathway signaling by suppression of GABAC feedback to rod-driven depolarizing bipolar cells.Eur J Neurosci. 2015 Sep;42(6):2258-70. doi: 10.1111/ejn.12993. Epub 2015 Jul 22. Eur J Neurosci. 2015. PMID: 26080286
-
Dopamine Regulation of GABAA Receptors Contributes to Light/Dark Modulation of the ON-Cone Bipolar Cell Receptive Field Surround in the Retina.Curr Biol. 2017 Sep 11;27(17):2600-2609.e4. doi: 10.1016/j.cub.2017.07.063. Epub 2017 Aug 24. Curr Biol. 2017. PMID: 28844643 Free PMC article.
Cited by
-
Center-surround interactions underlie bipolar cell motion sensitivity in the mouse retina.Nat Commun. 2022 Sep 26;13(1):5574. doi: 10.1038/s41467-022-32762-7. Nat Commun. 2022. PMID: 36163124 Free PMC article.
-
The effects of reduced ambient lighting on lens compensation in infant rhesus monkeys.Vision Res. 2021 Oct;187:14-26. doi: 10.1016/j.visres.2021.05.010. Epub 2021 Jun 15. Vision Res. 2021. PMID: 34144362 Free PMC article.
-
High glucose treatment promotes extracellular matrix proteome remodeling in Mller glial cells.PeerJ. 2021 May 18;9:e11316. doi: 10.7717/peerj.11316. eCollection 2021. PeerJ. 2021. PMID: 34046254 Free PMC article.
-
Dopamine D1 and D4 receptors contribute to light adaptation in ON-sustained retinal ganglion cells.J Neurophysiol. 2021 Dec 1;126(6):2039-2052. doi: 10.1152/jn.00218.2021. Epub 2021 Nov 24. J Neurophysiol. 2021. PMID: 34817291 Free PMC article.
-
Glycine Release Is Potentiated by cAMP via EPAC2 and Ca2+ Stores in a Retinal Interneuron.J Neurosci. 2021 Nov 17;41(46):9503-9520. doi: 10.1523/JNEUROSCI.0670-21.2021. Epub 2021 Oct 7. J Neurosci. 2021. PMID: 34620721 Free PMC article.
References
-
- Applebury ML, Antoch MP, Baxter LC, Chun LL, Falk JD, Farhangfar F, Kage K, Krzystolik MG, Lyass LA & Robbins JT. (2000). The murine cone photoreceptor: a single cone type expresses both S and M opsins with retinal spatial patterning. Neuron 27, 513–523. - PubMed
-
- Bauer B, Ehinger B & Aberg L. (1980). [3H]-dopamine release from the rabbit retina. Albrecht Von Graefes Arch Klin Exp Ophthalmol 215, 71–78. - PubMed
-
- Bloomfield SA, Xin D & Osborne T. (1997). Light-induced modulation of coupling between AII amacrine cells in the rabbit retina. Vis Neurosci 14, 565–576. - PubMed
-
- Boatright JH, Hoel MJ & Iuvone PM. (1989). Stimulation of endogenous dopamine release and metabolism in amphibian retina by light- and K+-evoked depolarization. Brain Res 482, 164–168. - PubMed
Publication types
MeSH terms
Substances
Grants and funding
LinkOut - more resources
Full Text Sources
