. 2020 Mar 11;7(2):ENEURO.0474-19.2020.
doi: 10.1523/ENEURO.0474-19.2020. Print 2020 Mar/Apr.

Pericyte-Mediated Tissue Repair through PDGFRβ Promotes Peri-Infarct Astrogliosis, Oligodendrogenesis, and Functional Recovery after Acute Ischemic Stroke

Affiliations

Pericyte-Mediated Tissue Repair through PDGFRβ Promotes Peri-Infarct Astrogliosis, Oligodendrogenesis, and Functional Recovery after Acute Ischemic Stroke

Tomoya Shibahara et al. eNeuro. .

Abstract

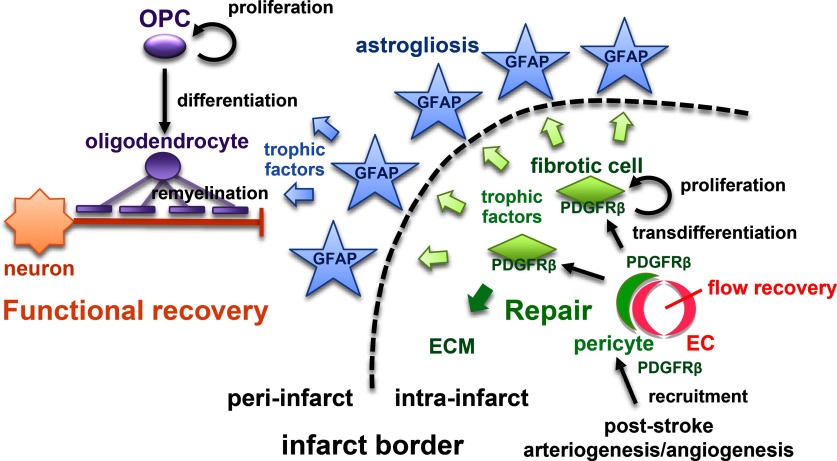
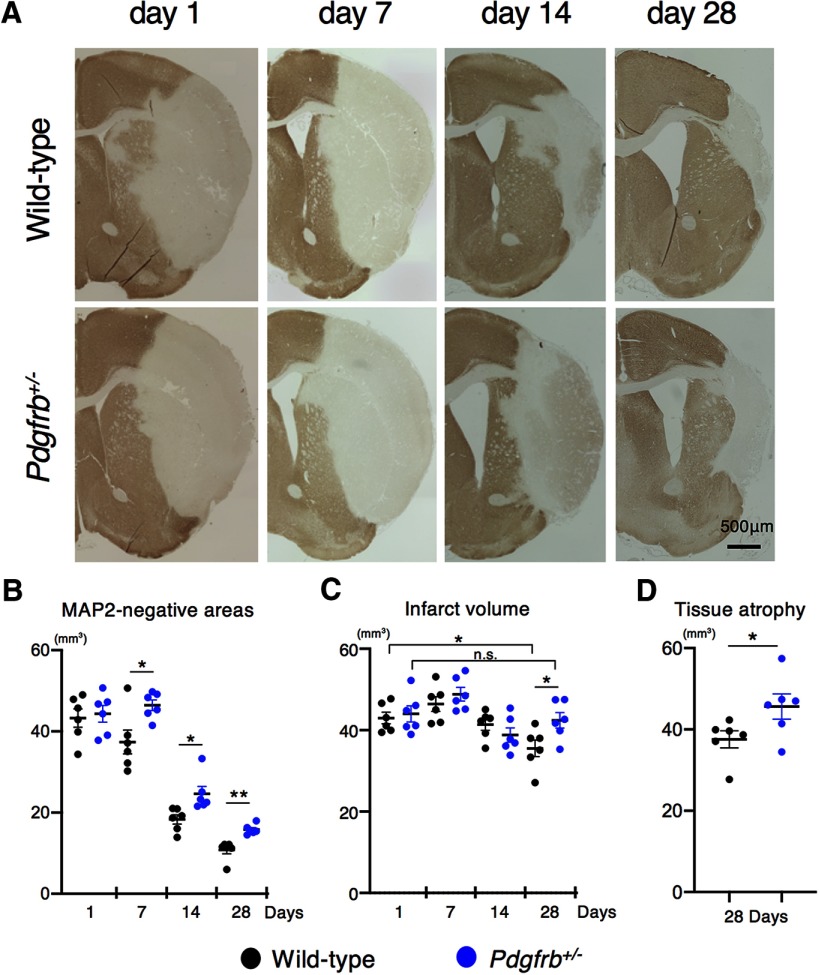
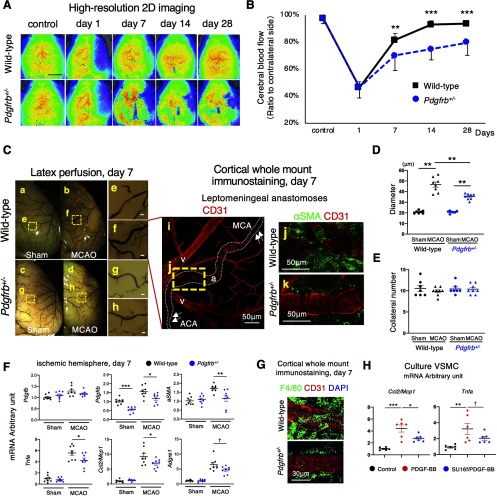
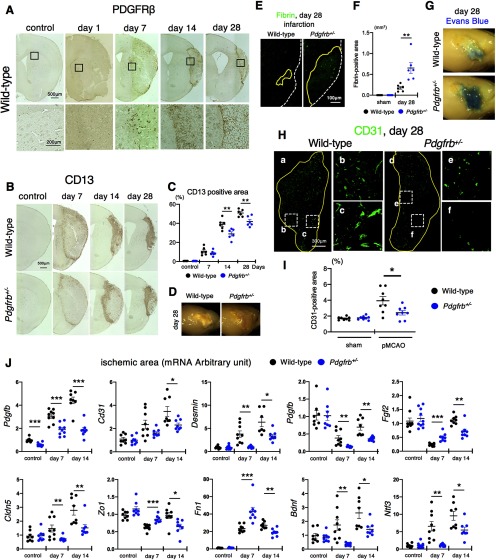
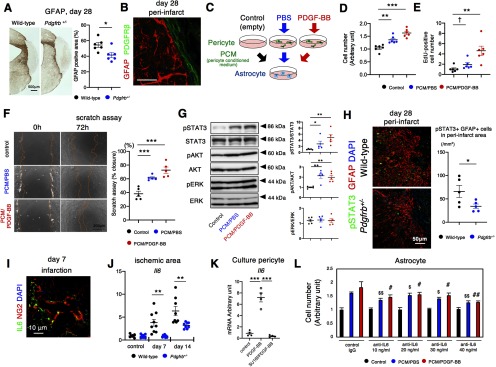
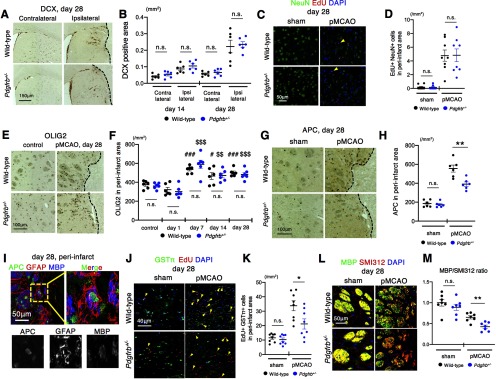
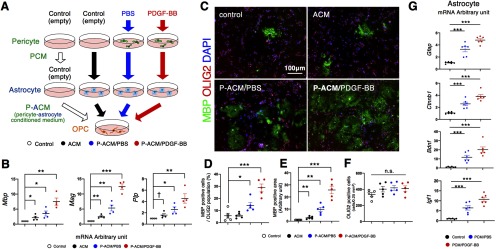
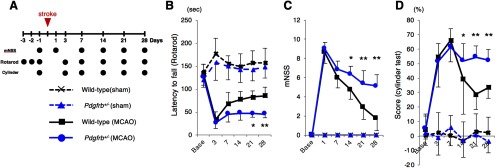
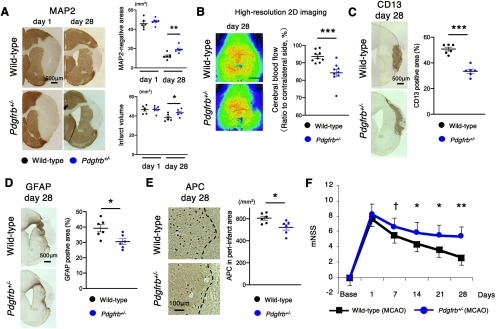
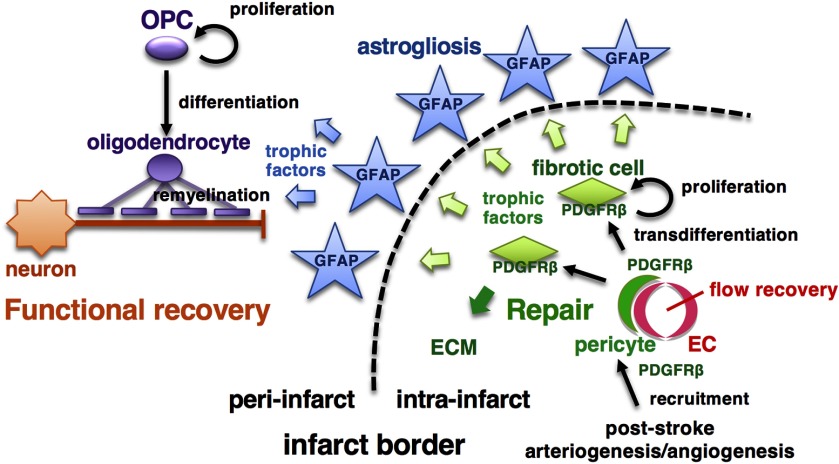
Post-stroke functional recovery can occur spontaneously during the subacute phase; however, how post-stroke fibrotic repair affects functional recovery is highly debated. Platelet-derived growth factor receptor β (PDGFRβ)-expressing pericytes are responsible for post-stroke fibrotic repair within infarct areas; therefore, we examined peri-infarct neural reorganization and functional recovery after permanent middle cerebral artery occlusion (pMCAO) using pericyte-deficient Pdgfrb+/- mice. Time-dependent reduction of infarct area sizes, i.e., repair, was significantly impaired in Pdgfrb+/- mice with recovery of cerebral blood flow (CBF) in ischemic areas attenuated by defective leptomeningeal arteriogenesis and intrainfarct angiogenesis. Peri-infarct astrogliosis, accompanied by increased STAT3 phosphorylation, was attenuated in Pdgfrb+/- mice. Pericyte-conditioned medium (PCM), particularly when treated with platelet-derived growth factor subunit B (PDGFB) homodimer (PDGF-BB; PCM/PDGF-BB), activated STAT3 and enhanced the proliferation and activity of cultured astrocytes. Although peri-infarct proliferation of oligodendrocyte (OL) precursor cells (OPCs) was induced promptly after pMCAO regardless of intrainfarct repair, OPC differentiation and remyelination were significantly attenuated in Pdgfrb+/- mice. Consistently, astrocyte-CM (ACM) promoted OPC differentiation and myelination, which were enhanced remarkably by adding PCM/PDGF-BB to the medium. Post-stroke functional recovery correlated well with the extent and process of intrainfarct repair and peri-infarct oligodendrogenesis. Overall, pericyte-mediated intrainfarct fibrotic repair through PDGFRβ may promote functional recovery through enhancement of peri-infarct oligodendrogenesis as well as astrogliosis after acute ischemic stroke.

Keywords: astrocyte; neurorestoration; oligodendrogenesis; pericyte; platelet-derived growth factor receptor β; repair.


Figures

None
Graphical abstract
Figure 1.
Figure 1.
Reduction of MAP2-negative areas and infarct volume in the subacute phase is attenuated in Pdgfrb+/– mice. A, MAP2 staining on days 1, 7, 14, and 28 after pMCAO in wild-type and Pdgfrb+/– mice (scale bar, 500 μm). B, Quantification of MAP2-negative areas on days 1, 7, 14, and 28 after pMCAO (n = 6, each group). C, Quantification of infarct volume on days 1, 7, 14, and 28 after pMCAO (n = 6, each group). D, Quantification of tissue atrophy on day 28 after pMCAO (n = 6, each group). Data are shown as the mean ± SEM. B, D, *p < 0.05 and **p < 0.01, unpaired t test. C, *p < 0.05, one-way ANOVA followed by Bonferroni’s post hoc test. n.s.: not significant.
Figure 2.
Figure 2.
Leptomeningeal arteriogenesis and recovery of CBF in ischemic areas after pMCAO are attenuated in Pdgfrb+/– mice. A, Images of CBF just under the cortical surface, as assessed by laser speckle flowmetry, in control and on days 1, 7, 14, and 28 after pMCAO in wild-type and Pdgfrb+/– mice (scale bar, 2 mm). B, Temporal profiles of CBF quantification on days 1, 7, 14, and 28 after pMCAO (n = 12, each group). C, Macroscopic images of leptomeningeal anastomoses, assessed by a latex perfusion method, at baseline (a, c) and on day 7 (b, d) after pMCAO in wild-type and Pdgfrb+/– mice (scale bar, 50 μm). Arrowheads indicate the leptomeningeal anastomoses vessels (b, d). Magnified images of the dotted squares (eh) in ad are shown in the right panels. Cortical whole mount immunostaining of leptomeningeal anastomoses with CD31 (red) on day 7 after pMCAO is shown in i (a: artery, v: vein). Arrows indicate the pre-existing ACA and MCA. The magnified image of the yellow dotted square (j) is shown in the right panel. Double immunofluorescence labeling with CD31 (red) and αSMA (green) in anastomosed vessels on day 7 after pMCAO in wild-type (j) and Pdgfrb+/– mice (k) is shown (scale bar, 50 μm). D, Diameter of anastomotic vessels at baseline and on day 7 after pMCAO (baseline, n = 7 each group; pMCAO, n = 8 each group). E, Number of anastomotic vessels at baseline and on day 7 after pMCAO (baseline, n = 7 each group; pMCAO, n = 8 each group). F, mRNA levels of arteriogenesis-related genes in non-infarct hemisphere and ischemic hemisphere on day 7 (n = 8, each group). G, Cortical whole mount immunostaining with CD31 (red), F4/80 (green), and DAPI (blue) in wild-type and Pdgfrb+/– mice (scale bar, 50 μm). H, Quantitative PCR for Ccl2/Mcp1 and Tnfa in cultured VSMCs at baseline (black), with PDGF-BB (10 ng/ml; red), and with SU16f-pretreated PDGF-BB (100 nmol/l; blue; n = 6, each group). Data are shown as the mean ± SEM. B, F, p < 0.1, *p < 0.05, **p < 0.01, and ***p < 0.001, unpaired t test. DE, H, p < 0.1, *p < 0.05, **p < 0.01, and ***p < 0.001, one-way ANOVA followed by Bonferroni’s post hoc test.
Figure 3.
Figure 3.
PDGFRβ is important for intrainfarct angiogenesis and fibrosis. A, Immunohistochemistry of PDGFRβ at baseline and on days 1, 7, 14, and 28 after pMCAO (scale bar, 500 μm). Magnified images in the squares are shown at the bottom. B, Immunohistochemistry of CD13, a marker of pericyte and pericyte-derived cells, in control and on days 7, 14, and 28 after pMCAO (scale bar, 500 μm). C, Quantification of CD13-positive areas in control and on days 7, 14, and 28 after pMCAO in wild-type and Pdgfrb+/– mice (n = 6, each group). D, Representative macroscopic observation of the brain surface on day 28 after pMCAO (n = 10). E, Fibrin staining on day 28 after pMCAO (scale bar, 100 μm). F, Quantification of fibrin-positive areas in mice on day 28 after pMCAO and in sham-operated mice (n = 6, each group). G, Representative macroscopic images of Evans blue dye leakage in the brain on day 28 after pMCAO (n = 6). H, Immunofluorescence labeling of CD31 on day 28 after pMCAO in wild-type (a) and Pdgfrb+/– mice (d; scale bar, 300 μm). Magnified images in the dotted squares (b, c, e, f) are shown to the right. I, Quantification of intrainfarct CD31 density in mice on day 28 after pMCAO and in sham-operated mice (n = 8, each group). J, Quantitative PCR of genes expressed in non-infarct control and within infarct areas on days 7 and 14 after pMCAO in wild-type (black) and Pdgfrb+/– mice (blue; n = 8, each group). Data are shown as the mean ± SEM. C, F, I, *p < 0.05, and **p < 0.01, unpaired t test. J, *p < 0.05, **p < 0.01, and ***p < 0.001, one-way ANOVA followed by Bonferroni’s post hoc test.
Figure 4.
Figure 4.
Pericyte-astrocyte interaction in peri-infarct areas after pMCAO. A, Immunohistochemistry for GFAP (scale bar, 500 μm) and quantification of GFAP-positive areas on day 28 after pMCAO in wild-type and Pdgfrb+/– mice (n = 6, each group). B, Double immunofluorescence labeling of GFAP (red) and PDGFRβ (green; scale bar, 20 μm) on day 28 after pMCAO. PDGFRβ-positive fibrotic lesion and GFAP-positive astrogliosis form a clear boundary. C, Experimental scheme for phenotypic changes induced in astrocytes by pericyte culture medium (black, control), PCM treated with PBS (blue, PCM/PBS) or PDGF-BB (10 ng/ml; red, PCM/PDGF-BB). D, MTT assay for astrocytes after treatment with PCM for 24 h (n = 6, each group). E, Astrocyte proliferation assay as assessed by immunofluorescence of EdU after treatment with PCM for 24 h (n = 6, each group). F, Astrocyte scratch assay after treatment with PCM for 72 h (scale bar, 200 μm; left). Quantification of wound recovery (n = 5, each group). G, Immunoblot analyses of STAT3 and phospho-STAT3, AKT and phospho-AKT, and ERK and phospho-ERK in astrocytes after treatment with CM for 30 min (n = 5, each group). H, Representative immunofluorescence labeling for pSTAT3 (green) and GFAP (red), and DAPI (blue) in the peri-infarct area after pMCAO in wild-type and Pdgfrb+/– mice on day 28 (scale bar, 50 μm). Quantification of the number of pSTAT3 and GFAP double-positive cells are evaluated (n = 5, each group). I, Double immunofluorescence labeling of NG2 (red) and IL6 (green; scale bar, 10 μm) on day 7 after pMCAO. J, Quantitative PCR of Il6 expression in non-infarct hemisphere and within infarct areas on days 7 and 14 after pMCAO in wild-type (black) and Pdgfrb+/– mice (blue; n = 8, each group). K, Expression change of Il6 in pericytes treated with PDGF-BB in the presence or absence of SU16f (n = 4, each group). L, MTT assay for astrocytes treated with PCM in the presence of anti-IL6 antibody (10–40 ng/ml; n = 6, each group). Data are shown as the mean ± SEM. A, H, J, *p < 0.05, and **p < 0.01, unpaired t test. DG, K, L, p < 0.1, *p < 0.05, **p < 0.01, and ***p < 0.001; $p < 0.05 and $$p < 0.01 versus control IgG with PCM/PBS; and #p < 0.05 and ##p < 0.01 versus control IgG with PCM/PDGF-BB, one-way ANOVA followed by Bonferroni’s post hoc test.
Figure 5.
Figure 5.
Peri-infarct oligodendrogenesis but not neurogenesis is attenuated in Pdgfrb+/– mice. A, Immunohistochemistry for DCX in the SVZ and striatum on day 28 after pMCAO in wild-type and Pdgfrb+/– mice (scale bar, 150 μm). B, Quantification of the DCX-positive areas in the ipsilateral and contralateral hemisphere on days 14 and 28 after pMCAO in wild-type (black) and Pdgfrb+/– mice (blue; n = 6, each group). C, Double immunofluorescence labeling of NeuN (green) and EdU (red) in the peri-infarct areas on day 28 after pMCAO and in sham-operated mice. Arrowheads indicate NeuN and EdU double-positive newborn mature neurons (scale bar, 50 μm). D, Quantification of the number of double-positive cells in peri-infarct areas on day 28 after pMCAO and in sham-operated mice (n = 8, each group). E, Immunohistochemistry for OLIG2 in sham-operated mice and in peri-infarct areas on day 28 after pMCAO in wild-type and Pdgfrb+/– mice (scale bar, 100 μm). F, Quantification of the number of OLIG2-positive cells in peri-infarct areas on days 1, 7, 14, and 28 after pMCAO in wild-type (black) and Pdgfrb+/– mice (blue; n = 6, each group). G, Immunohistochemistry for APC in sham-operated mice and in peri-infarct areas on day 28 after pMCAO (scale bar, 100 μm). H, Quantification of the number of APC-positive cells in peri-infarct areas on day 28 after pMCAO (n = 6, each group). I, Triple immunofluorescence labeling with APC (green), GFAP (red) and MBP (blue) in peri-infarct areas (striatum) on day 28 after pMCAO. Magnified images of the dotted square are shown below and in the right panel (scale bar, 50 μm). J, Double immunofluorescence labeling of GSTπ (green) and EdU (red) in sham-operated mice and in the peri-infarct areas on day 28 after pMCAO. Arrowheads indicate GSTπ and EdU double-positive newborn mature OLs (scale bar, 40 μm). K, Quantification of the number of double-positive cells in peri-infarct areas on day 28 after pMCAO (n = 8, each group). L, Double immunofluorescence labeling of MBP (green) and the pan-axonal neurofilament marker, SMI312 (red), in sham-operated mice and in peri-infarct striatum on day 28 after pMCAO (scale bar, 50 μm). M, Quantification of MBP/SMI312 ratio in the peri-infarct striatum on day 28 after pMCAO (n = 7, each group). Data are shown as the mean ± SEM. B, D, H, K, M, *p < 0.05 and **p < 0.01, unpaired t test. F, #p < 0.05 and ###p < 0.001 vs. control wild-type mice, $$p < 0.01 and $$$p < 0.001 vs. control Pdgfrb+/– mice, one-way ANOVA followed by Bonferroni’s post-hoc test. n.s.: not significant.
Figure 6.
Figure 6.
Astrocytes stimulated with PCM promote differentiation and myelination. A, An experimental scheme for OPC differentiation in normal culture medium (control) or in astrocyte culture CM pretreated with empty pericyte medium, PCM/PBS, or PCM/PDGF-BB. B, Quantitative PCR of Mbp, Mag, and Plp in OPCs stimulated with CM for 5 d (n = 4, each group). C, Double immunofluorescence labeling of MBP (green) and OLIG2 (red) in cultured OPCs treated with ACM for 7 d (n = 5, each group; scale bar, 100 μm). D–F, Quantification of the number of MBP-positive cells among OLIG2-positive cells (D), MBP-positive areas (E), and OLIG2-positive cells (F). G, Quantitative PCR for Gfap, Ctnnb1, Bdnf, and Igf1 in astrocytes treated with PCM for 24 h (n = 6, each group). Data are shown as the mean ± SEM. B, D–G, p < 0.1, *p < 0.05, **p < 0.01, and ***p < 0.001, one-way ANOVA followed by Bonferroni’s post hoc test. n.s.: not significant.
Figure 7.
Figure 7.
Functional recovery after pMCAO was attenuated in Pdgfrb+/– mice. A, Experimental schedule for neurological assessment. Neurological function was assessed by (B) rotarod test, (C) mNSS test, and (D) cylinder test at baseline and days 1, 3, 7, 14, 21, and 28 after pMCAO in wild-type (black) and Pdgfrb+/– mice (blue). Data are shown as the mean ± SEM (n = 8, each group, *p < 0.05, and **p < 0.01, unpaired t test).
Figure 8.
Figure 8.
Post-stroke phenotypic changes in female Pdgfrb+/– mice. A, MAP2 staining on days 1 and 28 after pMCAO in female wild-type and Pdgfrb+/– mice (scale bar, 500 μm). Quantification of MAP2-negative areas and infarct volume (n = 6, each group). Data are shown as the mean ± SEM (*p < 0.05 and **p < 0.01, unpaired t test). B, Representative laser speckle images of CBF after pMCAO in female wild-type and Pdgfrb+/– mice on day 28 (n = 9, each group). Scale bar, 2 mm. Data represent the mean ± SEM (***p < 0.001, unpaired t test). C, Representative CD13 staining (scale bar, 500 μm) and quantification on day 28 after pMCAO in female wild-type and Pdgfrb+/– mice (n = 6, each group). Data are shown as the mean ± SEM (***p < 0.001, unpaired t test). D, Representative GFAP staining (scale bar, 500 μm) and quantification on day 28 after pMCAO in wild-type and Pdgfrb+/– female mice (n = 6, each group). Data are shown as the mean ± SEM (*p < 0.05, unpaired t test). E, Representative APC staining (scale bar, 100 μm) and quantification on day 28 after pMCAO in female wild-type and Pdgfrb+/– mice (n = 6, each group). Data are shown as the mean ± SEM (*p < 0.05, unpaired t test). F, Neurological scores in female mice after pMCAO (n = 9, each group). Data represent the mean ± SEM (p < 0.1, *p < 0.05, and **p < 0.01, unpaired t test).
Figure 9.
Figure 9.
Schematic diagram of pericyte-mediated tissue repair and functional recovery after pMCAO. Schematic diagram of this study. PDGFRβ signaling in vascular mural cells plays important roles in mediating post-stroke leptomeningeal arteriogenesis and intrainfarct angiogenesis leading to the recovery of CBF in ischemic areas. After recruitment around endothelial cell (EC) tubes, PDGFRβ-positive pericytes transdifferentiate into fibrotic cells, enhance tissue repair within infarct areas and astrogliosis in peri-infarct areas, and promote peri-infarct oligodendrogenesis (which together is OPC differentiation and myelination) leading to functional recovery. ECM, extracellular matrix.

Similar articles

Cited by

References

    1. Adams KL, Gallo V (2018) The diversity and disparity of the glial scar. Nat Neurosci 21:9–15. 10.1038/s41593-017-0033-9 - DOI - PMC - PubMed
    1. Anderson MA, Burda JE, Ren Y, Ao Y, O’Shea TM, Kawaguchi R, Coppola G, Khakh BS, Deming TJ, Sofroniew MV (2016) Astrocyte scar formation aids central nervous system axon regeneration. Nature 532:195–200. 10.1038/nature17623 - DOI - PMC - PubMed
    1. Arimura K, Ago T, Kamouchi M, Nakamura K, Ishitsuka K, Kuroda J, Sugimori H, Ooboshi H, Sasaki T, Kitazono T (2012) PDGF receptor β signaling in pericytes following ischemic brain injury. Curr Neurovasc Res 9:1–9. 10.2174/156720212799297100 - DOI - PubMed
    1. Armulik A, Abramsson A, Betsholtz C (2005) Endothelial/pericyte interactions. Circ Res 97:512–523. 10.1161/01.RES.0000182903.16652.d7 - DOI - PubMed
    1. Armulik A, Genové G, Betsholtz C (2011) Pericytes: Developmental, physiological, and pathological perspectives, problems, and promises. Dev Cell 21:193–215. 10.1016/j.devcel.2011.07.001 - DOI - PubMed

Publication types