. 2020 Apr;10(4):608-625.
doi: 10.1158/2159-8290.CD-19-0297. Epub 2020 Feb 11.

Oncogenic KRAS-Driven Metabolic Reprogramming in Pancreatic Cancer Cells Utilizes Cytokines from the Tumor Microenvironment

Affiliations

Oncogenic KRAS-Driven Metabolic Reprogramming in Pancreatic Cancer Cells Utilizes Cytokines from the Tumor Microenvironment

Prasenjit Dey et al. Cancer Discov. 2020 Apr.

Abstract

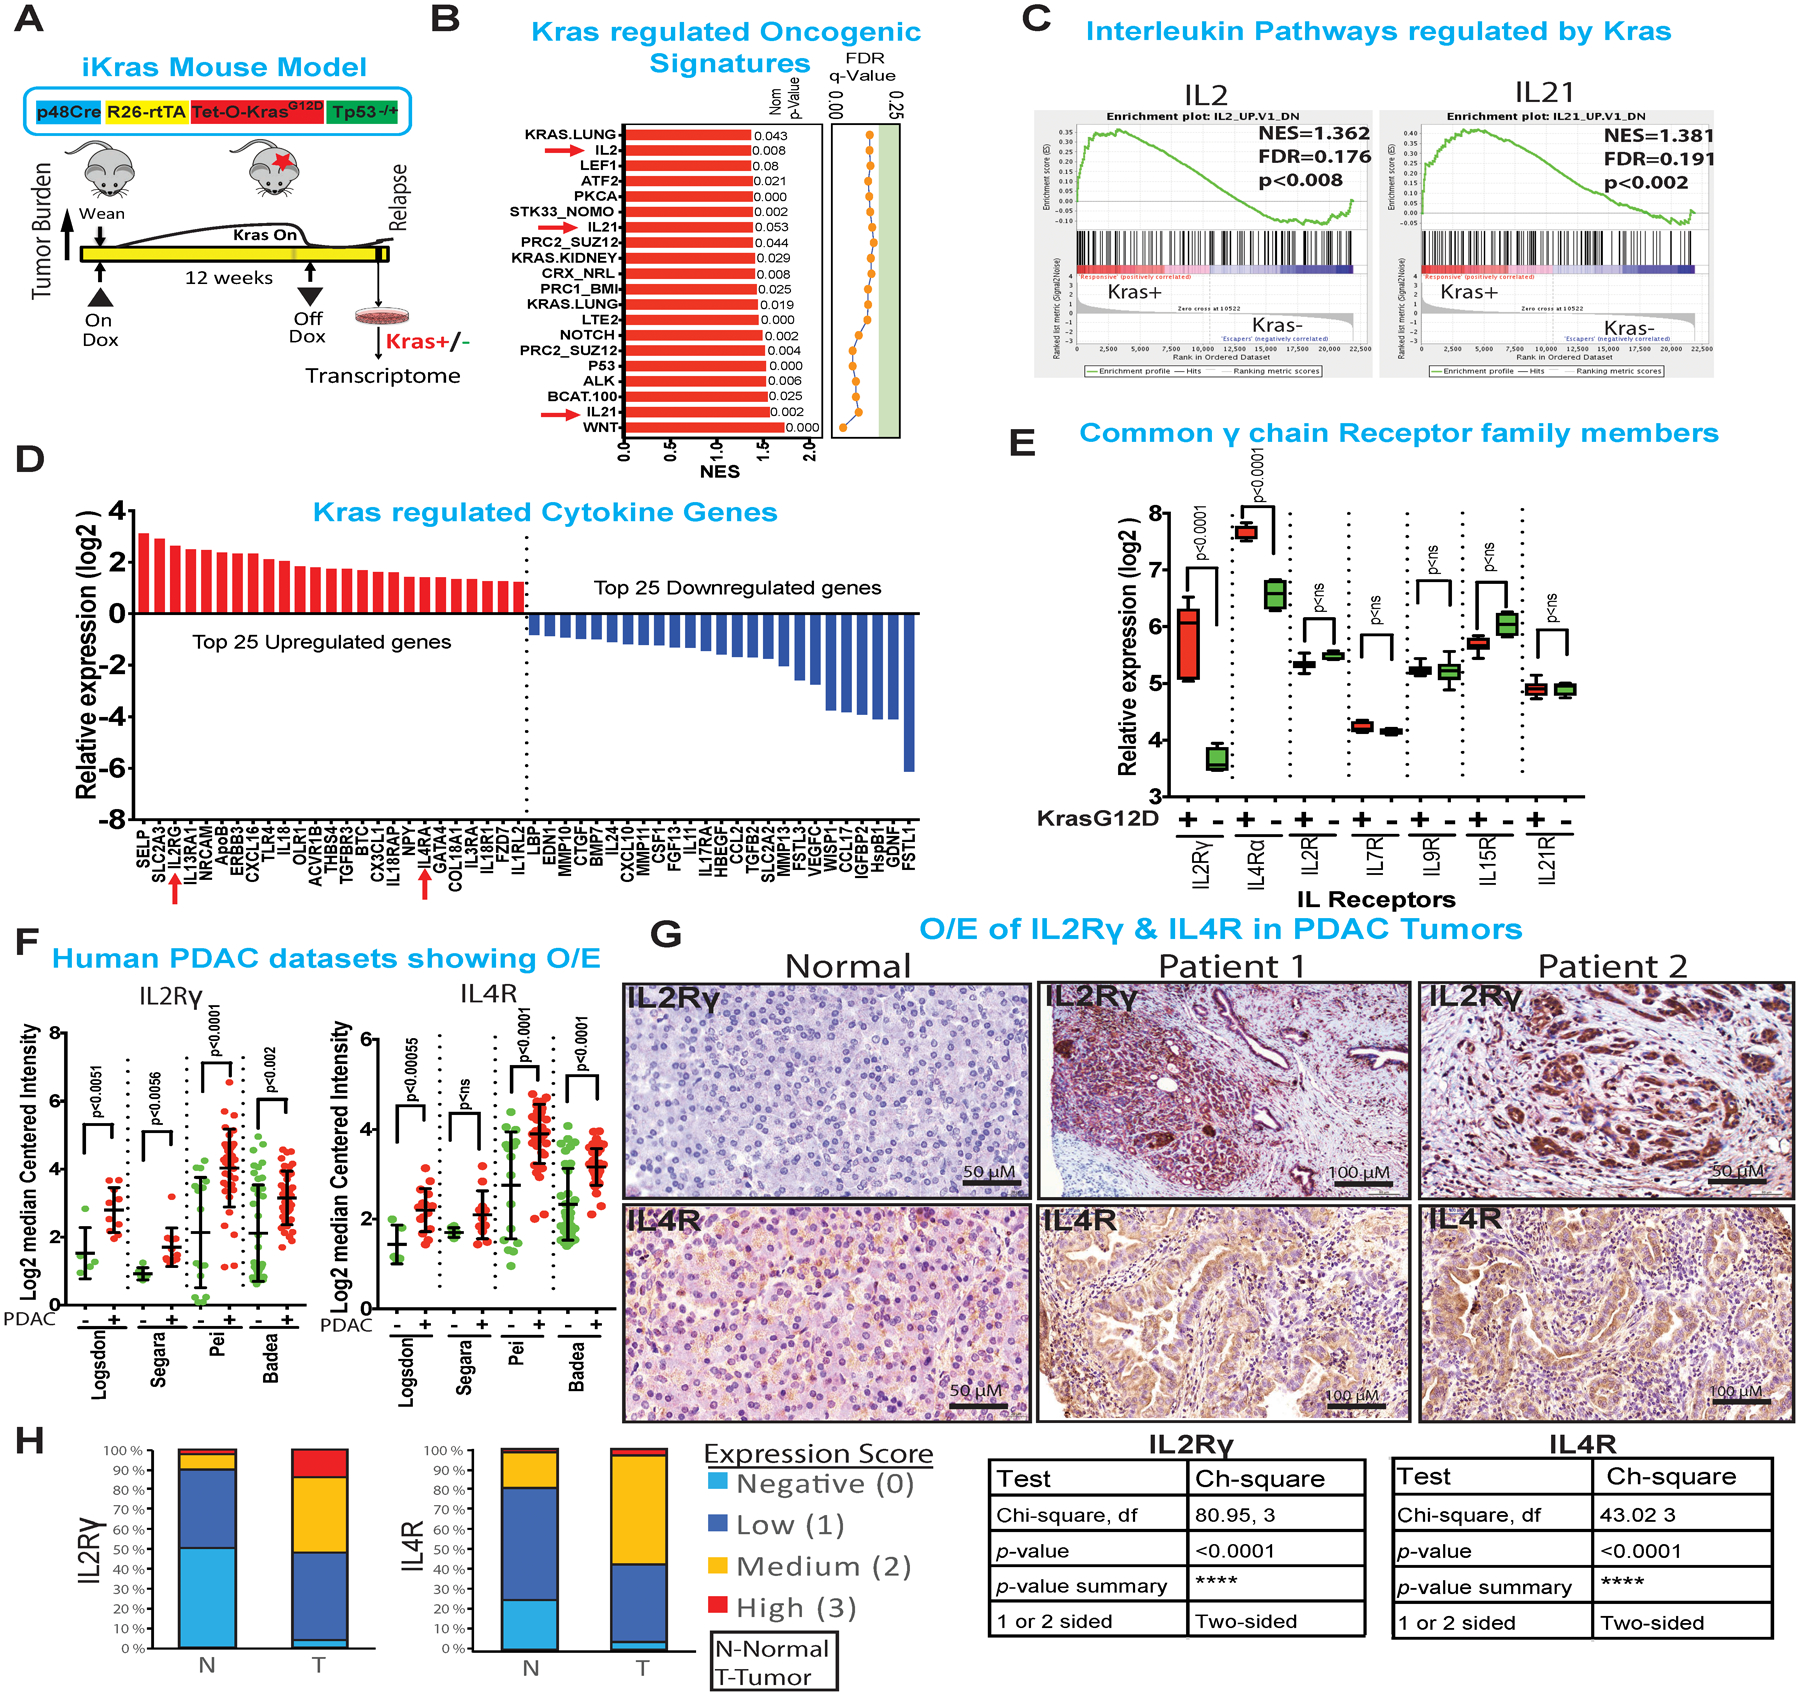
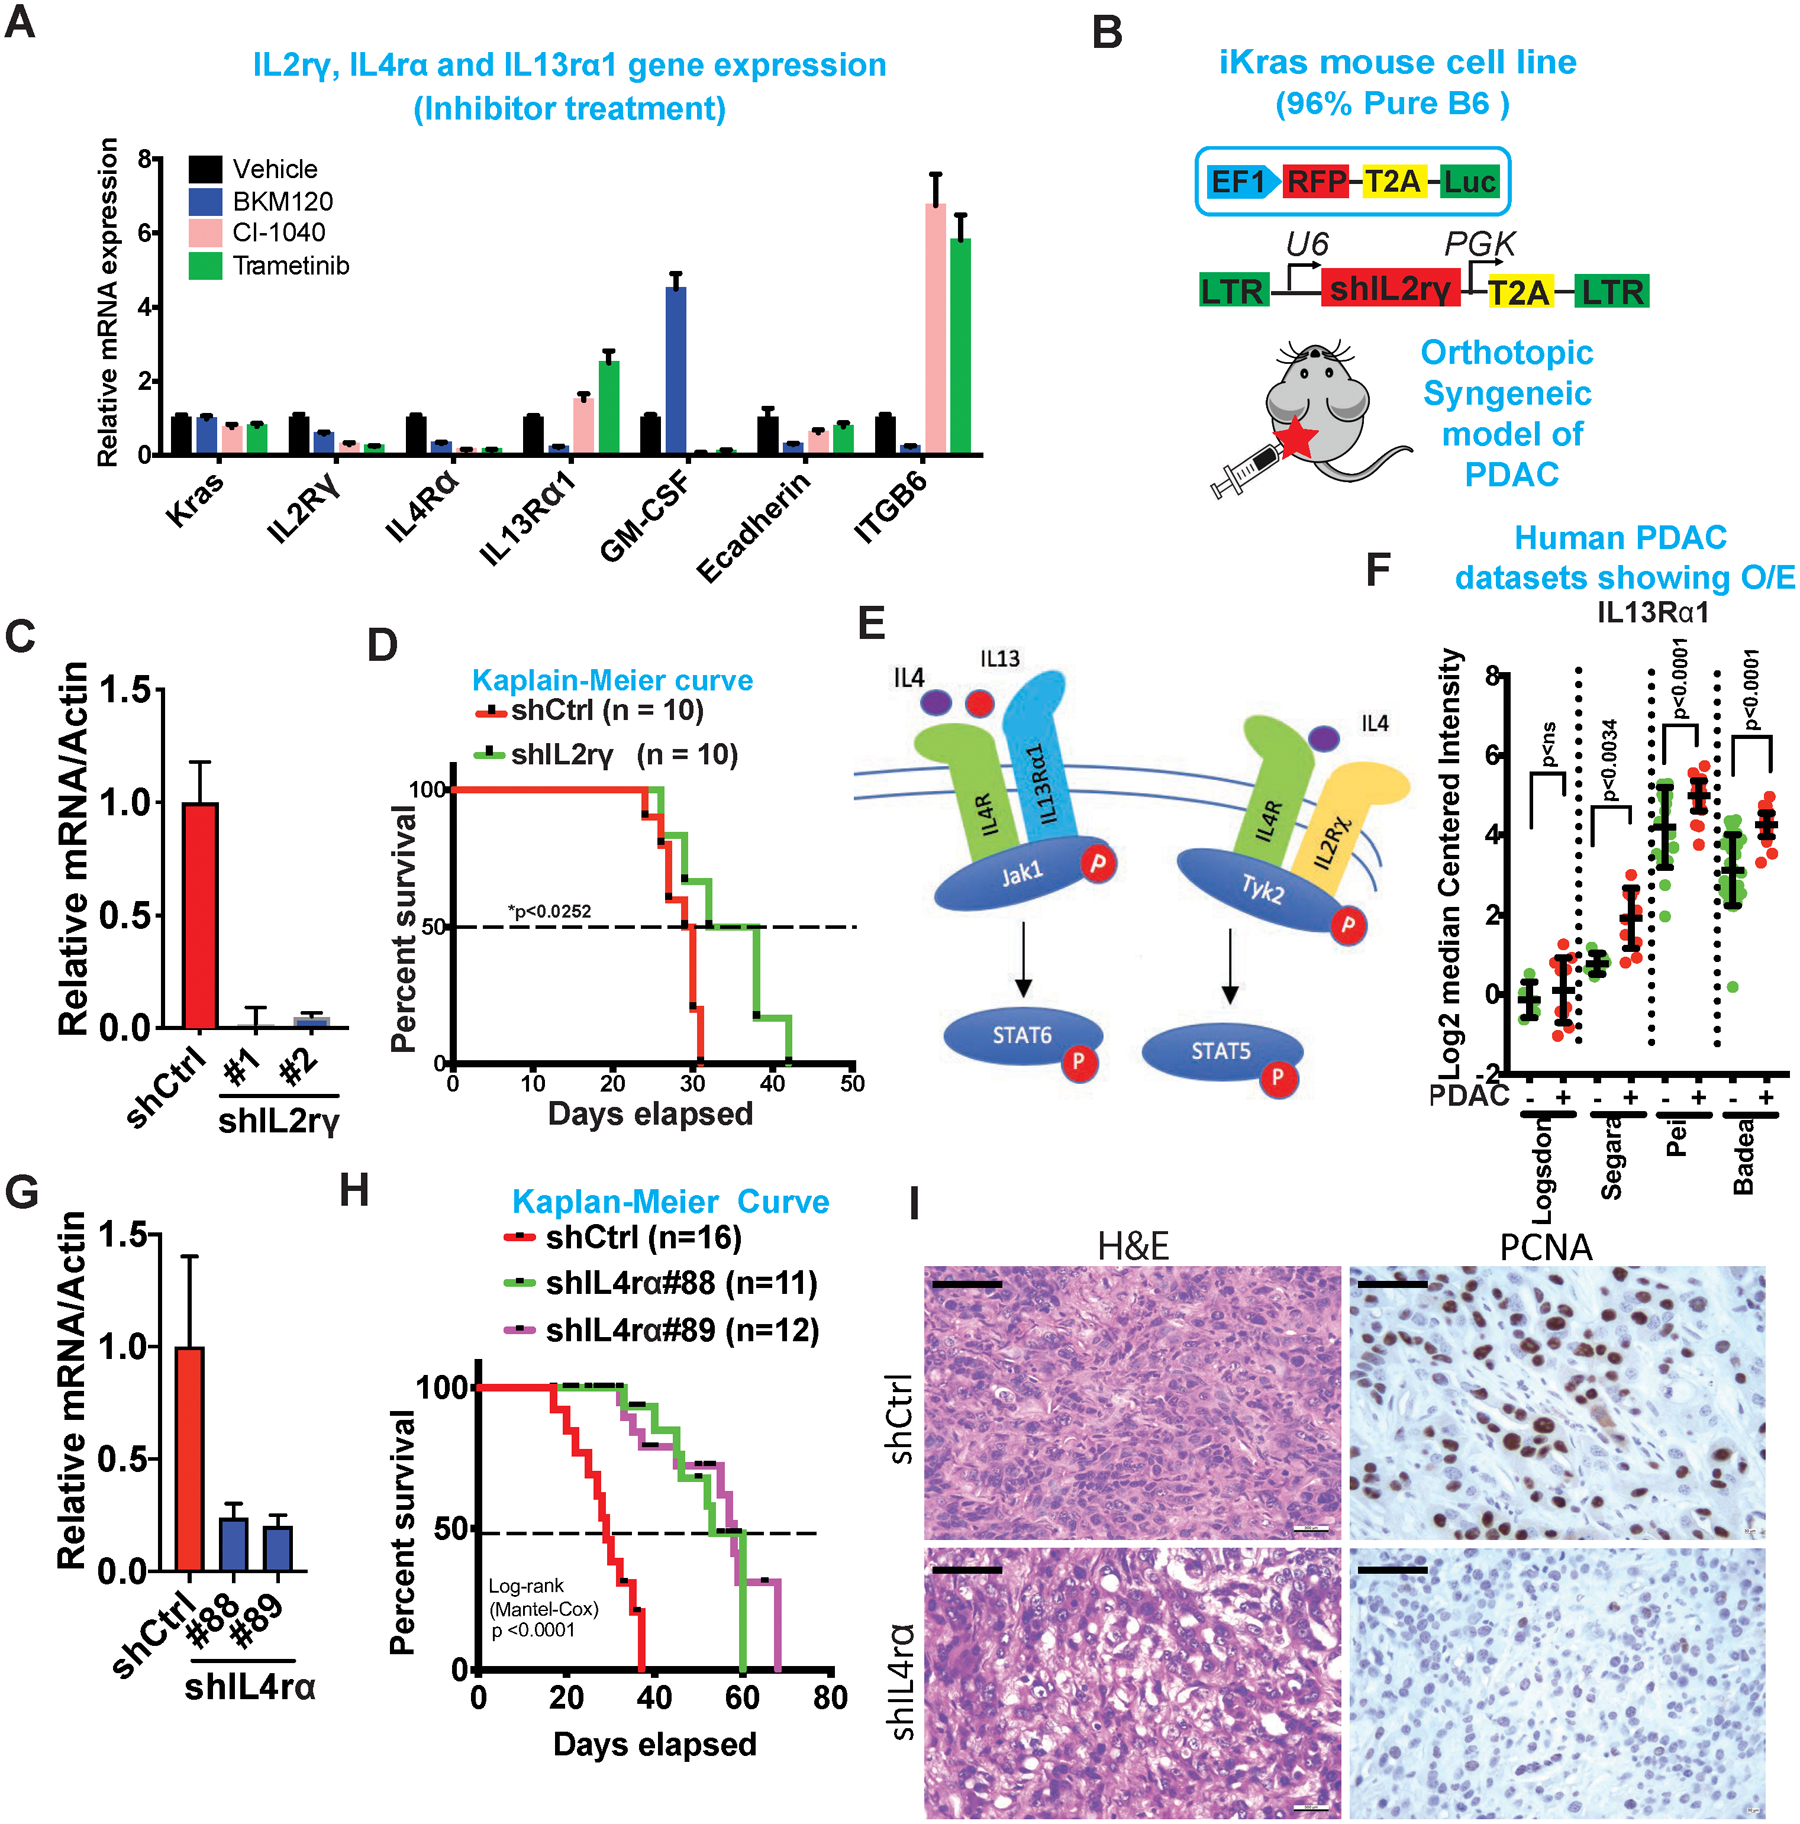
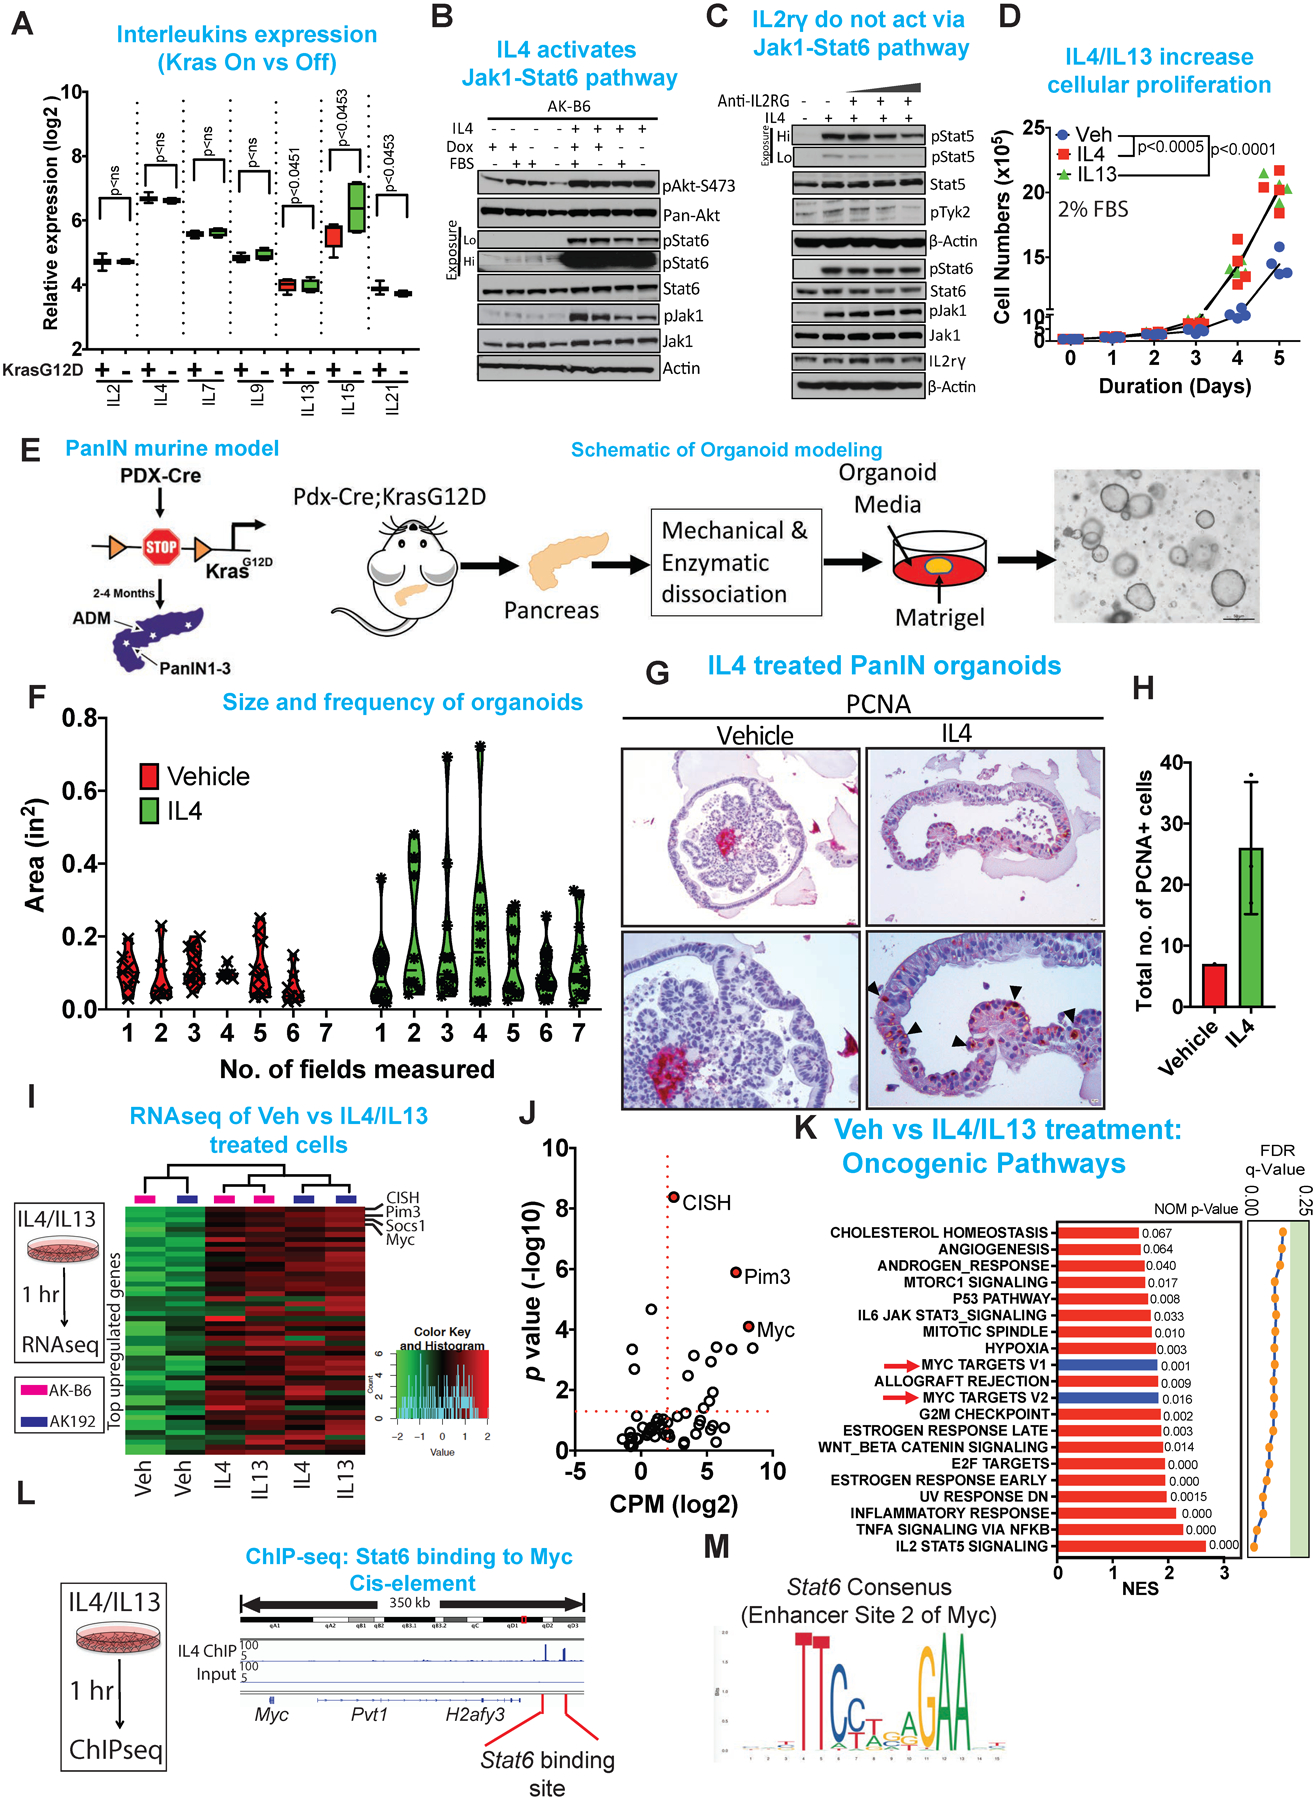
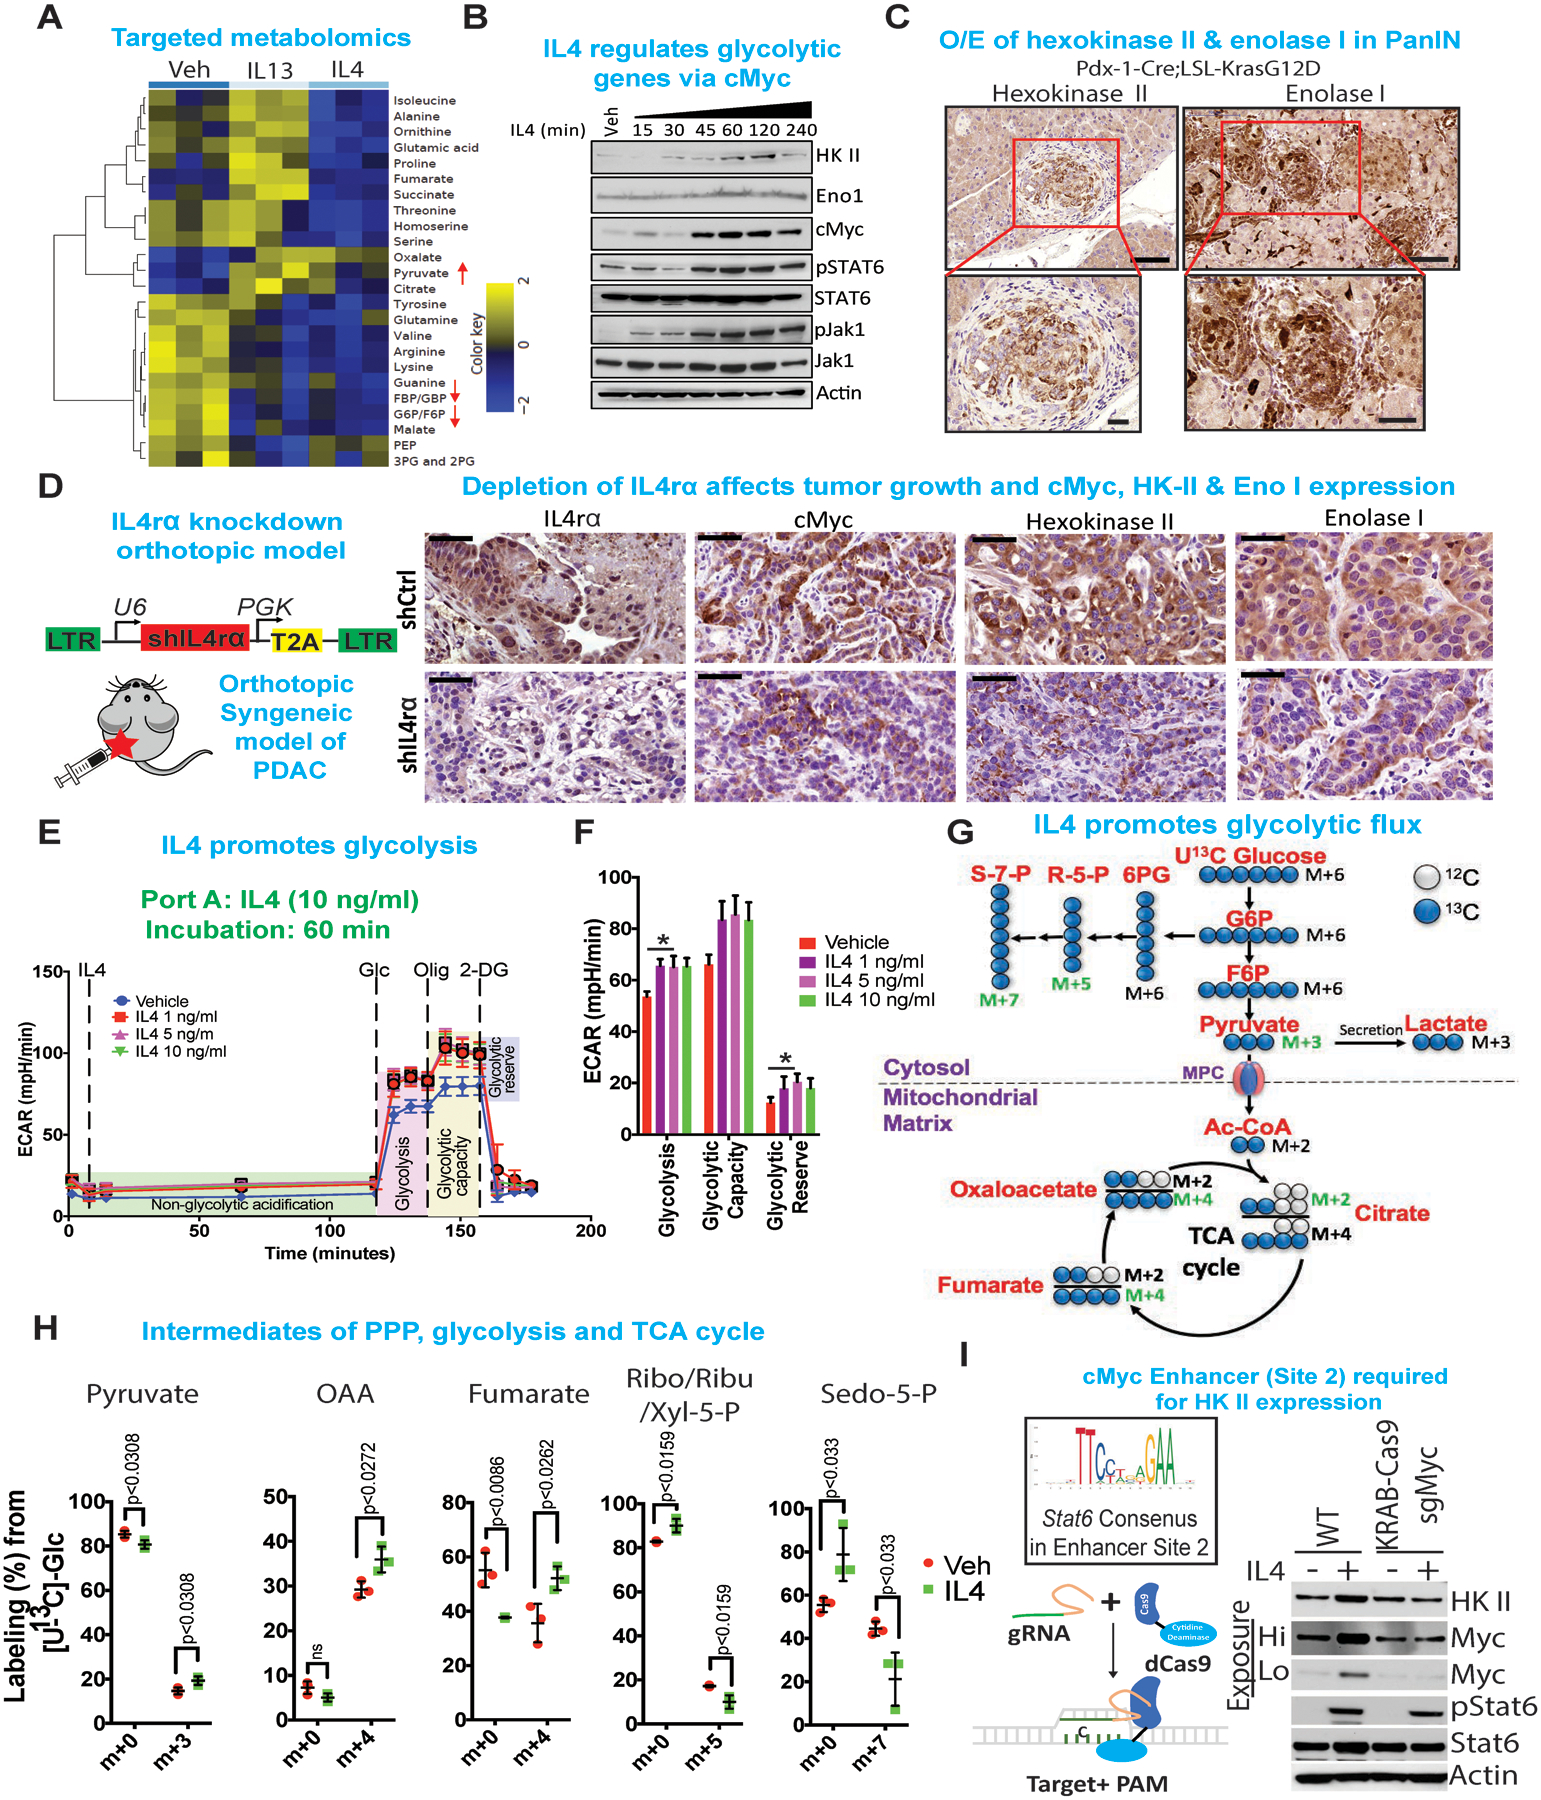
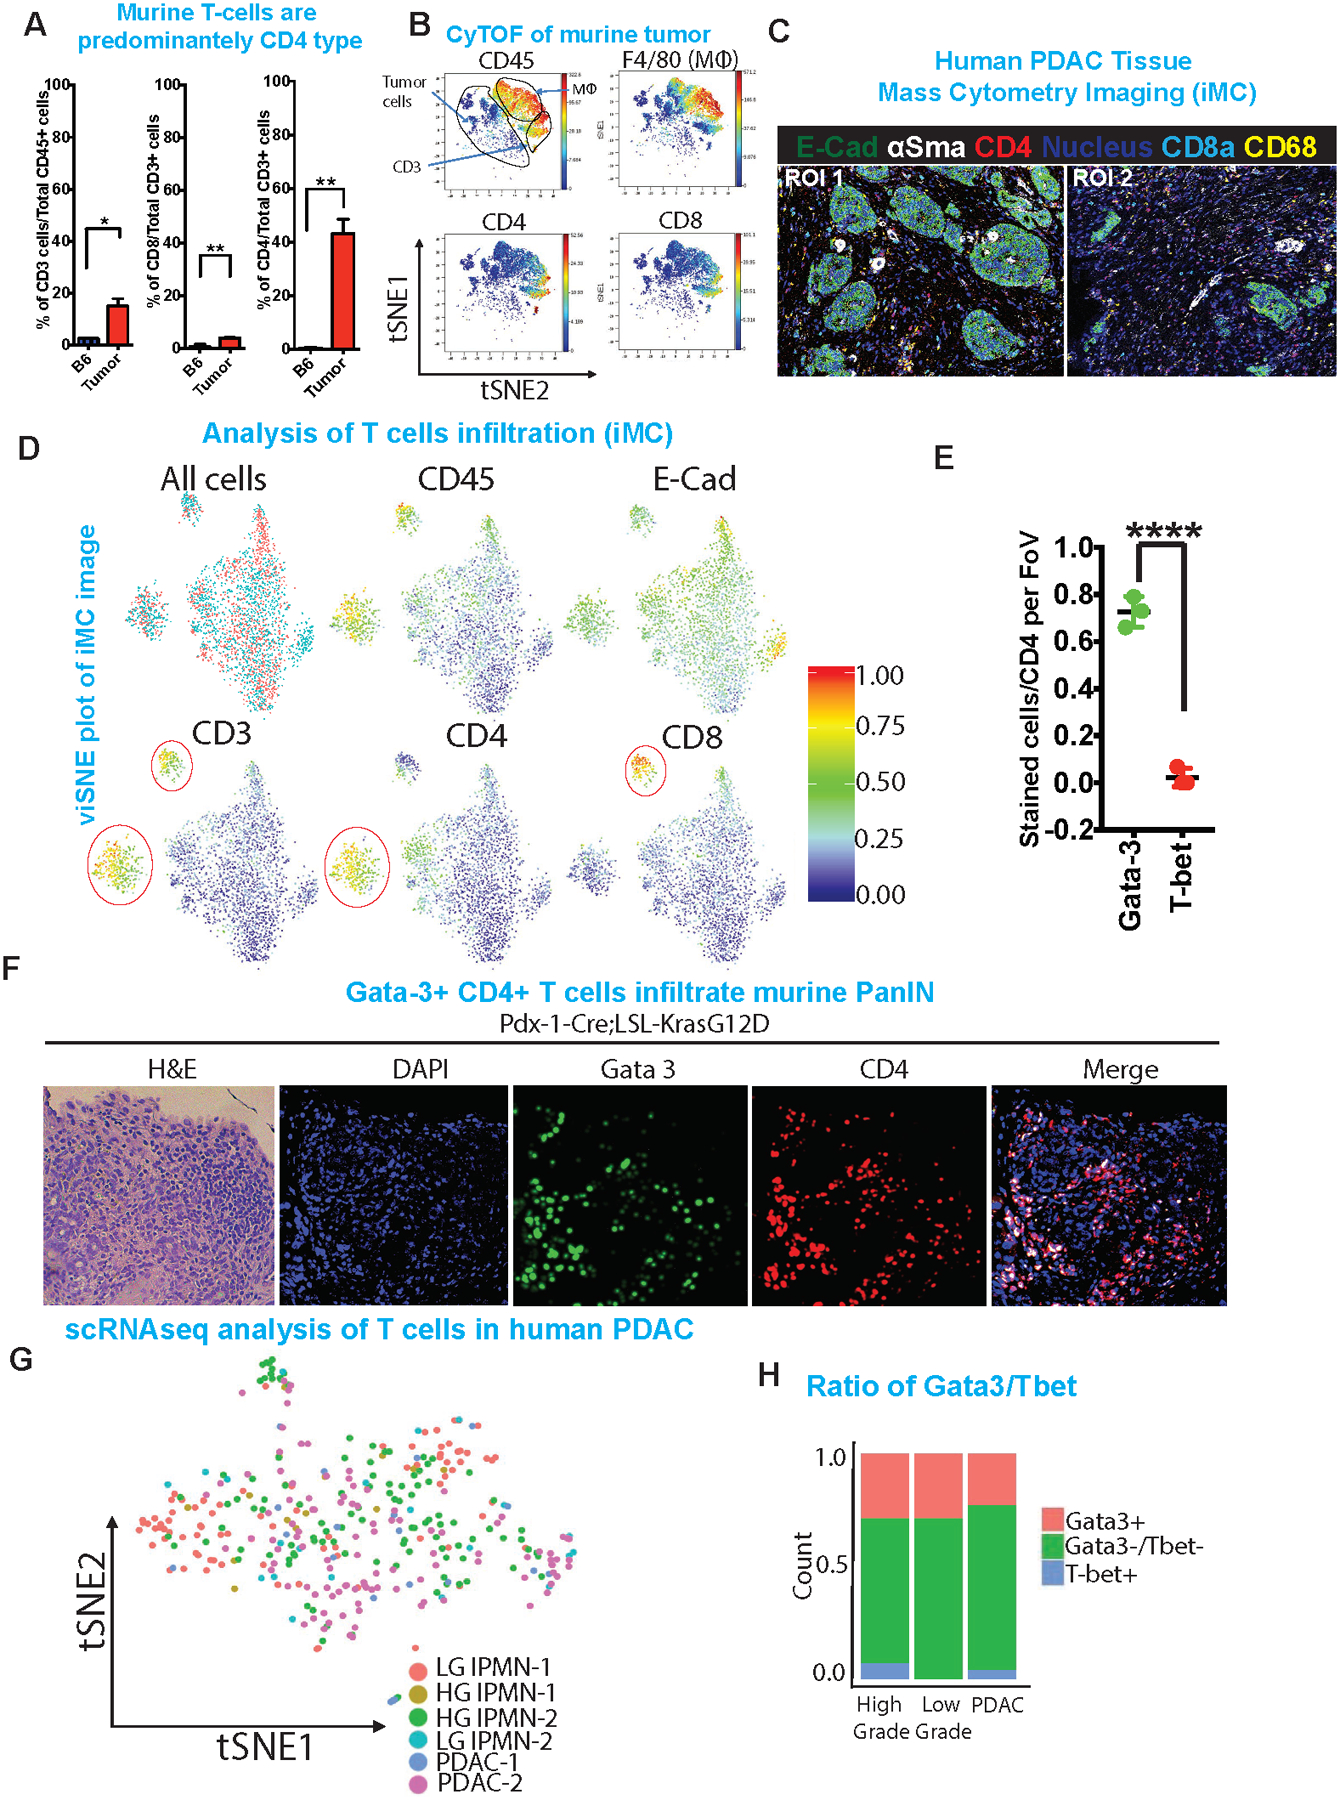
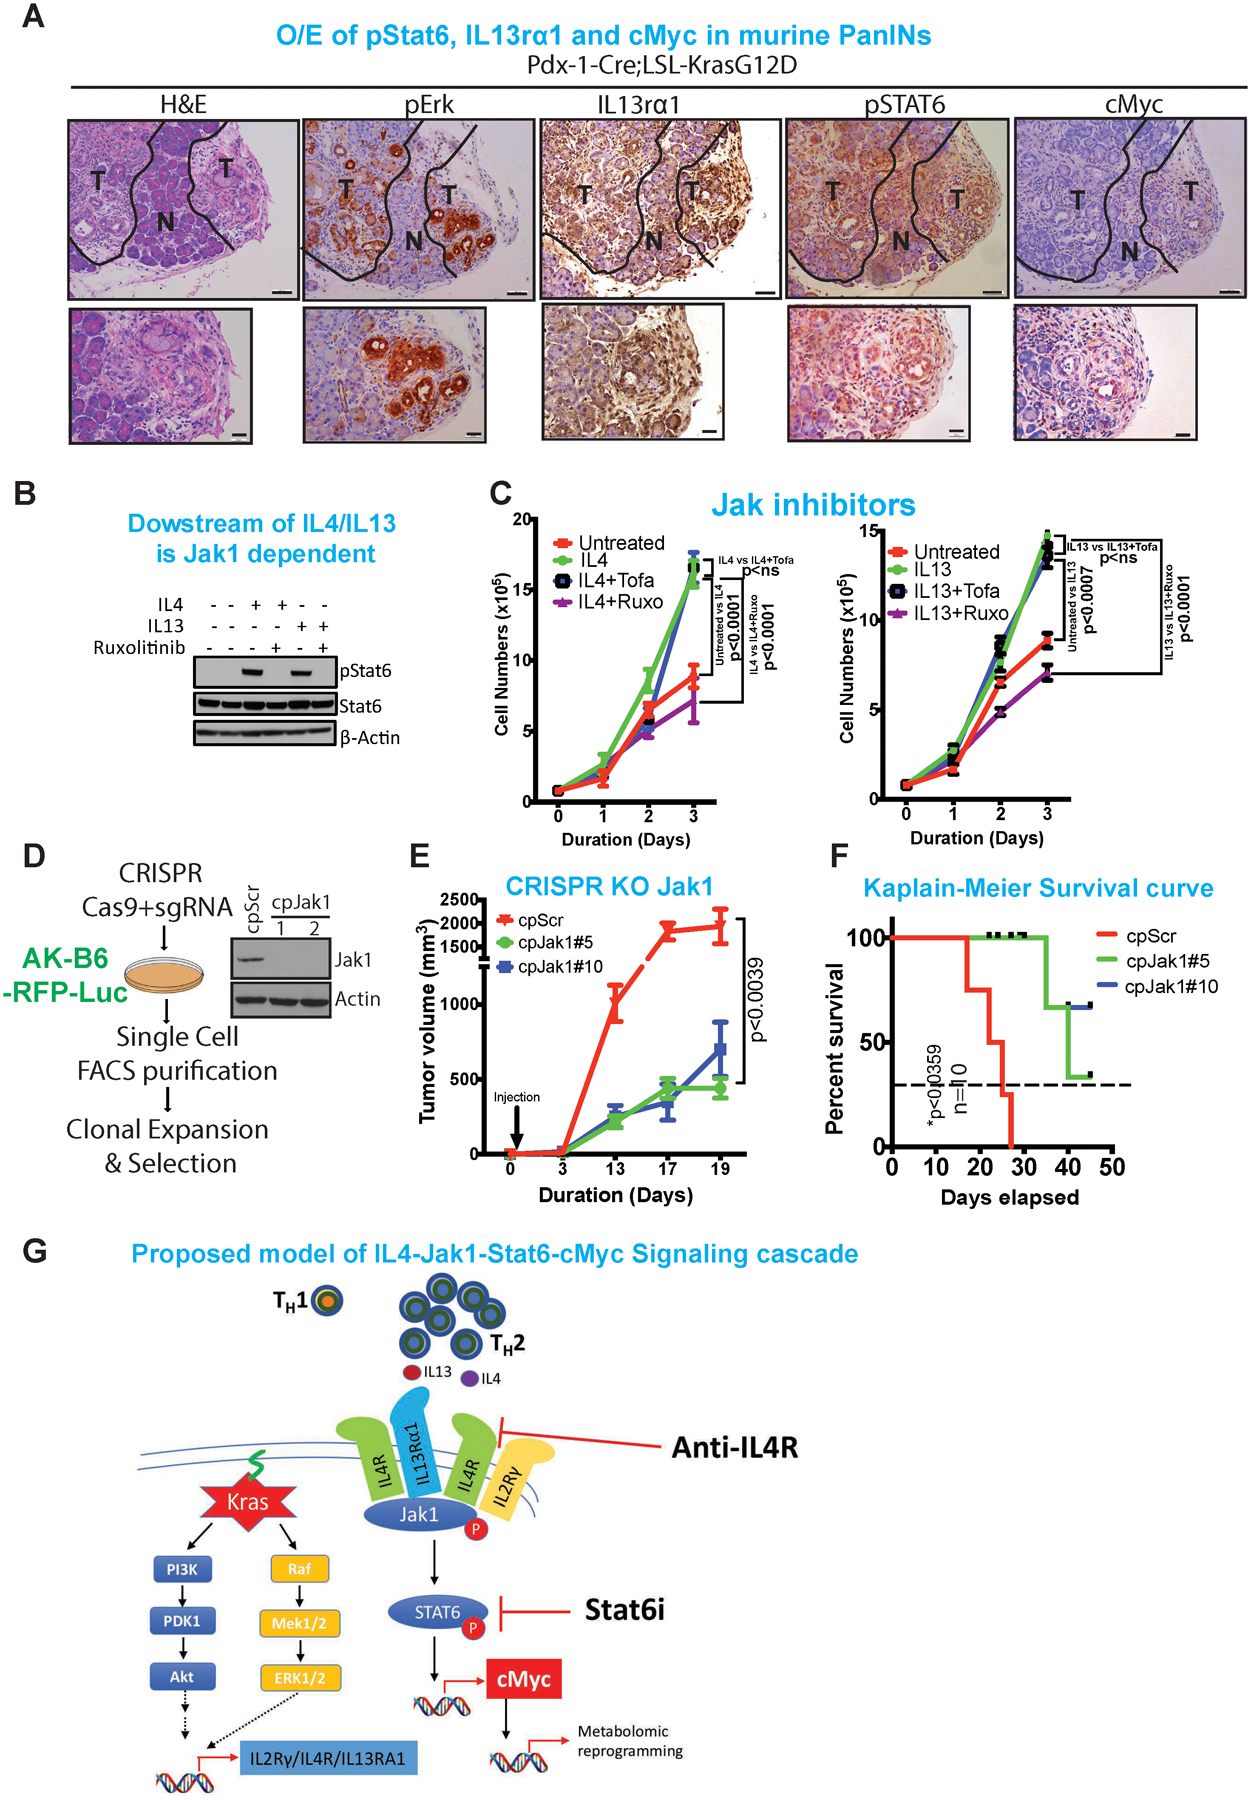
A hallmark of pancreatic ductal adenocarcinoma (PDAC) is an exuberant stroma comprised of diverse cell types that enable or suppress tumor progression. Here, we explored the role of oncogenic KRAS in protumorigenic signaling interactions between cancer cells and host cells. We show that KRAS mutation (KRAS*) drives cell-autonomous expression of type I cytokine receptor complexes (IL2rγ-IL4rα and IL2rγ-IL13rα1) in cancer cells that in turn are capable of receiving cytokine growth signals (IL4 or IL13) provided by invading Th2 cells in the microenvironment. Early neoplastic lesions show close proximity of cancer cells harboring KRAS* and Th2 cells producing IL4 and IL13. Activated IL2rγ-IL4rα and IL2rγ-IL13rα1 receptors signal primarily via JAK1-STAT6. Integrated transcriptomic, chromatin occupancy, and metabolomic studies identified MYC as a direct target of activated STAT6 and that MYC drives glycolysis. Thus, paracrine signaling in the tumor microenvironment plays a key role in the KRAS*-driven metabolic reprogramming of PDAC. SIGNIFICANCE: Type II cytokines, secreted by Th2 cells in the tumor microenvironment, can stimulate cancer cell-intrinsic MYC transcriptional upregulation to drive glycolysis. This KRAS*-driven heterotypic signaling circuit in the early and advanced tumor microenvironment enables cooperative protumorigenic interactions, providing candidate therapeutic targets in the KRAS* pathway for this intractable disease.


Conflict of interest statement

Disclosure of Potential Conflicts of Interest

R.A.D. is a co-founder, advisor and director of Tvardi Therapeutics, Asylia Therapeutics, and Nirogy Therapeutics. The work of this paper is not connected with the focus on these biotechnology companies.

Figures

Figure 1:
Figure 1:. Kras* upregulates specific type I cytokine receptor family members.
(A) Construct of the inducible KrasG12D transgenic mouse alleles (top). Strategy to generate iKras* cell lines followed by transcriptome analysis. (B) Gene Set Enrichment Analysis (GSEA) of oncogenic pathways. Pathways of interest IL2, IL15 and IL21 are highlighted in blue and indicated with red arrow. NOM p values are shown on the right side of the bar graph. (C) Graphs showing the enrichment plots generated by GSEA analysis of IL2 and IL21, comparing Kras+ vs Kras cells. The enrichment score is shown as a scattered green line. In the inset are shown normalized enrichment score (NES), FDR and nominal p value (NOM p value). (D) Top and bottom 25 Kras* regulated mouse cytokine family genes. The gene-rank list was generated by manual curation of ~650 mouse cytokine genes. (E) Relative expression of common gamma (γ) chain receptor family genes regulated by Kras*. Results are shown as mean ± SEM. p values were calculated using Student’s t-test (ns: not statistically significant). (F) Differential expression (log2) of IL2Rγ and IL4R genes from human Oncomine datasets. Results are shown as mean ± SEM. p values were calculated using Student’s t-test (ns: not statistically significant). (G) Normal (left panel) and two representative (right 2 panels) immunohistochemistry of IL2Rγ and IL4R in human samples (n=121) showing membrane expression of both proteins. Scale bars, 50 μm and 100 μm. (H) Quantification and statistical analysis of the immunohistochemistry data from above. Low levels of IL2Rγ and IL4R are expressed in normal pancreas, mostly by the islet cells whereas medium to high level of expression is observed in PDAC. Statistical analysis of the patient samples is shown in the table to the right of graph.
Figure 2:
Figure 2:. IL4r⍺ and not IL2rγ contribute to PDAC progression in vivo.
(A) mRNA expression of Kras, IL2Rγ, IL4rα and IL13Rα1 upon treatment with MEK1/2 (CI-1040 and Trametinib) and PI3K (BKM120) inhibitors. Also, shown are the mRNA expression of GM-CSF, E-cadherin and ITGB6, known downstream regulated genes of Kras and PI3K. (B) Schematic of the vector construct used to generate luciferase receptor cell lines and shRNA knockdown of IL2Rγ (Top). Schematic of orthotopic syngeneic mouse model in C57BL/6 mice (Bottom). (C) mRNA expression of IL2Rγ in mouse tumor cell lines transfected with shRNA for IL2Rγ (Clone #1 and #2) or control vector. (D) Kaplain-Meier survival curves of mice transplanted with mouse tumor cell lines transfected with shRNA for IL2Rγ or control vector (n=10). (E) Schematic of IL2Rγ-IL4R and IL13Rα1-IL4R pathways. (F) Differential expression (log2) of IL13Rα1 in human Oncomine datasets. Results are shown as mean ± SEM. p values were calculated using Student’s t-test (ns: not statistically significant). (G) mRNA expression of IL4rα in mouse tumor cell lines transfected with shRNA for IL4rα (Clone #88 and #89) or control vector. (H) Kaplain-Meier survival curves of mice transplanted with mouse tumor cell lines transfected with shIL4rα#88 (n=11), shIL4rα#89 (n=12) or control vector (n=16). Survival statistics was calculated using Log-rank (Mantel-Cox) test; p value <0.0001. (I) Representative H & E and PCNA staining of orthotopic tumor of mouse transfected with shIL4rα#89 or shCtrl cell lines. Scale bars, 50 μm.
Figure 3:
Figure 3:. PDAC cancer cells are responsive to IL4 and IL13 cytokines which drives Jak-Stat-cMYC activation.
(A) Relative expression (log2) of common gamma chain family cytokines ON and OFF dox. Results are shown as mean ± SEM. p values were calculated using Student’s t-test (ns: not statistically significant). (B) Immunoblot analysis for pAkt-S473, pan-Akt, pStat6, Stat6, pJak1 and Jak1 of mouse cell lines treated for 1 hour with IL4 in the presence or absence of FBS and dox. β-Actin acts as a loading control. Hi and Lo indicates high and low exposure of the membrane. (C) Immunoblot analysis for pStat5, Stat5, pTyk2, pStat6, Stat6, pJak1, Jak1 and IL2rγ upon treatment with anti-IL2rγ antibody (concentration range 3.3, 33, 66, 132 μg/ml, respectively) in the presence or absence of IL4 (10 ng/ml). β-Actin acts as a loading control. Hi and Lo indicates high and low exposure of the membrane. (D) Proliferation assay of mouse cell lines treated with IL4 (10 ng/ml) or IL13 (10 ng/ml) for the days indicated. The cells were cultured in 2% FBS. Data represent n=3, repeated 4 times. (E) Schematic of the PanIN mouse model and of the workflow for generating pancreas organoid. (F) Violin plots of size and frequency of organoids upon treatment with vehicle or IL4. Organoids were grown as droplets in 96 well plates and treated with IL4 (20 ng/ml) for 72 hrs. Seven individual wells were imaged and the measurement were done using ImageJ. (G) Representative immunohistochemistry of PCNA comparing vehicle and IL4 treated pancreas organoid. (H) Quantification of PCNA positive cells following vehicle vs IL4 treatment of organoids. (I) Heat maps of the genes enriched in indicated genes upon treatment of cells with IL4 (10 ng/ml) or IL13 (10 ng/ml) for 1 hour. Expression levels shown are representative of log2 values of each replicate from either vehicle or IL4 treated cultured cell lines. Red signal denotes higher expression relative to the mean expression level within the group, and green signal denotes lower expression relative to the mean expression level within the group. (J) Quantification of the enriched genes based on CPM (log2) vs p value (-log10) showing cMyc as the top enriched gene. (K) GSEA analysis of oncogenic pathways showing cMyc as of the top targets. (L) ChIP-seq of Stat6 showing binding of Stat6 on the cis-element of cMyc. (M) Consensus sequence of Stat6 binding site on the cMyc cis-element.
Figure 4:
Figure 4:. IL4/IL13 upregulates cMyc to promote metabolic reprogramming.
(A) Heat map of those metabolites that were significantly and consistently changed upon treatment of IL4 or IL13 in two iKras cell lines as determined by targeted LC-MS/MS. Cells were treated with IL4 or IL13 for 1 hour, at which point metabolite levels were measured from triplicates for each treatment condition. The averaged ratios of differentially regulated metabolites are represented in the heat map (Differential FDR<0.25). Arrows indicate metabolites involved in glucose metabolism that were regulated upon IL4 or IL13 treatment. (B) Immunoblot analysis for hexokinase (HK) II, enolase I, cMyc, pStat6, Stat6, pJak1 and Jak1 of cells treated with IL4 (10 ng/ml) for indicated times. β-Actin acts as a loading control. (C) Immunohistochemistry of hexokinase II and enolase I in pre-neoplastic mouse (Pdx-1-Cre;LSL-KrasG12D) pancreas. The lower panels are magnified images of the boxed regions. Scale bars, 50 μm and 100 μm, respectively. (D) (Left) Cartoon of syngeneic orthotopic tumor model, whose tissues were used for immunohistochemistry analysis. (Right) Representative immunohistochemistry showing IL4ra, cMyc, Hexokinase II and Enolase I expression in syngeneic orthotopic tumor tissues comparing shIL4r⍺ vs. shCtrl knockdown. Scale bar, 50 μm. (E) Seahorse analysis for extracellular acidification rate (ECAR) of cells treated with IL4 (1–10 ng/ml) for 1 hour. (F) Quantification of the Seahorse data on the left. Results are shown as mean ± SEM. p values were calculated using Student’s t-test. (G) Diagram of glycolysis and TCA cycle. Blue circles indicate 13C-labeled carbons. Red label indicates metabolites measured using mass spectrometry. (H) Percentage labelling of 13C-labeled carbon in metabolites indicated. Data are presented as mean ± SEM. n = 4. Two-tailed t-test was used for all comparisons between two groups. (I) Consensus sequence of Stat6 binding site on the cMyc cis-element (Top left). Schematic of KRAB-dCas9 (Bottom left). Immunoblot showing loss of IL4 mediated regulation of cMyc and HK II upon binding of KRAB-dCas9 on the cMyc cis-element, that blocks the binding of Stat6 to the consensus cis-element. Actin acts as a loading control.
Figure 5:
Figure 5:. The tumor microenvironment supplies IL4 and IL13.
(A) Quantification of total CD3, CD8 and CD4 populations in iKras tumor compared to normal pancreas using flow cytometry. Cell populations were identified as T cells (CD45+CD3e+), CD4+ T cells (CD45+CD3e+CD8CD4+), CD8+ T cells (CD45+CD3e+ CD8+CD4). (B) viSNE analysis of CyTOF data of immune cells from tumor, colored by relative expression of CyTOF markers, with populations indicated as CD45, F4/80, CD4 and CD8. Total CD3, tumor cells and macrophage populations are circled. (C) Representative images of two different ROI of multiplex imaging (iMC) showing staining for E-cadherin, αSMA, CD4, CD8a and CD68. White asterisks indicate CD4+ T cells. (D) viSNE plot of population analysis of iMC image (Figure 5C). Shown are quantification of all events, CD45, E-cadherin, CD3, CD4 and CD8. (E) Quantification of Gata-3 and T-bet staining based on the IHC staining in PanIN model. ***p <0.001 (F) Representative H&E and immunofluorescence images of PanINs stained with DAPI, Gata3, CD4. Right most panel shows merged image of CD4 and Gata3. Scale bars, 100 μm (G) tSNE plot of single cell analysis on IPMN and PDAC human tumor samples followed by digital microdissection of T cells to analyze the presence of various T cell subtypes. Annotated colors represent lesion of origin of the respective T cells. (H) Quantification of single cell data (left) showing Gata3+ and T-bet+ CD4 T cells in human IPMNs (low and high grade) and PDAC samples.
Figure 6:
Figure 6:. Jak1-Stat6 pathway promotes cancer cell proliferation and tumor growth.
(A) Representative H&E and immunohistochemistry analysis of pErk, IL13rα1, pStat6 and cMyc in the pre-neoplastic pancreas. The lower panels are amplified images of those above. Scale bars, 100 μm (upper) and 50 μm (lower). Representative luciferase images of comparing anti-HRP vs anti-IL4 (n=10), imaged at day 4. (B) Immunoblot of pStat6 and Stat6 upon treatment with IL4 or IL13 followed by treatment with ruxolitinib, a specific Jak1 inhibitor. β-Actin acts as a loading control. (C) Proliferation assay of iKras cell lines upon treatment with IL4 or IL13 and followed by treatment with ruxolitinib (Jak1 inhibitor) and tofacitinib (Jak2/3 inhibitor). (D) Strategy for CRISPR-Cas9 knockdown of Jak1 in mouse pancreas cell line. Immunoblot of Jak1 in two separate single clones of Jak1 knockout cell lines. β-Actin acts as a loading control. (E) Tumor volume of transplanted tumor upon CRISPR-Cas9 knockout of Jak1 compared to scrambled control (n=5). (F) Kaplain-Meier survival curves of mice transplanted with mouse tumor cell lines transfected with CRISPR-Cas9 knockout of Jak1 or control cell lines (n=10). (G) Proposed model of IL4-Jak1-Stat-cMyc signaling cascade that includes Kras mediated upregulation IL4-IL2rγ and IL4-IL13Rα1 receptors and infiltration of TH2 cells into the tumor microenvironment.

Similar articles

Cited by

References

    1. Ying H, et al. Oncogenic Kras maintains pancreatic tumors through regulation of anabolic glucose metabolism. Cell 149, 656–670 (2012). - PMC - PubMed
    1. Viale A, et al. Oncogene ablation-resistant pancreatic cancer cells depend on mitochondrial function. Nature 514, 628–632 (2014). - PMC - PubMed
    1. Kapoor A, et al. Yap1 activation enables bypass of oncogenic Kras addiction in pancreatic cancer. Cell 158, 185–197 (2014). - PMC - PubMed
    1. Feig C, et al. The pancreas cancer microenvironment. Clinical cancer research : an official journal of the American Association for Cancer Research 18, 4266–4276 (2012). - PMC - PubMed
    1. Clark CE, et al. Dynamics of the immune reaction to pancreatic cancer from inception to invasion. Cancer Res 67, 9518–9527 (2007). - PubMed

Publication types