. 2020 Jun 15;26(12):2849-2858.
doi: 10.1158/1078-0432.CCR-19-3418. Epub 2020 Feb 11.

Circulating Tumor DNA Analysis to Assess Risk of Progression after Long-term Response to PD-(L)1 Blockade in NSCLC

Affiliations

Circulating Tumor DNA Analysis to Assess Risk of Progression after Long-term Response to PD-(L)1 Blockade in NSCLC

Matthew D Hellmann et al. Clin Cancer Res. .

Abstract

Purpose: Treatment with PD-(L)1 blockade can produce remarkably durable responses in patients with non-small cell lung cancer (NSCLC). However, a significant fraction of long-term responders ultimately progress and predictors of late progression are unknown. We hypothesized that circulating tumor DNA (ctDNA) analysis of long-term responders to PD-(L)1 blockade may differentiate those who will achieve ongoing benefit from those at risk of eventual progression.

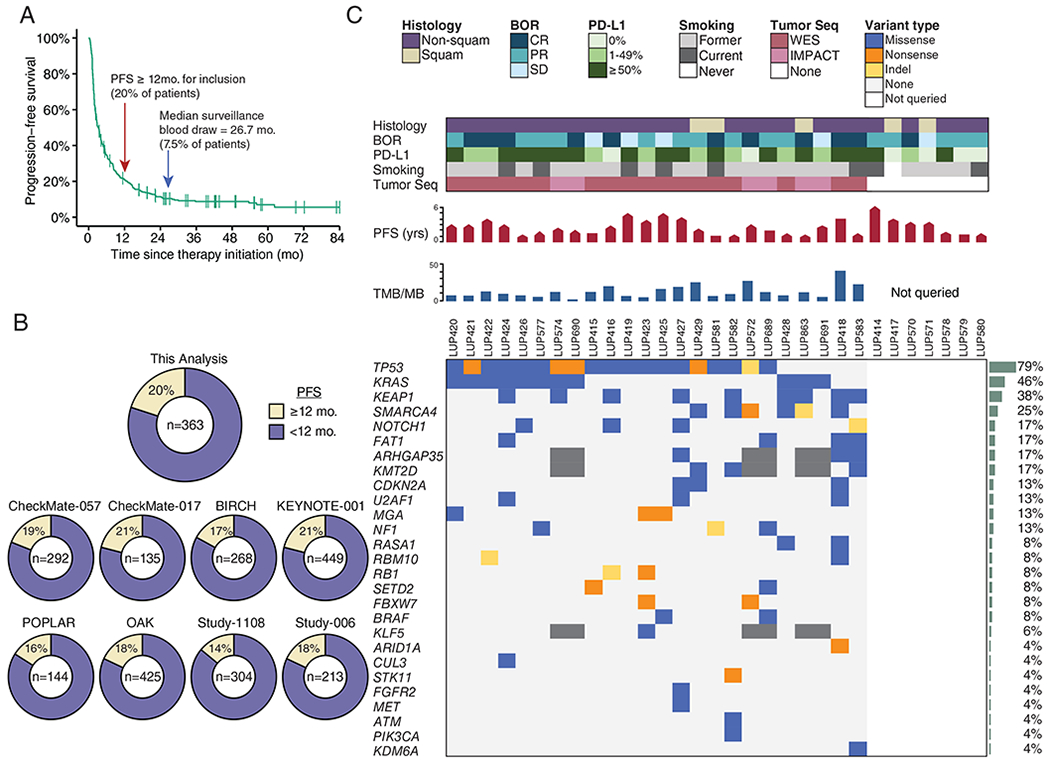
Experimental design: In patients with advanced NSCLC achieving long-term benefit from PD-(L)1 blockade (progression-free survival ≥ 12 months), plasma was collected at a surveillance timepoint late during/after treatment to interrogate ctDNA by Cancer Personalized Profiling by Deep Sequencing. Tumor tissue was available for 24 patients and was profiled by whole-exome sequencing (n = 18) or by targeted sequencing (n = 6).

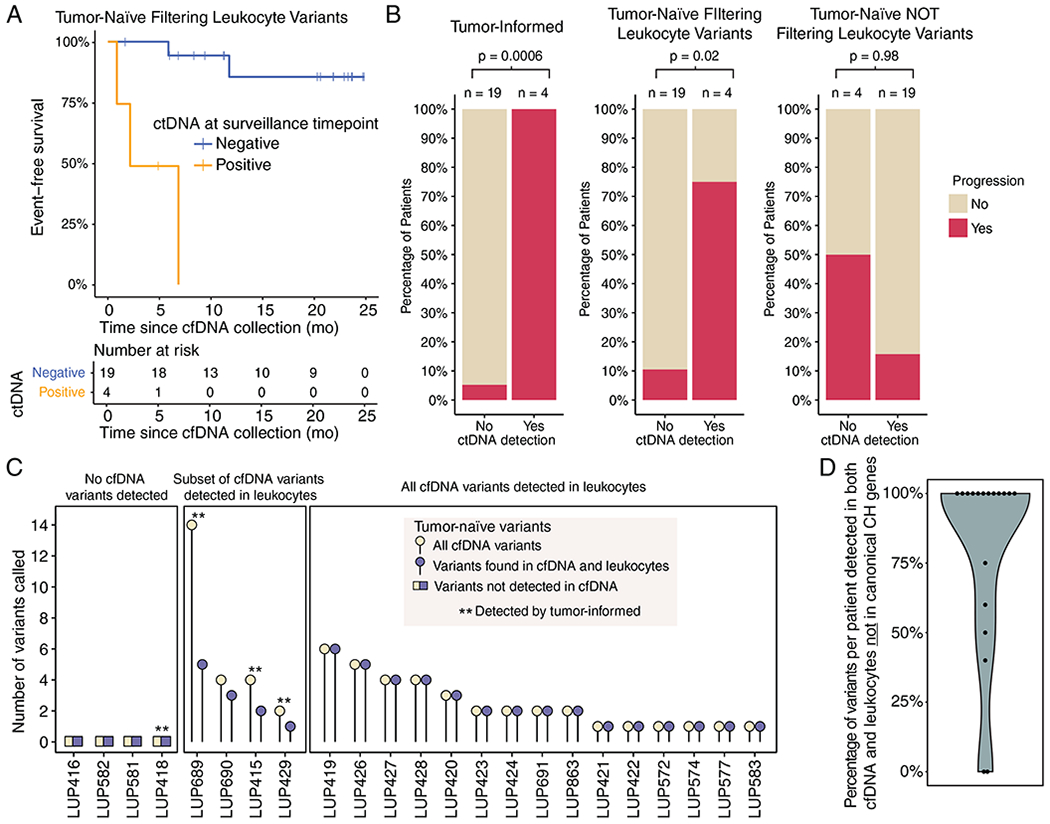
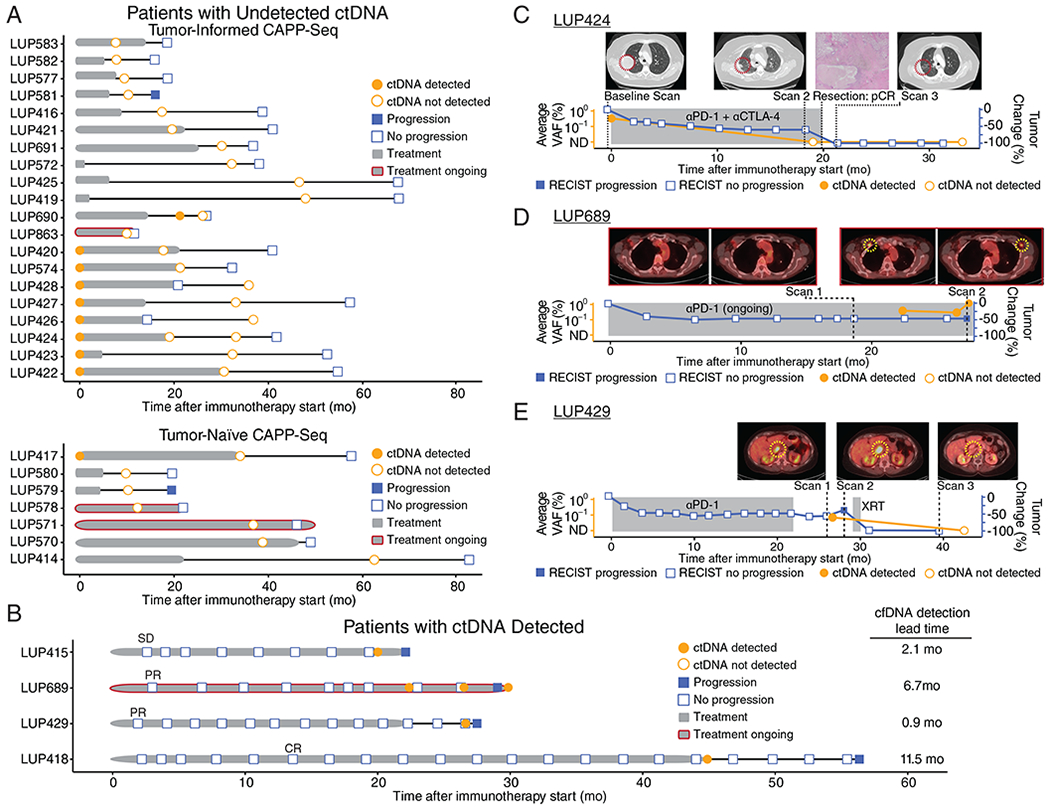
Results: Thirty-one patients with NSCLC with long-term benefit to PD-(L)1 blockade were identified, and ctDNA was analyzed in surveillance blood samples collected at a median of 26.7 months after initiation of therapy. Nine patients also had baseline plasma samples available, and all had detectable ctDNA prior to therapy initiation. At the surveillance timepoint, 27 patients had undetectable ctDNA and 25 (93%) have remained progression-free; in contrast, all 4 patients with detectable ctDNA eventually progressed [Fisher P < 0.0001; positive predictive value = 1, 95% confidence interval (CI), 0.51-1; negative predictive value = 0.93 (95% CI, 0.80-0.99)].

Conclusions: ctDNA analysis can noninvasively identify minimal residual disease in patients with long-term responses to PD-(L)1 blockade and predict the risk of eventual progression. If validated, ctDNA surveillance may facilitate personalization of the duration of immune checkpoint blockade and enable early intervention in patients at high risk for progression.


Figures

Figure 1:
Figure 1:. Pre-treatment molecular profiles of tumor biopsies and cfDNA from long-term responders to PD-(L)1 blockade.
A) Progression-free survival of patients with NSCLC treated with PD-(L)1 blockade as part of initial clinical trials at MSKCC (n = 363). Arrows indicate cut-off for definition of long-term benefit (PFS ≥ 12 months), and the median surveillance plasma collection time (26.7 months). B) Percent of patients who would be classified as achieving long-term benefit from (A) as well as, for context, other clinical trials with unselected NSCLC. C) Clinical and molecular features of patients with advanced NSCLC experiencing long-term responses to PD-(L)1 blockade. Each column represents an individual patient. Boxes are color coded for tumor histology (squamous or non-squamous), smoking status (former, current, or never), and best overall response (BOR) by RECIST criteria (complete response [CR], partial response [PR], or stable disease [SD]) as indicated. Tumor PD-L1 expression is stratified as 0%, 1%-49%, or ≥50%. When available, pre-treatment tumor tissue was sequenced (Tumor Seq) by whole exome sequencing (WES) or a targeted panel (MSK-IMPACT). Patients with no Tumor Seq were unevaluable for TMB and individual tumor mutations as depicted on the right. PFS is depicted in months, where the pointed bars represent ongoing responses and the flat bars represent patients who have progressed. TMB is presented as the number of nonsynonymous mutations and indels per megabase of the coding exome. Nonsynonymous mutations and indels in genes recurrently mutated in NSCLC are shown in descending order of prevalence (35). Mutation recurrence rate in the cohort is depicted by bar graphs to the right.
Figure 2:
Figure 2:. ctDNA analysis identifies patients at risk of eventual progression after long-term response to PD-(L)1 blockade.
A) ROC analysis of pre-treatment ctDNA detection using CAPP-Seq in either the tumor-naïve (red, n = 9) or tumor-informed (green, n = 8) context. B) Comparisons of pre-treatment variant allele (%) for plasma ctDNA by CAPP-Seq (right) versus corresponding tumor biopsies by WES (left) are shown for nine patients with baseline plasma available. Tumor-informed CAPP-Seq was performed when tumor tissue was available (n=8) and tumor-naïve CAPP-Seq was performed when it was not (n=1; LUP417). N-values depict the number of mutant genes detected by WES in tumor biopsies and monitored by CAPP-Seq in plasma. ND = not detected. C) Percent of patients eventually experiencing progression based on presence or absence of detectable ctDNA in the surveillance plasma sample. P < 0.0001 (one-sided Fisher’s Exact Test). D) Comparison of event-free survival after surveillance cfDNA collection, stratified by ctDNA status using tumor-informed detection (detection limit ~0.002%) for patients with pre-treatment tumor tissue (n = 24) and tumor-naïve detection (detection limit ~0.1%) for patients without (n = 7). P < 0.0001 (log-rank test).
Figure 3:
Figure 3:. Tumor-naïve and tumor-informed ctDNA analyses are largely concordant if leukocyte variants are considered.
A) Event-free survival after surveillance cfDNA collection in the subset of patients with tumor tissue available using tumor-naïve detection (n = 23). P < 0.0001 (log-rank test). B) Concordance levels between surveillance sample ctDNA detection status (x-axis) and ultimate progression status (y-axis, colored bars) are depicted as a function of 3 ctDNA genotyping strategies. The tumor-informed strategy (left) demonstrates the best predictive performance (one-sided Fisher’s Exact Test P = 0.0006), followed by the tumor naïve strategy after excluding leukocyte variants (one-sided Fisher’s Exact Test P = 0.02, middle). In the absence of genotyping of leukocyte-derived variants (right), the tumor-naïve strategy fails to significantly predict progression risk (one-sided Fisher’s Exact Test P = 0.98, right). Data are for the same 23 patients with available tumor tissues in other panels of this figure. C) Relationship between the total number of mutations called by a tumor-naïve strategy (y-axis) in each patient (x-axis), as a function of evidence for mutations in leukocytes (3 large boxes). Patients detected by tumor-informed ctDNA analysis are indicated by the asterisks (n = 4). Data are for the same 23 patients with available tumor tissues in other panels of this figure. D) Percentage of variants present in both cfDNA and leukocytes that were not in genes previously implicated in clonal hematopoiesis (n = 19).
Figure 4:
Figure 4:. Presence of ctDNA during surveillance precedes radiologic progression and informs disease status of patients undergoing PD-(L)1 blockade.
A) Event chart for patients without ctDNA detected (n = 27) and B) patients with detectable ctDNA at the surveillance timepoint (n=4). Chart depicts RECIST v1.1 status at last follow-up (filled blue squares = progression; open blue squares = no progression), ctDNA detection status by tumor-informed CAPP-Seq (filled orange circles = detected; open orange circles = not detected), duration of PD-(L)1 blockade treatment (grey bar, red outline = ongoing treatment), and PFS after treatment discontinuation (black bar). In patients with ctDNA detected, the earliest scan with the best overall response is indicated. C) An exemplar patient treated with PD-1 plus CTLA-4 blockade who achieved a −60% reduction in tumor volume by RECIST v1.1. cfDNA collected 19 months after initiating treatment showed undetectable ctDNA. These findings were confirmed by resections of both the adrenal and lung lesions that both showed complete pathological response. This patient remains progression-free with undetectable ctDNA at 34 months from treatment initiation. ctDNA levels are shown as average variant allele fraction of all variants monitored. D) A second exemplar patient who achieved a −45% response to PD-1 blockade with progression after ~29 months by RECIST v1.1. ctDNA was initially detected 22 months into treatment, prior to progression by PET-CT. ctDNA levels are shown as average variant allele fraction of all variants monitored. E) A third exemplar patient treated with PD-1 blockade with detectable ctDNA 25 months after starting treatment, confirmed by imaging which revealed an isolated recurrence that was treated with radiotherapy. ctDNA was not detectable ~1 year following localized radiation to the progressing aortocaval lymph node. ctDNA levels are shown as average variant allele fraction of all variants monitored.

References

    1. Gandhi L, Rodríguez-Abreu D, Gadgeel S, Esteban E, Felip E, De Angelis F, et al. Pembrolizumab plus Chemotherapy in Metastatic Non–Small-Cell Lung Cancer. N Engl J Med. 2018;378:2078–92. - PubMed
    1. Hellmann MD, Ciuleanu T-E, Pluzanski A, Lee JS, Otterson GA, Audigier-Valette C, et al. Nivolumab plus Ipilimumab in Lung Cancer with a High Tumor Mutational Burden. N Engl J Med. 2018;378:2093–104. - PMC - PubMed
    1. Reck M, Rodríguez-Abreu D, Robinson AG, Hui R, Csőszi T, Fülöp A, et al. Pembrolizumab versus Chemotherapy for PD-L1–Positive Non–Small-Cell Lung Cancer. N Engl J Med. 2016;375:1823–33. - PubMed
    1. Socinski MA, Jotte RM, Cappuzzo F, Orlandi F, Stroyakovskiy D, Nogami N, et al. Atezolizumab for First-Line Treatment of Metastatic Nonsquamous NSCLC. N Engl J Med. 2018;378:2288–301. - PubMed
    1. Gettinger S, Horn L, Jackman D, Spigel D, Antonia S, Hellmann M, et al. Five-Year Follow-Up of Nivolumab in Previously Treated Advanced Non–Small-Cell Lung Cancer: Results From the CA209–003 Study. J Clin Oncol. 2018;36:1675–84. - PubMed

Publication types

MeSH terms