. 2020 Feb 25;117(8):4320-4327.
doi: 10.1073/pnas.1913810117. Epub 2020 Feb 11.

IGLV3-21 * 01 is an inherited risk factor for CLL through the acquisition of a single-point mutation enabling autonomous BCR signaling

Affiliations

IGLV3-21 * 01 is an inherited risk factor for CLL through the acquisition of a single-point mutation enabling autonomous BCR signaling

Palash C Maity et al. Proc Natl Acad Sci U S A. .

Abstract

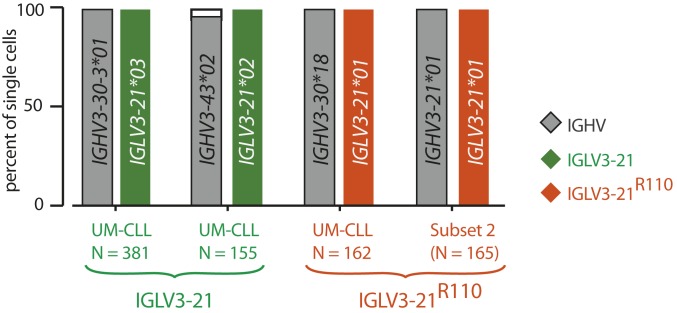
The prognosis of chronic lymphocytic leukemia (CLL) depends on different markers, including cytogenetic aberrations, oncogenic mutations, and mutational status of the immunoglobulin (Ig) heavy-chain variable (IGHV) gene. The number of IGHV mutations distinguishes mutated (M) CLL with a markedly superior prognosis from unmutated (UM) CLL cases. In addition, B cell antigen receptor (BCR) stereotypes as defined by IGHV usage and complementarity-determining regions (CDRs) classify ∼30% of CLL cases into prognostically important subsets. Subset 2 expresses a BCR with the combination of IGHV3-21-derived heavy chains (HCs) with IGLV3-21-derived light chains (LCs), and is associated with an unfavorable prognosis. Importantly, the subset 2 LC carries a single-point mutation, termed R110, at the junction between the variable and constant LC regions. By analyzing 4 independent clinical cohorts through BCR sequencing and by immunophenotyping with antibodies specifically recognizing wild-type IGLV3-21 and R110-mutated IGLV3-21 (IGLV3-21R110), we show that IGLV3-21R110-expressing CLL represents a distinct subset with poor prognosis independent of IGHV mutations. Compared with other alleles, only IGLV3-21*01 facilitates effective homotypic BCR-BCR interaction that results in autonomous, oncogenic BCR signaling after acquiring R110 as a single-point mutation. Presumably, this mutation acts as a standalone driver that transforms IGLV3-21*01-expressing B cells to develop CLL. Thus, we propose to expand the conventional definition of CLL subset 2 to subset 2L by including all IGLV3-21R110-expressing CLL cases regardless of IGHV mutational status. Moreover, the generation of monoclonal antibodies recognizing IGLV3-21 or mutated IGLV3-21R110 facilitates the recognition of B cells carrying this mutation in CLL patients or healthy donors.

Keywords: B cell antigen receptor (BCR); autonomous BCR signaling; chronic lymphocytic leukemia (CLL); immunoglobulin allele IGLV3-21*01.


Conflict of interest statement

Competing interest statement: H.J. is a cofounder of AVA LifeScience GmbH that has filed patents on antibodies recognizing structures involved in autonomous BCR signaling.

Figures

Fig. 1.
Fig. 1.
Rapid identification of light-chain IGLV3-21 and IGLV3-21R110 from CLL cases. (A) Exemplary immunophenotyping histograms to detect wild-type and mutated light chains derived from the IGLV3-21 segment in a CLL subset 2 (LS #42), a UM-CLL (LS #17), and an M-CLL (LS #151) case. Commonly, CLL subset 2 is associated with IGLV3-21–derived LCs carrying R110 as a single-point mutation at the variable–constant region junction. The R110 mutation is referred to as IGLV3-21R110. The antibodies recognize wt IGLV3-21 variants and the mutated IGLV3-21R110 and are referred to as anti-wt IGLV3-21 and anti–IGLV3-21R110, respectively. The expressed IGHV and IGLV alleles and their mutational statuses are indicated alongside. Histograms (red line) show the expression of IGLV3-21 and IGLV3-21R110 using fluorescently labeled anti-wt and anti-R110 antibodies, respectively. The plotted cells are pregated for CLL population by CD19 and CD5 expression after excluding dead cells. The control (gray-filled) CLL sample expresses a non–IGLV3-21 LC. Median fluorescence intensities of anti-wt and anti-R110 binding are indicated within the plots. (B) Pie chart of the immunophenotyping results depicting the proportion of IGLV3-21– (green) and IGLV3-21R110– (red) positive cases in a CLL cohort (n = 154). (C) Pie chart of IGLV/IGKV sequencing results within the same CLL cohort (n = 147), revealing the frequency of IGLV3-21 (green), IGLV3-21R110 (red) including CLL subset 2 (dashed area), as well as other IGLVs (gray) and IGKVs (white). (D) Scatterplot of the IGHV mutational status of 147 CLL cases having sequence results grouped by different IGLV segments as follows: IGLV3-21R110 cases (orange), IGLV3-21 cases (green), and others (gray). The subset 2 CLL cases (black) are depicted within IGLV3-21R110–positive cases. The dashed line indicates the conventional 98% cutoff of IGHV sequence homology to its germline variant that distinguishes UM- and M-CLL cases. While <98% IGHV sequence homology defines an M-CLL case, ≥98% IGHV sequence homology defines an aggressive UM-CLL case. (E) Bar graph of relative AICDA expression (AU) analyzed by qRT-PCR of IGLV3-21R110–negative (black) and IGLV3-21R110–positive (orange) cases, both of which are subgrouped into UM- (open bars) and M-CLL (gray-filled) cases according to IGHV mutational status, and compared with healthy donor (blue) samples by using the 2-tailed Mann–Whitney U test. The plot depicts a median bar along with the individual sample values, and the numbers of samples per group are depicted below. ns, nonsignificant; **P < 0.01.
Fig. 2.
Fig. 2.
Clonality of IGLV3-21R110 CLL cases at the single-cell level. Horizontal bar graph of IGHV and IGLV allele usage determined by single-cell paired HC and LC sequence analyses of 2 exemplary IGLV3-21 (green) and 2 exemplary IGLV3-21R110 (orange) CLL cases. Numbers of analyzed single cells are individually depicted. The unique IGHV and IGLV genes and alleles for each case are depicted inside the bars.
Fig. 3.
Fig. 3.
IGLV3-21R110 is associated with decreased TTFT and OS (AC I; n = 122). (A) Kaplan–Meier analysis for treatment-free survival from diagnosis of IGLV3-21R110–positive CLL patients compared with IGLV3-21R110–negative M-CLL and UM-CLL patients classified by IGHV identity. (B) Kaplan–Meier analysis for overall survival of IGLV3-21R110–positive CLL patients compared with IGLV3-21R110–negative M-CLL and UM-CLL patients. (C) Kaplan–Meier analysis for treatment-free survival from diagnosis of IGLV3-21R110–positive CLL patients according to IGHV mutational status. (D) Kaplan–Meier analysis for OS from diagnosis of IGLV3-21R110–positive CLL patients according to IGHV mutational status. All data are from AC I, and the depicted P values were obtained from log-rank (Mantel–Cox) analyses.
Fig. 4.
Fig. 4.
IGLV3-21R110 is as severe as UM-CLL cases within a high-risk cohort (AC III; n = 90). (A) Kaplan–Meier analysis for progression-free survival (Left) and overall survival (Right) of IGLV3-21R110–positive CLL patients compared with IGLV3-21R110–negative M-CLL and UM-CLL patients classified by IGHV identity. (B) Similar Kaplan–Meier analyses as A, but for a patient who received no allogeneic PBSCT. All data are from AC III, and the depicted P values were obtained from log-rank (Mantel–Cox) analyses.
Fig. 5.
Fig. 5.
IGLV3-21R110 CLL shares cellular phenotypes of both M- and UM-CLL cases. (A) PhenoGraph analyses of M-, UM-, and IGLV3-21R110–positive CLL cases, all compared with peripheral B cells from HDs. Arrangement, numbering, and coloring of different phenotypic clusters from HD and M- and UM-CLL as well as R110 cases are depicted below the PhenoGraph. For comparison, HD clusters (1 through 3) are depicted in grayscale whereas R110 clusters (6, 7, 10, 11, 13, and 15 through 17) are highlighted purple. (B) Distribution and overlap of M- (black), UM- (green), and IGLV3-21R110 (red) CLL cases in terms of cluster sharing. (C) Interleaved bar graph of the percentage of cells from M-, UM-, and IGLV3-21R110 CLL distributed into phenotypic clusters 1 through 17. Data represent the mean ± SD of 5 samples from each of the M-, UM-, and IGLV3-21R110 CLL cases. The dashed line represents 5% cutoff.
Fig. 6.
Fig. 6.
CLL-derived IGLV3-21R110 LC boosts autonomous signaling. (A, Left and Middle) BCR expression (IgM HC and Igλ LC) in TKO cells reconstituted with CLL-derived HCs together with reverted IGLV3-21G110 (Left) or IGLV3-21R110 (Middle) LC variants. (A, Right) Overlaid immunophenotyping histograms analyzing the IGLV3-21R110 expression in the same reconstituted TKO cell using a fluorescently labeled anti-R110 antibody. (B) Exemplary Ca2+ release kinetics of the original BCR derived from UM-CLL (LS #83) revealing autonomous BCR signaling and containing an R110-mutated LC (IGLV3-21R110; Left) as compared with the reverted LC containing a germline G110 (IGLV3-21G110; Right).
Fig. 7.
Fig. 7.
R110-mutated LC allele IGLV3-21*01 is rare in HDs and is causative of autonomous signaling. (A) Alignment of LC consensus sequences derived from different groups (IGLV3-21 and IGLV3-21R110 CLL cases and CLL subset 2 cases; all from AC I) compared with the reference CLL subset 2 LC, revealing that the K16 residue and the YDSD motif required for homotypic interaction are conserved in virtually all IGLV3-21R110 LCs. (B) Stacked bar graph for the frequencies of the three different IGLV3-21 alleles in IGLV3-21– and IGLV3-21R110–expressing CLL cases compared with stereotypic CLL subset 2 within AC I patients, revealing the prevalence of the IGLV3-21*01 allele among IGLV3-21R110–expressing CLL samples. (C) Cumulative stacked frequencies of R110 (black bars) and non-R110 (open bars), which include S110 (SI Appendix, Fig. S7D) and germline unmutated G110, of different IGLV genes obtained from 6 HDs, demonstrating that IGLV3-21R110 has the lowest occurrence (highlighted column), as indicated. Different IGLV genes are sorted by descending frequency of germline residue G110. (D) Linear regression of the numbers of R110- and S110-positive LCs and IGLV3-21R110 LCs against total IGLV sequences in each of 6 analyzed HDs, revealing that, compared with R110- and S110-positive LCs, IGLV3-21R110 LCs have the lowest average expectation independent of sampling size. The obtained average expectations of different LCs are provided along with the labels. (E) Sequence alignment of 7 identified IGLV3-21R110 rearrangements from the analyzed HDs as compared with a CLL subset 2-derived IGLV3-21R110 LC. This alignment reveals that IGLV3-21R110 rearrangements originating from HDs lack the combination of the K16 residue (gray-shaded) and YDSD motif (green-shaded) required for homotypic interaction. Residues are numbered according to subset 2-derived IGLV3-21R110 (Upper) as well as IMGT guidelines (Lower). Residues differing from subset 2-derived IGLV3-21R110 and those with somatic mutations are indicated by red and blue, respectively. (F) Stacked bar graph representing the frequencies of different alleles of the IGLV3-21 gene among African, American, East Asian, European, and South Asian populations as annotated by the 1000 Genomes Project from the Ensembl GRCh37 genome browser. (G) Stacked bar graph of IGLV3-21 allele frequencies among the subpopulations of the EAS and EUR groups. CDX, Chinese Dai in Xishuangbanna; CEU, Utah residents with northern and western European ancestry; CHB, Han Chinese in Beijing; CHS, southern Han Chinese; FIN, Finnish in Finland; GBR, British in England and Scotland; TSI, Toscani in Italy. (H) Comparative analyses of Ca2+ release kinetics for a BCR from a UM-CLL (LS #83) carrying the original LC allele IGLV3-21*01 (red) compared with engineered alleles IGLV3-21*02 (blue) and allele IGLV3-21*03 (green) expressing R110. The overlay of median Ca2+ release kinetics includes a non-CLL BCR (gray) as control.

References

    1. Chen Q., et al. , Economic burden of chronic lymphocytic leukemia in the era of oral targeted therapies in the United States. J. Clin. Oncol. 35, 166–174 (2017). - PMC - PubMed
    1. Hallek M., Chronic lymphocytic leukemia: 2015 update on diagnosis, risk stratification, and treatment. Am. J. Hematol. 90, 446–460 (2015). - PubMed
    1. Brenner H., Gondos A., Pulte D., Trends in long-term survival of patients with chronic lymphocytic leukemia from the 1980s to the early 21st century. Blood 111, 4916–4921 (2008). - PubMed
    1. Damle R. N., et al. , Ig V gene mutation status and CD38 expression as novel prognostic indicators in chronic lymphocytic leukemia. Blood 94, 1840–1847 (1999). - PubMed
    1. Hamblin T. J., Davis Z., Gardiner A., Oscier D. G., Stevenson F. K., Unmutated Ig V(H) genes are associated with a more aggressive form of chronic lymphocytic leukemia. Blood 94, 1848–1854 (1999). - PubMed

Publication types

MeSH terms

Substances

LinkOut - more resources