. 2020 Feb 25;117(8):3996-4006.
doi: 10.1073/pnas.1902469117. Epub 2020 Feb 11.

Early Last Interglacial ocean warming drove substantial ice mass loss from Antarctica

Affiliations

Early Last Interglacial ocean warming drove substantial ice mass loss from Antarctica

Chris S M Turney et al. Proc Natl Acad Sci U S A. .

Abstract

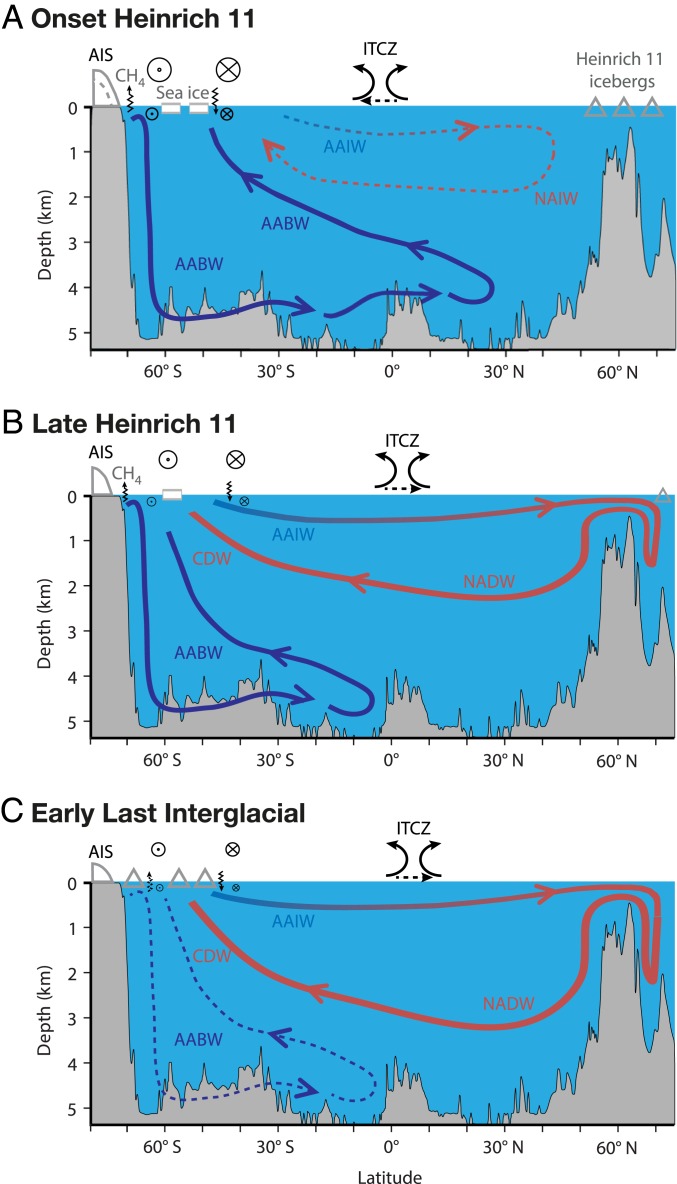
The future response of the Antarctic ice sheet to rising temperatures remains highly uncertain. A useful period for assessing the sensitivity of Antarctica to warming is the Last Interglacial (LIG) (129 to 116 ky), which experienced warmer polar temperatures and higher global mean sea level (GMSL) (+6 to 9 m) relative to present day. LIG sea level cannot be fully explained by Greenland Ice Sheet melt (∼2 m), ocean thermal expansion, and melting mountain glaciers (∼1 m), suggesting substantial Antarctic mass loss was initiated by warming of Southern Ocean waters, resulting from a weakening Atlantic meridional overturning circulation in response to North Atlantic surface freshening. Here, we report a blue-ice record of ice sheet and environmental change from the Weddell Sea Embayment at the periphery of the marine-based West Antarctic Ice Sheet (WAIS), which is underlain by major methane hydrate reserves. Constrained by a widespread volcanic horizon and supported by ancient microbial DNA analyses, we provide evidence for substantial mass loss across the Weddell Sea Embayment during the LIG, most likely driven by ocean warming and associated with destabilization of subglacial hydrates. Ice sheet modeling supports this interpretation and suggests that millennial-scale warming of the Southern Ocean could have triggered a multimeter rise in global sea levels. Our data indicate that Antarctica is highly vulnerable to projected increases in ocean temperatures and may drive ice-climate feedbacks that further amplify warming.

Keywords: Antarctic ice sheets; marine ice sheet instability (MISI); paleoclimatology; polar amplification; tipping element.


Conflict of interest statement

The authors declare no competing interest.

Figures

Fig. 1.
Fig. 1.
Location and age profile of the Patriot Hills BIA. (A) Location of Antarctic ice and marine records discussed in this study and austral spring–summer (October to March) SST trends (over the period 1981 to 2010; HadISST data). (B) Trace gas (circles), tephra (triangles), and boundary (square) age solutions for surface ice along transect B–B′ relative to an arbitrary datum along the transect (displayed in D). The dashed lines denote unconformities D0–D2 at their surface expression. (C) Basal topography of the Ellsworth Subglacial Highlands (West Antarctica) with the locations of airborne radio-echo sounding transect A–A′ (displayed in E) and Rutford Ice Stream (IS) (29). The Horseshoe Valley, Independence, and Ellsworth troughs are given by the initials HV, IT, and ET, respectively. (D) The location of Patriot Hills in Horseshoe Valley (LIMA background image) with the BIA climate line (marked by transect B–B′), dominant ice flow direction, and distance to grounding line. (E) Airborne radio-echo sounding cross-section of ice within Horseshoe Valley, Independence, and Ellsworth troughs (modified from ref. 29). Digitization highlights basal topography (brown), lower basal ice unit (gray), and upper basal ice unit (red) as well as internal stratigraphic features (black for observed, dashed for inferred, and purple for best estimate).
Fig. 2.
Fig. 2.
Climate, ocean circulation, and sea level changes over the past 140 ky. (A) δ18O record from the North Greenland (NGRIP) ice core (106, 107). (B) Bermuda Rise 231Pa/230Th data (reversed axis; 1σ uncertainty) with dashed horizontal line denoting production ratio of 0.093 marking sluggish/absent AMOC (42). Selected North Atlantic Heinrich (H) events and reduced AMOC shown. (C) Biogenic opal flux from ODP Site 1094 (53.2°S) as a measure of wind-driven upwelling in the Southern Ocean (45). (D) Comparison between the recently compiled global atmospheric methane time series (red line; 2σ envelope) (27) with the methane record from the West Antarctic Patriot Hills (black circles with 1σ uncertainty; open circles mark anomalously high-concentration data excluded from age model; Methods). (E) The Patriot Hills record. Pie chart representation (circle and segments) of percentage methane-utilizing bacteria in 16S rRNA samples from Patriot Hills; crosses denote absence of these bacteria (Methods). Triangles denote the presence of geochemically identified tephra layers in the Patriot Hills transect, with δD (and mean Holocene; blue envelope 1σ) values. The gray shading denotes the timing of the surface elevation change across the WSE as indicated by the hiatus in the Patriot Hills sequence and inferred substantial Antarctic ice mass loss, consistent with the reported divergence of the isotopic signal observed between the horizontal Mount Moulton ice core record from the WAIS and East Antarctic ice cores (16, 17, 33), and peak global sea level (10). (F) Temporal changes in ocean productivity with peak productivity (PP) (green shading) during interglacials and subsequent enhanced content of calcareous microfossils in Antarctic continental margin sediments (red shading) (34). The dashed black line shows position of tephra identified in the Patriot Hills (−340 m), Dome Fuji (1,785.14 m), and Tephra B in marine sediments from the West Antarctic continental margin. (G) East Antarctic Dome Fuji δ18O record (28, 33). (H) Reconstructed relative sea level curve with 2σ envelope (10). The yellow shading highlights the timing of iceberg-rafted Heinrich debris event 11 (H11), when large amounts of iceberg-rafted debris were deposited in the North Atlantic (43) and the 231Pa/230Th ratio on Bermuda Rise shifted toward the production ratio of 0.093, representative of sluggish or absent AMOC (42); the circled numbers 1 and 2 denote enhanced upwelling-induced warming in the Southern Ocean and Antarctic ice mass loss, respectively. (I) Close-up of Termination II and the onset of the LIG highlighting the high-precision correlation enabled by the Patriot Hills tephra (∼130 ky) and the carbon isotopic composition of benthic foraminifera from ODP Site 1089 and ODP Site 1094 (46) (Fig. 1A). The cream shading highlights the inferred collapse of the AABW reported from ODP 1094 (46). Dashed vertical line denotes LIG tephra in Patriot Hills, Dome Fuji, and West Antarctic continental margin.
Fig. 3.
Fig. 3.
Average trace element concentrations of Patriot Hills tephra at −340 m and Tephra B from marine sediment cores PC108 (4.65-m depth) and PC111 (6.86-m depth) (34) normalized to Primitive Mantle (108). (A) Biplots show comparison between selected trace element concentrations of the tephra in the different sequences. Error bars on plots show 2σ of replicate analyses of MPI-DING StHs6/80-G (87), but errors are typically smaller than the data symbols (BE).
Fig. 4.
Fig. 4.
Ocean–atmospheric interactions during Termination II and the LIG. Panels show changing Atlantic meridional overturning circulation (AMOC) in response to iceberg discharge (A and B) in the North Atlantic (Heinrich event 11) during Termination II and (C) from the Antarctic Ice Sheet (AIS) during the LIG, with inferred shifts in atmospheric circulation including midlatitude Southern Hemisphere westerly (crossed circle) airflow and Intertropical Convergence Zone (ITCZ) (14, 43, 45, 46, 48). The vertical arrows denote CH4 and heat flux associated with Antarctic coastal easterly (dot in circle) and westerly (crossed circle) airflow (30, 47). AABW, AAIW, CDW, NAIW, and NADW define Antarctic Bottom Water, Antarctic Intermediate Water, Circumpolar Deep Water, North Atlantic Intermediate Water, and North Atlantic Deep Water, respectively.
Fig. 5.
Fig. 5.
Modeled Antarctic ice sheet evolution under idealized forcing scenarios consistent with range of inferred LIG temperatures. (A) Sea level equivalent mass loss for ice sheet simulations forced by a range of air and ocean temperature anomalies relative to present day. “dT” and “dOT” describe atmospheric and ocean temperature anomalies, respectively. BD show Antarctic Ice Sheet extent and elevation with 2 °C warmer ocean temperatures over time intervals of 1, 2, and 5 ky, respectively (with no atmospheric warming); equivalent sea level contribution is given in the Bottom Left corner of each panel. Locations of Patriot Hills (Ellsworth Mountains, WAIS) and ice core records discussed in this study are shown in B. Inset box in B outlines region shown in Fig. 6.
Fig. 6.
Fig. 6.
Bed (black line) and surface (blue) elevation changes at Patriot Hills (Ellsworth Mountains, WAIS) in response to 2 °C warmer ocean temperatures over a time interval of 5 ky (with no atmospheric warming) (A). Bed (black line) and surface (blue) elevation changes vs. time, with phases of the prevalence of particular processes, such as ice shelf collapse (mint shaded), regional uplift (gray shaded), and dynamic thinning (light-brown shaded), highlighted. (BG) Selected time slices corresponding to dashed lines in A showing ice shelf extent and ice sheet elevation in the Weddell Sea Embayment (WSE) over the first 3 ky. Location of Patriot Hills is marked by the red square; the gray shaded areas are ice shelf covered, while the white areas are free of both grounded and floating glacial ice.

References

    1. Ritz C., et al. , Potential sea-level rise from Antarctic ice-sheet instability constrained by observations. Nature 528, 115–118 (2015). - PubMed
    1. Golledge N. R., et al. , The multi-millennial Antarctic commitment to future sea-level rise. Nature 526, 421–425 (2015). - PubMed
    1. DeConto R. M., Pollard D., Contribution of Antarctica to past and future sea-level rise. Nature 531, 591–597 (2016). - PubMed
    1. Dutton A., et al. , Sea-level rise due to polar ice-sheet mass loss during past warm periods. Science 349, aaa4019 (2015). - PubMed
    1. Mercer J. H., West Antarctic Ice Sheet and CO2 greenhouse effect: A threat of disaster. Nature 271, 321–325 (1978).

Publication types

LinkOut - more resources