

Review
doi: 10.1104/pp.19.01252.
Epub 2020 Feb 11.
Structural Insights into the Plant Immune Receptors PRRs and NLRs
Affiliations
- PMID: 32047048
- PMCID: PMC7140948
- DOI: 10.1104/pp.19.01252
Item in Clipboard
Review
Structural Insights into the Plant Immune Receptors PRRs and NLRs
Plant Physiol.
2020 Apr.
Abstract
Recent progresses made in structural analysis of plant PRRs and NLRs show the advancements in cryo-EM structural biology.
Figures
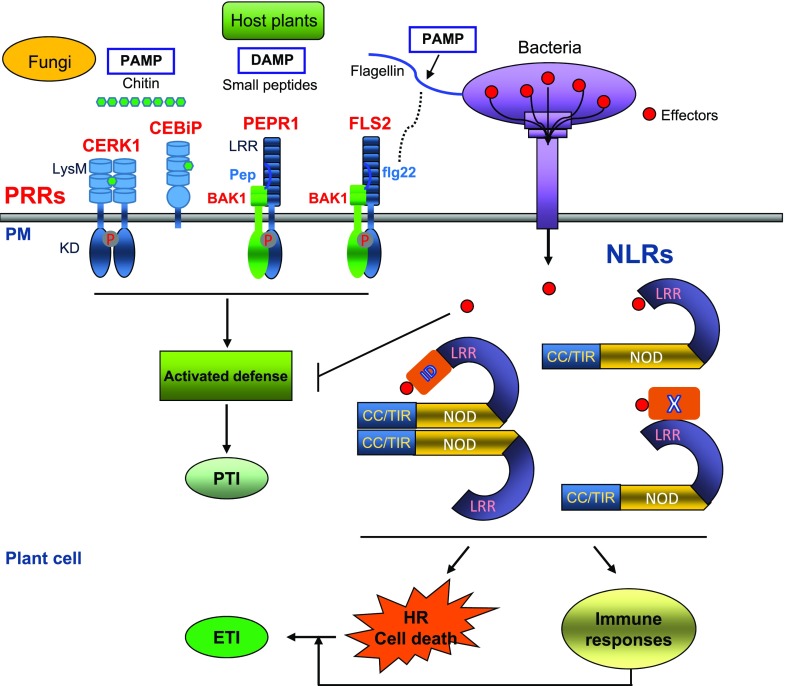
A schematic view of the two-tiered plant immune system. Recognition of PAMPs like bacterial flagellin and fungal chitin or DAMPs like secreted small peptides by PRRs induces intracellular signaling, leading to PTI. Successful pathogens deliver effector proteins (red dots) into the plant cell to dampen PTI. In some host plants, effector proteins are specifically recognized by the intracellular NLR immune receptors via different strategies, inducing effector-triggered immunity (ETI) that includes expression of immune-related genes and localized cell death referred to as HR. X, a host molecule guarded by NLRs; ID, integrated domain.
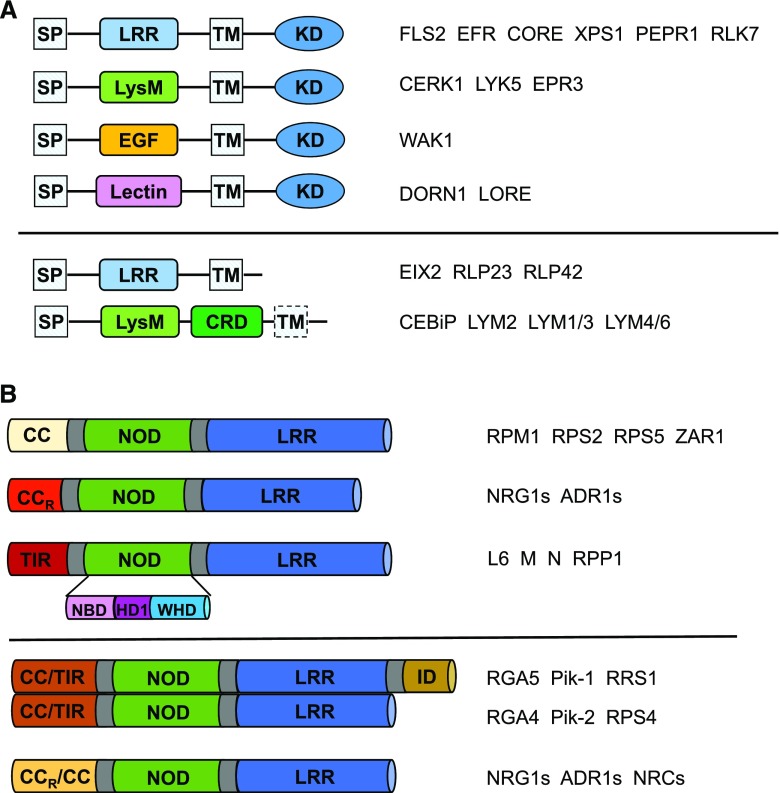
Plant PRRs and NLRs. A, Schematic diagrams depicting domain structures of different classes of plant PRRs. Upper, The RK-PRRs. Lower, The RLP-PRRs. The representatives in each class are shown on the right. SP, signal peptide; EGF, epidermal growth factor. B, Schematic diagrams of domain structures of different NLRs. The representatives in each class are shown on the right. Upper, Domain structures of plant NLRs based on their variable N-terminal domains. Lower, Domain structures of plant-paired NLRs and helper NLRs.
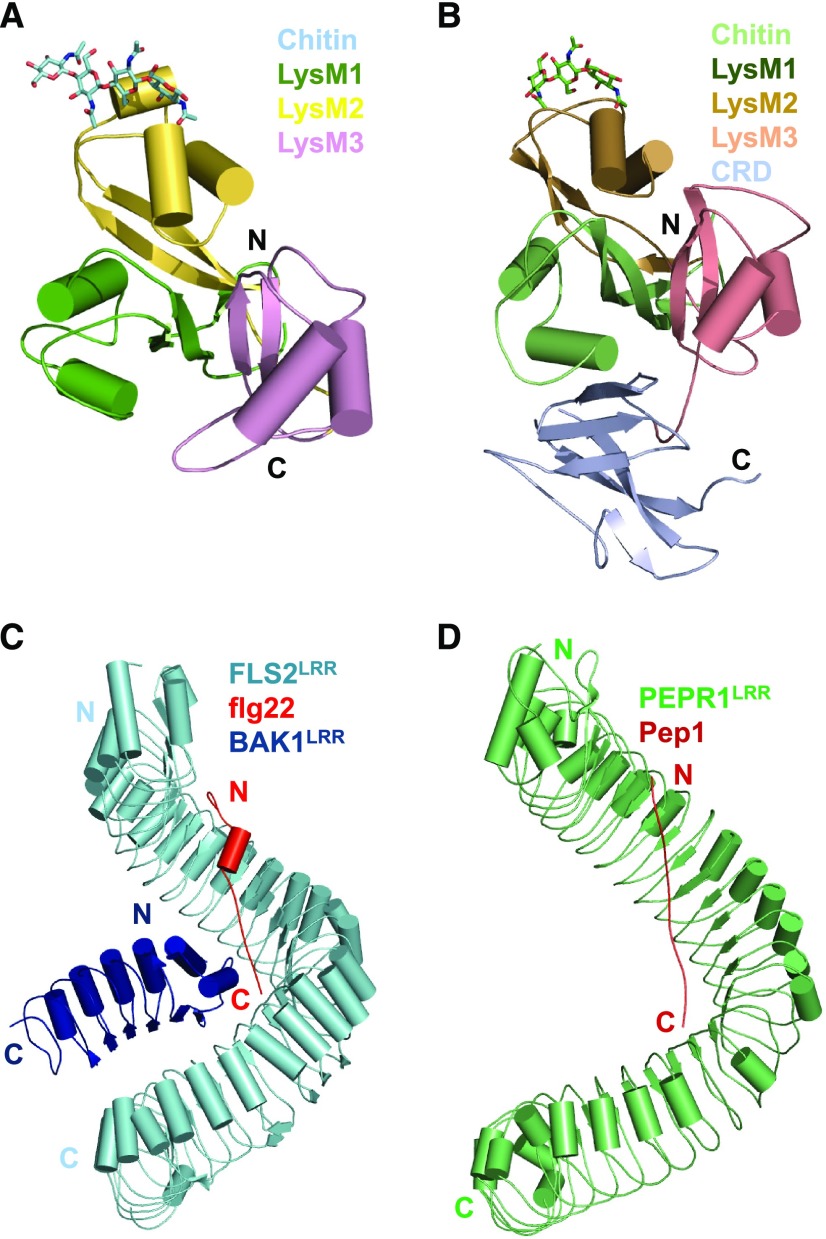
PAMP/DAMP recognition and activation of PRRs. A, Recognition of chitin by AtCERK1. Shown in the figure is the crystal structure of AtCERK1ECD in complex with a chito-pentamer (PDB: 4EBZ). AtCERK1ECD is shown in cartoon representation. Four chitin residues well defined in the structure are shown in stick representation. Color codes for three LysM domains are indicated. N, N terminus; C, C terminus. B, Recognition of chitin by OsCEBiPECD. Shown in the figure is the crystal structure of OsCEBiPECD in complex with a chito-tetramer (PDB: 5JCE). C, Flg22 acts as molecular glue to induce heterodimerization of FLS2 with its coreceptor BAK1. Shown is the overall structure of the FLS2LRR–flg22–BAK1LRR complex in cartoon representation (PDB: 4MN8). The color codes are indicated. D, Recognition of Pep1 by its receptor PERP1. The crystal structure of PERP1LRR in complex with AtPep1 is shown in cartoon representation (PDB: 5GR8).
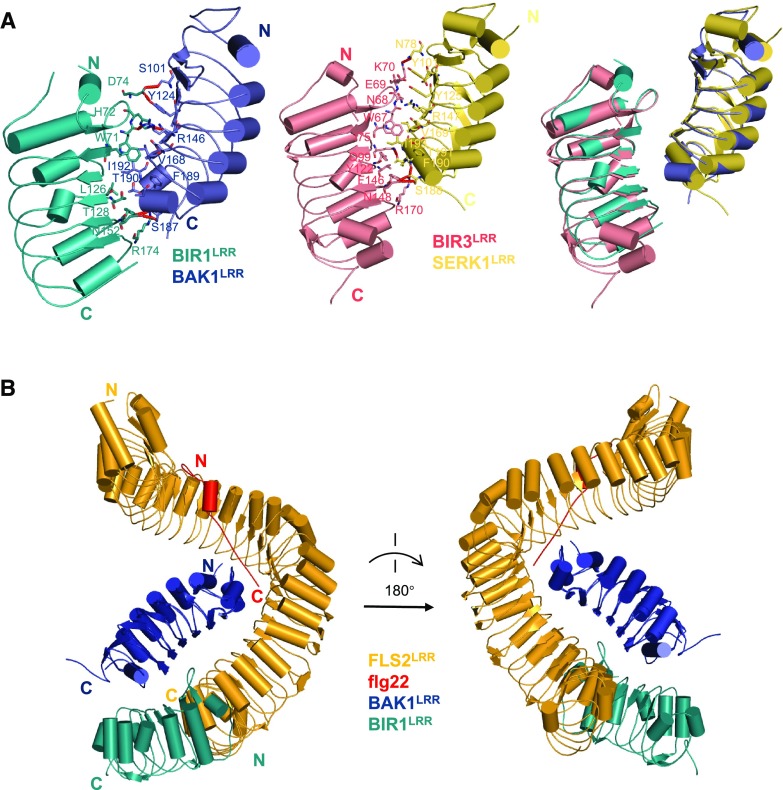
Sequestering of the coreceptor of PRRs by BIRs. A, Crystal structures of the BIR1LRR–BAK1LRR complex (left) and the BIR3LRR–SERK1LRR complex (middle, PDB: 6FG8), and the structural alignment of these two complexes (right). Residues mediating detail interactions between BIR1LRR–BAK1LRR and BIR3LRR–SERK1LRR are shown in stick. B, Structural alignment between FLS2LRR–flg22–BAK1LRR complex and BIR1LRR–BAK1LRR. BAK1LRR was used as the template for the alignment.
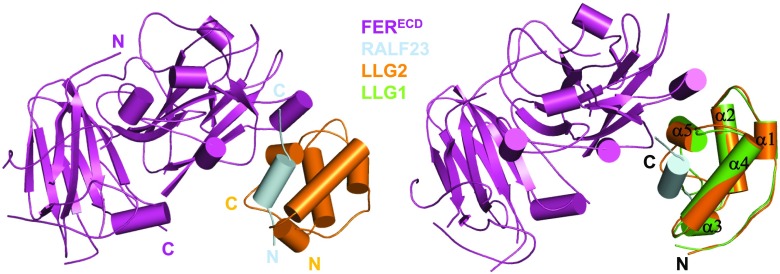
Structure of the RLF23–LLG2–FERECD complex. Left: Overall structure of the RLF23–LLG2–FERECD complex (PDB: 6A5E) shown in cartoon. The color codes are indicated. N, N terminus; C, C terminus. Right: Structural superposition of the RLF23–LLG2–FERECD complex and apo-LLG1 (PDB: 6A5D). The five α-helixes of LLG1 and LLG2 are indicated.
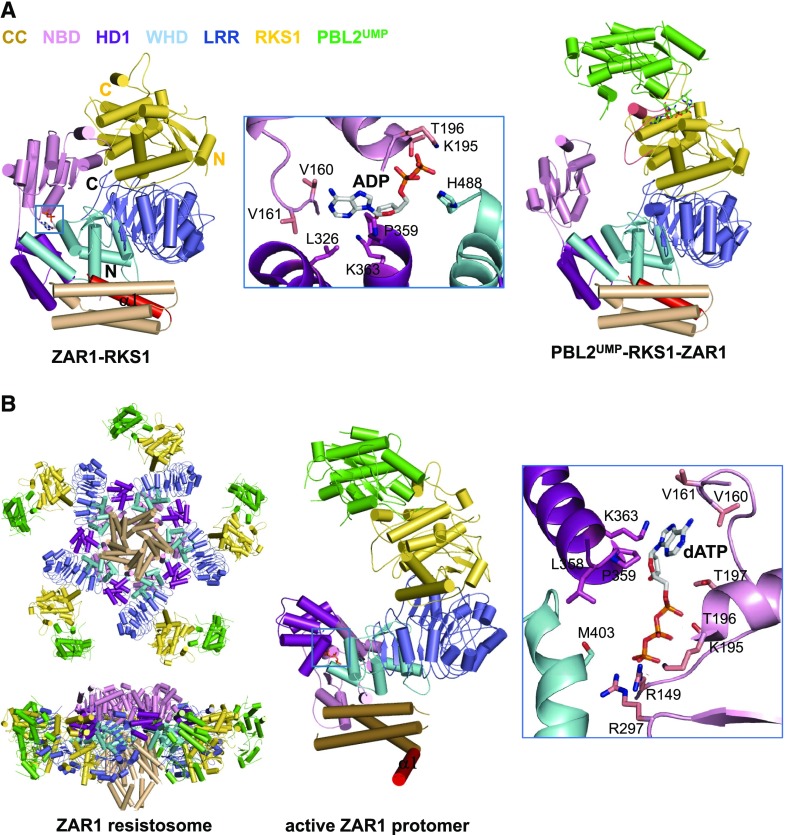
Auto-inhibition, priming, and activation of ZAR1. A, Overall structure of the ZAR1–RKS1 complex (PDB: 6J5W) shown in cartoon (left). The α1 is labeled in red. The bound ADP molecule is shown in stick and its detailed interactions with ZAR1 are shown in the middle representation.Overall structure of the PBL2UMP–RKS1–ZAR1 complex (PDB: 6J5V) shown in the same orientation as that in the left (right). The loop region that is disordered in the ZAR1–RKS1 complex is shown in salmon. B, Structure of the ZAR1 resistosome (PDB: 6J5T; left). Structure of an active ZAR1 protomer (middle). The α1 is labeled in red. The detailed interactions between dATP and ZAR1NOD (right)
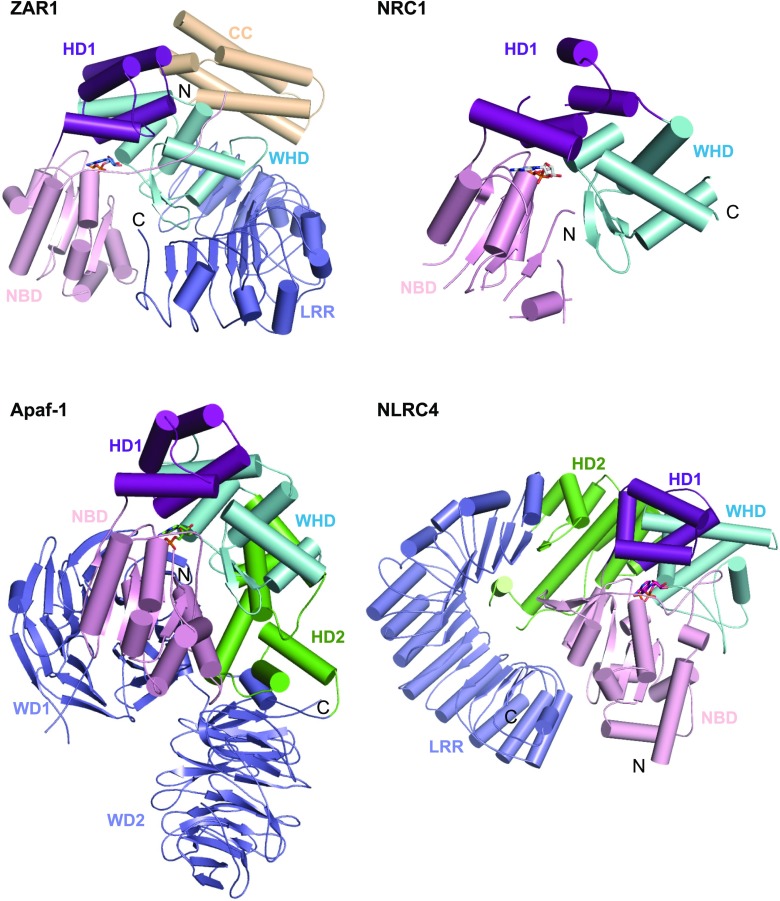
Structural comparison of inactive ZAR1, NRC1, Apaf-1, and NLRC4. Structures indicated are shown with their NBD–HD1–WHD segments aligned. ZAR1 (PDB: 6J5W), NRC1 (PDB: 6S2P), Apaf-1 (PDB: 3SFZ), and NLRC4 (PDB: 4KXF).
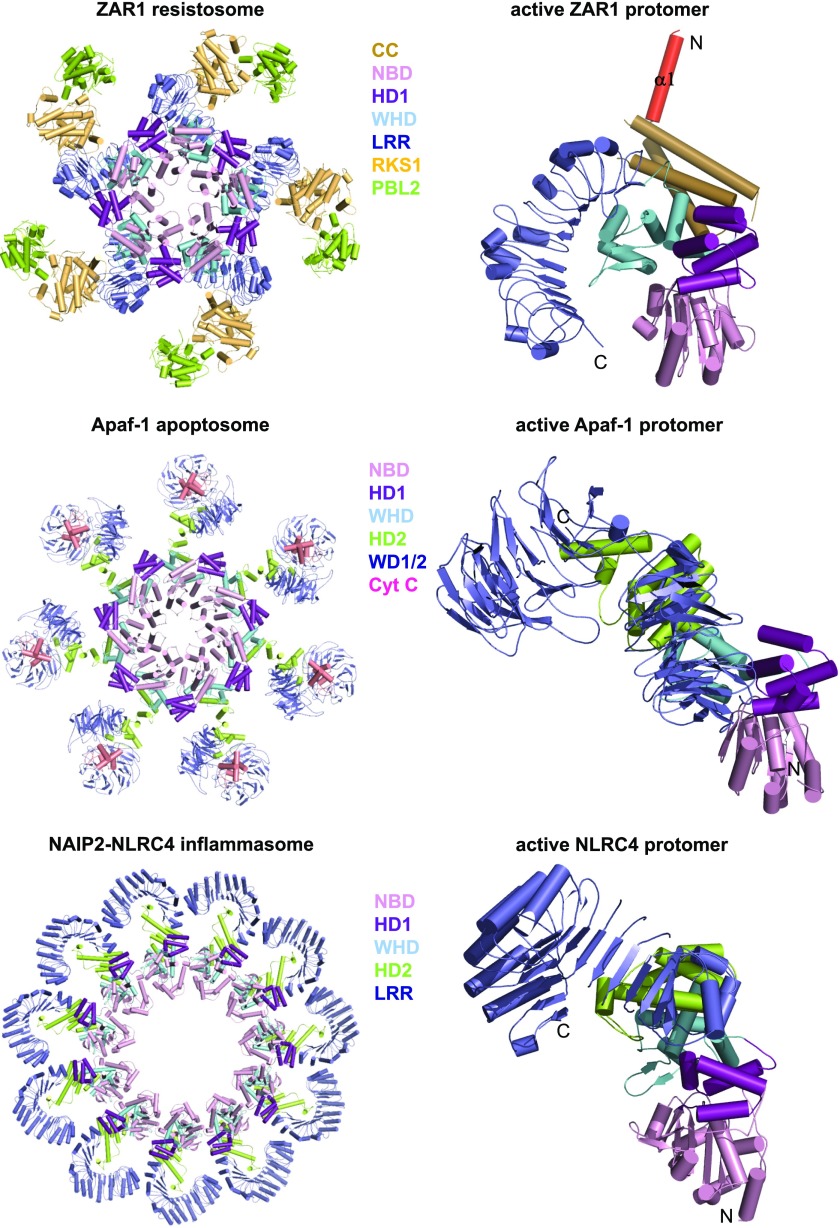
Structural comparison of active ZAR1, Apaf-1, and NLRC4. Shown in the left column are the structures of the ZAR1 resistosome (PDB: 6J5T), the Apaf-1 apoptosome (PDB: 3JBT), and the NLRC4 inflammasome (PDB: 3JBL). Protomers of these three complexes are shown in the right column with the NBD1–HD1–WHD segments aligned.
References
-
- Böhm H, Albert I, Fan L, Reinhard A, Nürnberger T(2014) Immune receptor complexes at the plant cell surface. Curr Opin Plant Biol 20: 47–54 - PubMed
Publication types
MeSH terms
Substances
LinkOut - more resources
Full Text Sources
Other Literature Sources
