. 2020 Feb 11;5(1):e00587-19.
doi: 10.1128/mSystems.00587-19.

The Signal and the Noise: Characteristics of Antisense RNA in Complex Microbial Communities

Affiliations

The Signal and the Noise: Characteristics of Antisense RNA in Complex Microbial Communities

Thomas Yssing Michaelsen et al. mSystems. .

Abstract

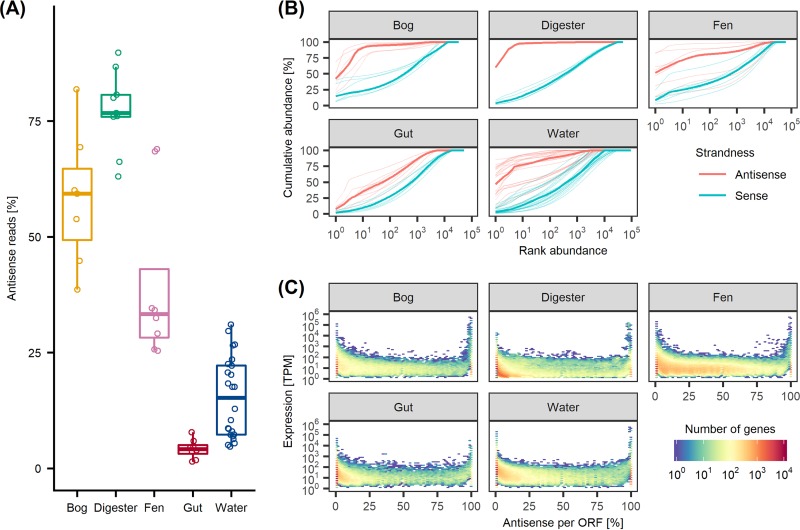
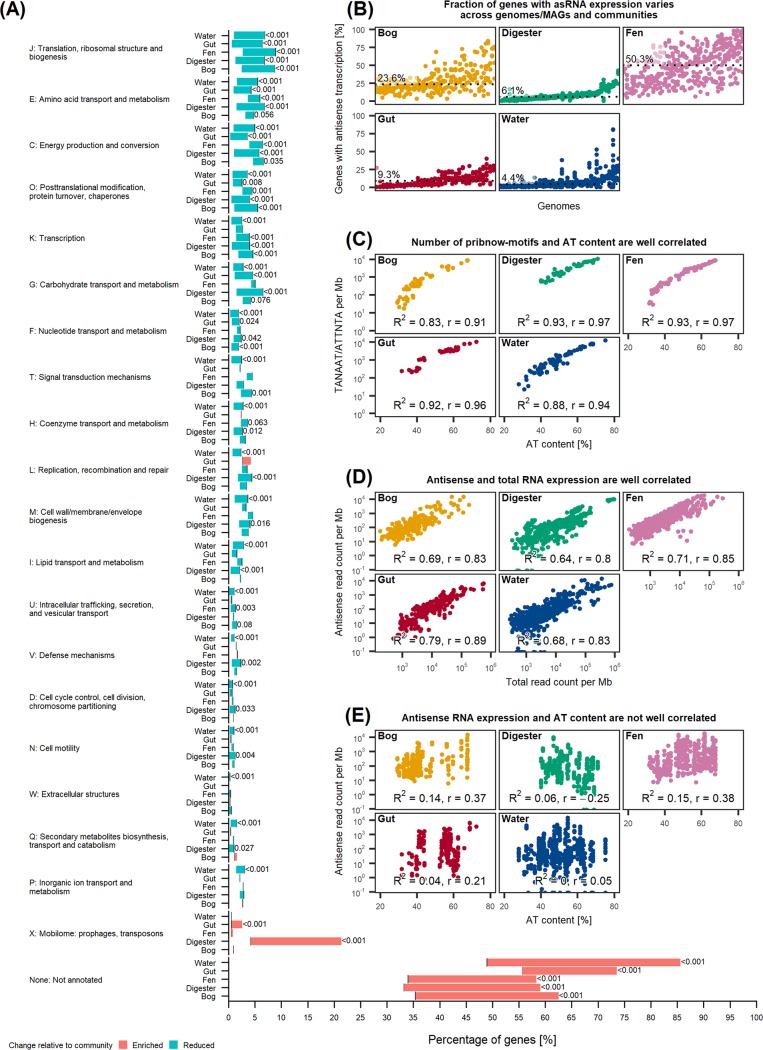
High-throughput sequencing has allowed unprecedented insight into the composition and function of complex microbial communities. With metatranscriptomics, it is possible to interrogate the transcriptomes of multiple organisms simultaneously to get an overview of the gene expression of the entire community. Studies have successfully used metatranscriptomics to identify and describe relationships between gene expression levels and community characteristics. However, metatranscriptomic data sets contain a rich suite of additional information that is just beginning to be explored. Here, we focus on antisense expression in metatranscriptomics, discuss the different computational strategies for handling it, and highlight the strengths but also potentially detrimental effects on downstream analysis and interpretation. We also analyzed the antisense transcriptomes of multiple genomes and metagenome-assembled genomes (MAGs) from five different data sets and found high variability in the levels of antisense transcription for individual species, which were consistent across samples. Importantly, we challenged the conceptual framework that antisense transcription is primarily the product of transcriptional noise and found mixed support, suggesting that the total observed antisense RNA in complex communities arises from the combined effect of unknown biological and technical factors. Antisense transcription can be highly informative, including technical details about data quality and novel insight into the biology of complex microbial communities.IMPORTANCE This study systematically evaluated the global patterns of microbial antisense expression across various environments and provides a bird's-eye view of general patterns observed across data sets, which can provide guidelines in our understanding of antisense expression as well as interpretation of metatranscriptomic data in general. This analysis highlights that in some environments, antisense expression from microbial communities can dominate over regular gene expression. We explored some potential drivers of antisense transcription, but more importantly, this study serves as a starting point, highlighting topics for future research and providing guidelines to include antisense expression in generic bioinformatic pipelines for metatranscriptomic data.

Keywords: RNAseq; antisense RNA; cis-antisense RNA; meta-analysis; metatranscriptomics; review.


Figures

FIG 1
FIG 1
Antisense transcription is a substantial amount of the data and dominated by few genes. (A) Percentage of sequenced reads which are antisense for each sample, grouped by community. (B) Rank-abundance curves for all samples within each community, colored by strandness. The x axis lists genes ranked in descending order according to relative abundance, while the y axis shows the cumulative abundance. Bold lines indicate the median for each colored group. (C) Relative amount of antisense expression for each observation (x axis) and total antisense and sense expression normalized to transcripts per million (TPM) (y axis). For results in this figure, sample-wide data sets were used (see Materials and Methods for details). ORF, open reading frame.
FIG 2
FIG 2
Antisense transcription is not function specific and may be driven by several factors. (A) Listed from top to bottom is the enrichment/reduction for each COG functional category for each community, with the x axis showing the percentage of genes in either the COG functional category or the entire community. Note the break between 10% and 50% on the x axis, where the group of nonannotated genes extends across the whole figure from left to right. The black vertical line at each horizontal bar indicates the percentage of annotated genes in the whole community, while bars indicate either percent reduction or enrichment in the subset of antisense-enriched genes, defined as genes with ≥95% of reads being antisense RNA. Only two-tailed adjusted P values of <0.2 are shown (see Materials and Methods for details). Shown are total numbers of genes and antisense-enriched subsets in digester (total, 48,889; subset, 936 [1.9%]), human gut (total, 53,059; subset, 927 [1.8%]), water (total, 95,695; subset, 5,339 [5.6%]), fen (total, 62,381; subset, 1,759 [2.8%]), and bog (total, 33,258; subset, 1,470 [4.4%]) samples. (B) For each community, genomes are plotted along the x axis, and the percentages of genes with significant (adjusted P value of <0.05) antisense expression within each genome are plotted on the y axis. Points located above the same genome represent the same genome across different samples. For each community, genomes are ordered along the x axis according to the median. Dotted lines and values indicate the median genome-wide percentages of genes with antisense transcription for each community. (C) Percent AT content for a given genome (x axis) and the number of Pribnow motifs in both directions of the sequence, normalized by genome length (y axis). (D) Number of sense RNA counts (x axis) and antisense RNA counts (y axis), normalized by genome length. (E) Percent AT content for a given genome (x axis) and number of antisense RNA read counts normalized by genome length (y axis). For this plot, genome-wide data sets were used (see Materials and Methods for details).

References

    1. Sorek R, Cossart P. 2010. Prokaryotic transcriptomics: a new view on regulation, physiology and pathogenicity. Nat Rev Genet 11:9–16. doi:10.1038/nrg2695. - DOI - PubMed
    1. Gorski SA, Vogel J, Doudna JA. 2017. RNA-based recognition and targeting: sowing the seeds of specificity. Nat Rev Mol Cell Biol 18:215–228. doi:10.1038/nrm.2016.174. - DOI - PubMed
    1. Hör J, Gorski SA, Vogel J. 2018. Bacterial RNA biology on a genome scale. Mol Cell 70:785–799. doi:10.1016/j.molcel.2017.12.023. - DOI - PubMed
    1. Bao G, Wang M, Doak TG, Ye Y. 2015. Strand-specific community RNA-seq reveals prevalent and dynamic antisense transcription in human gut microbiota. Front Microbiol 6:896. doi:10.3389/fmicb.2015.00896. - DOI - PMC - PubMed
    1. Lloréns-Rico V, Cano J, Kamminga T, Gil R, Latorre A, Chen W-H, Bork P, Glass JI, Serrano L, Lluch-Senar M. 2016. Bacterial antisense RNAs are mainly the product of transcriptional noise. Sci Adv 2:e1501363. doi:10.1126/sciadv.1501363. - DOI - PMC - PubMed

LinkOut - more resources