

Blood neurofilament light levels segregate treatment effects in multiple sclerosis
- PMID: 32047070
- PMCID: PMC7387108
- DOI: 10.1212/WNL.0000000000009097
Blood neurofilament light levels segregate treatment effects in multiple sclerosis
Abstract
Objective: To determine factors (including the role of specific disease modulatory treatments [DMTs]) associated with (1) baseline, (2) on-treatment, and (3) change (from treatment start to on-treatment assessment) in plasma neurofilament light chain (pNfL) concentrations in relapsing-remitting multiple sclerosis (RRMS).
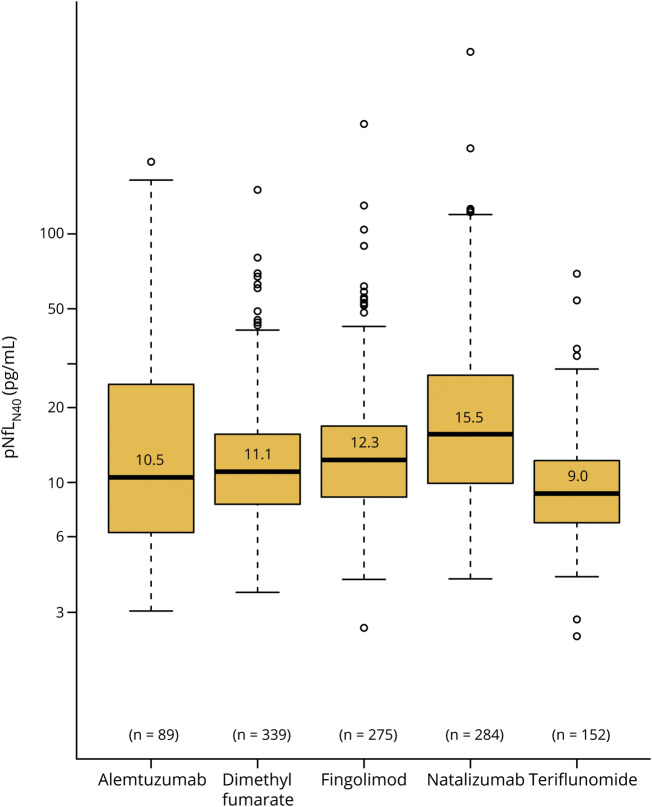
Methods: Data including blood samples analyses and long-term clinical follow-up information for 1,261 Swedish patients with RRMS starting novel DMTs were analyzed using linear regressions to model pNfL and changes in pNfL concentrations as a function of clinical variables and DMTs (alemtuzumab, dimethyl fumarate, fingolimod, natalizumab, rituximab, and teriflunomide).
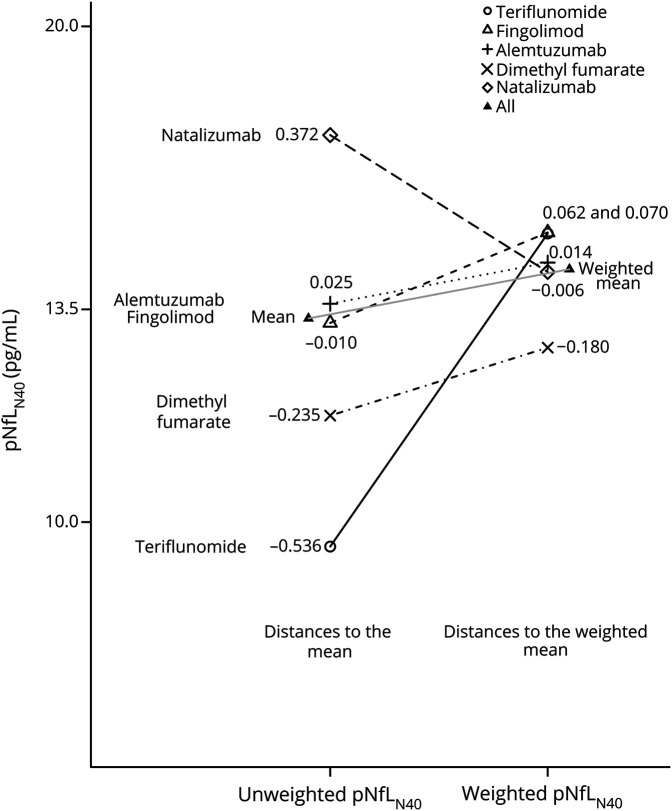
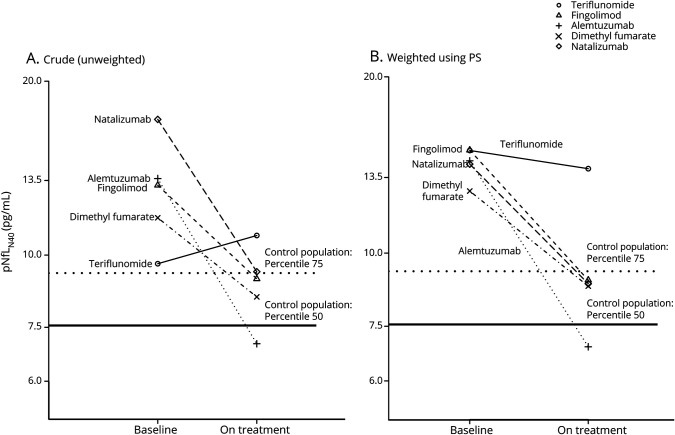
Results: The baseline pNfL concentration was positively associated with relapse rate, Expanded Disability Status Scale score, Age-Related MS Severity Score, and MS Impact Score (MSIS-29), and negatively associated with Symbol Digit Modalities Test performance and the number of previously used DMTs. All analyses, which used inverse propensity score weighting to correct for differences in baseline factors at DMT start, highlighted that both the reduction in pNfL concentration from baseline to on-treatment measurement and the on-treatment pNfL level differed across DMTs. Patients starting alemtuzumab displayed the highest reduction in pNfL concentration and lowest on-treatment pNfL concentrations, while those starting teriflunomide had the smallest decrease and highest on-treatment levels, but also starting from lower values. Both on-treatment pNfL and decrease in pNfL concentrations were highly dependent on baseline concentrations.
Conclusion: Choice of DMT in RRMS is significantly associated with degree of reduction in pNfL, which supports a role for pNfL as a drug response marker.
Copyright © 2020 The Author(s). Published by Wolters Kluwer Health, Inc. on behalf of the American Academy of Neurology.
Figures
Comment in
-
Tracking therapies in MS: More evidence in favor of neurofilament.Neurology. 2020 Mar 17;94(11):465-466. doi: 10.1212/WNL.0000000000009091. Epub 2020 Feb 11. Neurology. 2020. PMID: 32047072 No abstract available.
References
-
- Filippi M, Bar-Or A, Piehl F, et al. Multiple sclerosis. Nat Rev Dis Primers 2018;4:43. - PubMed
-
- Tallantyre EC, Bo L, Al-Rawashdeh O, et al. Clinico-pathological evidence that axonal loss underlies disability in progressive multiple sclerosis. Mult Scler 2010;16:406–411. - PubMed
-
- Trapp BD, Stys PK. Virtual hypoxia and chronic necrosis of demyelinated axons in multiple sclerosis. Lancet Neurol 2009;8:280–291. - PubMed
-
- Steenwijk MD, Geurts JJ, Daams M, et al. Cortical atrophy patterns in multiple sclerosis are non-random and clinically relevant. Brain 2016;139:115–126. - PubMed
Publication types
MeSH terms
Substances
LinkOut - more resources
Full Text Sources