. 2020 Feb 11;11(1):e03253-19.
doi: 10.1128/mBio.03253-19.

Both ADP-Ribosyl-Binding and Hydrolase Activities of the Alphavirus nsP3 Macrodomain Affect Neurovirulence in Mice

Affiliations

Both ADP-Ribosyl-Binding and Hydrolase Activities of the Alphavirus nsP3 Macrodomain Affect Neurovirulence in Mice

Rachy Abraham et al. mBio. .

Abstract

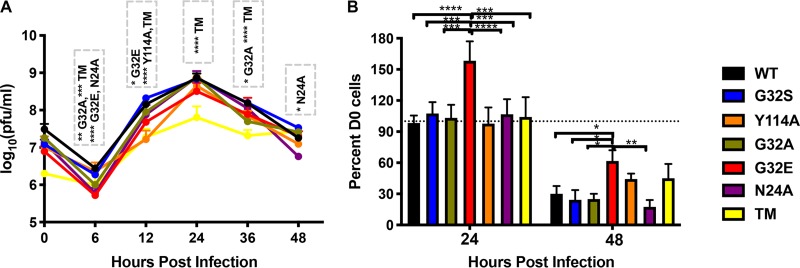
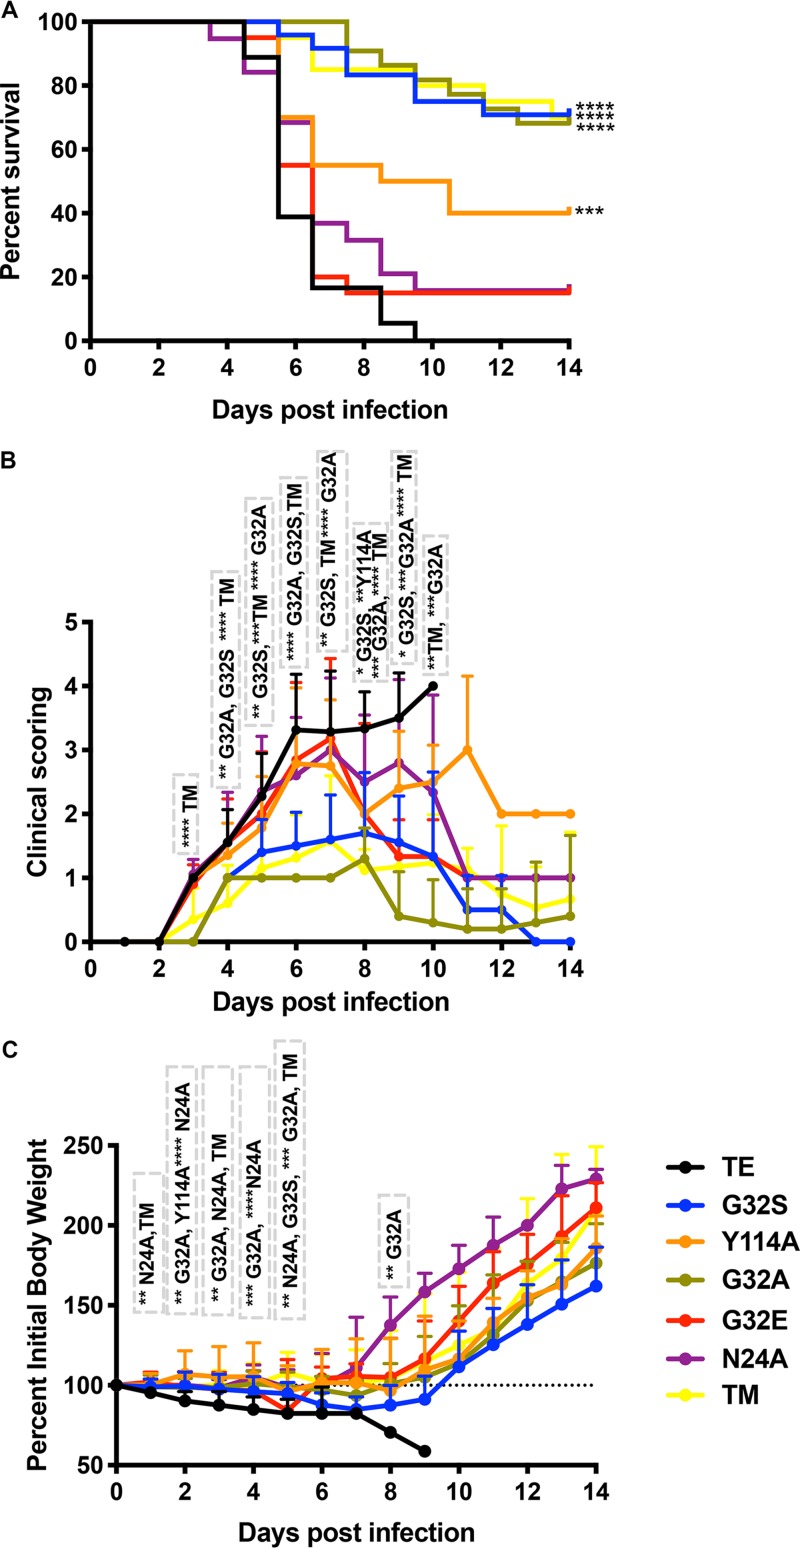
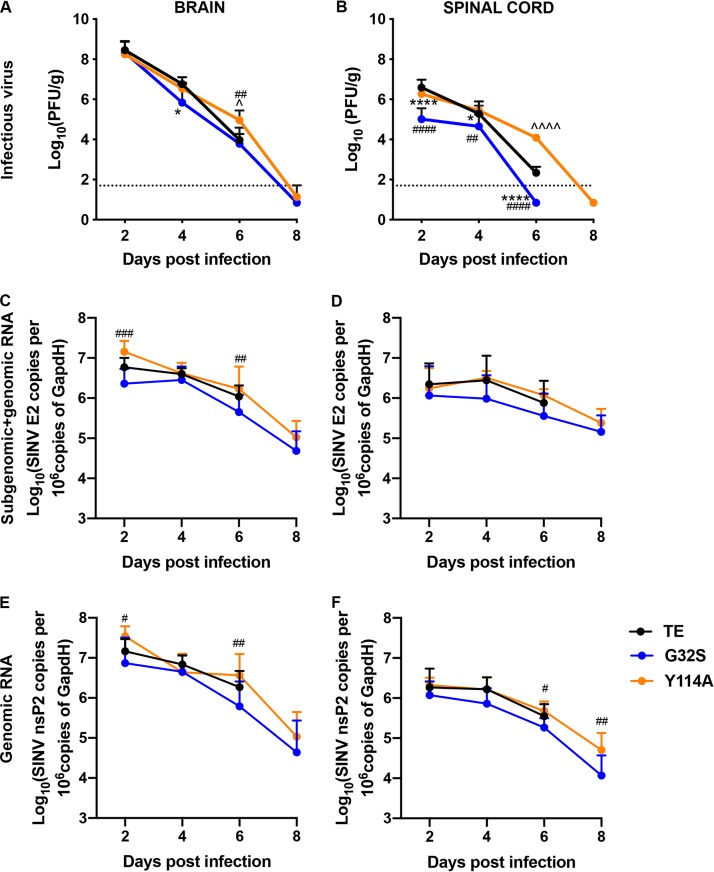
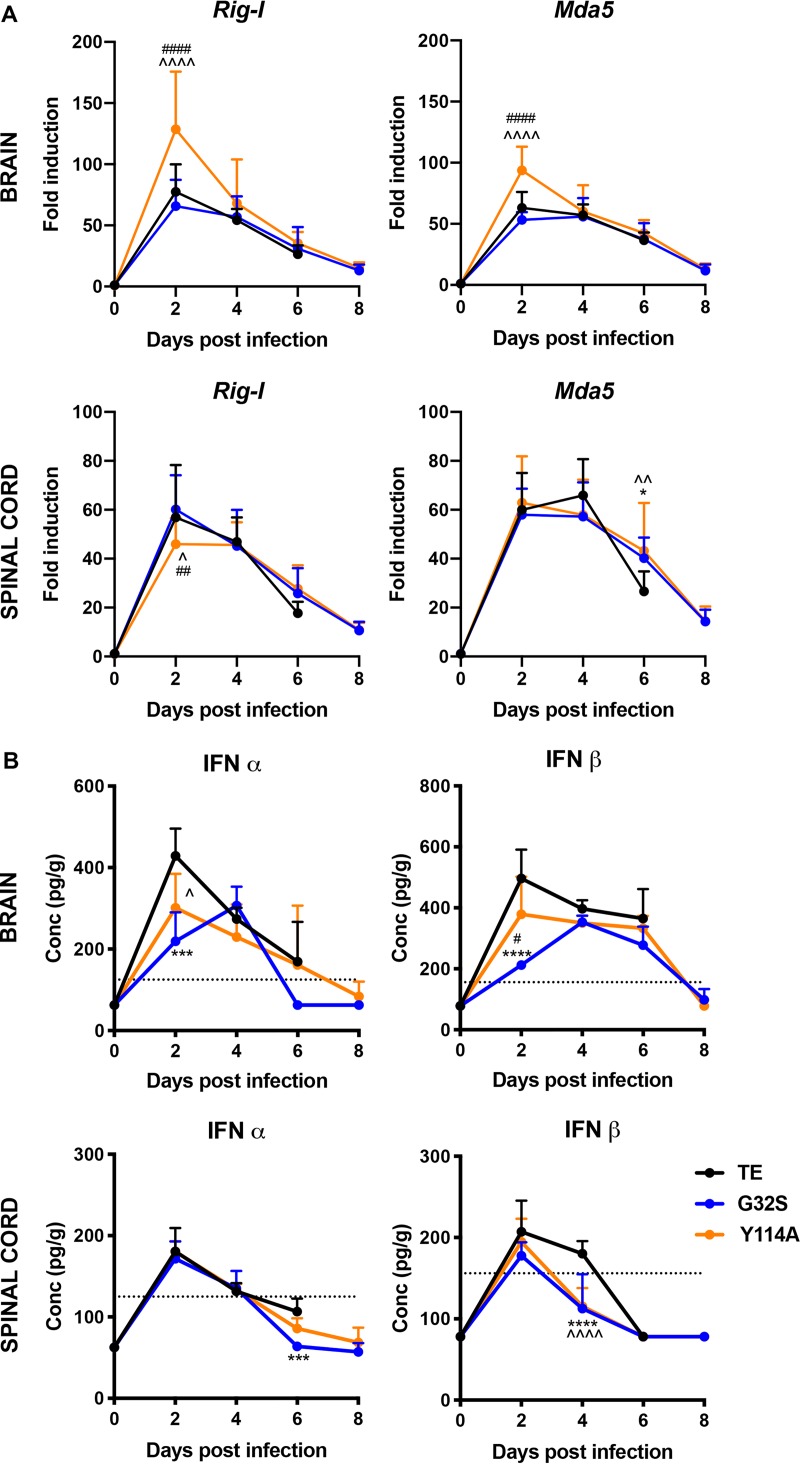
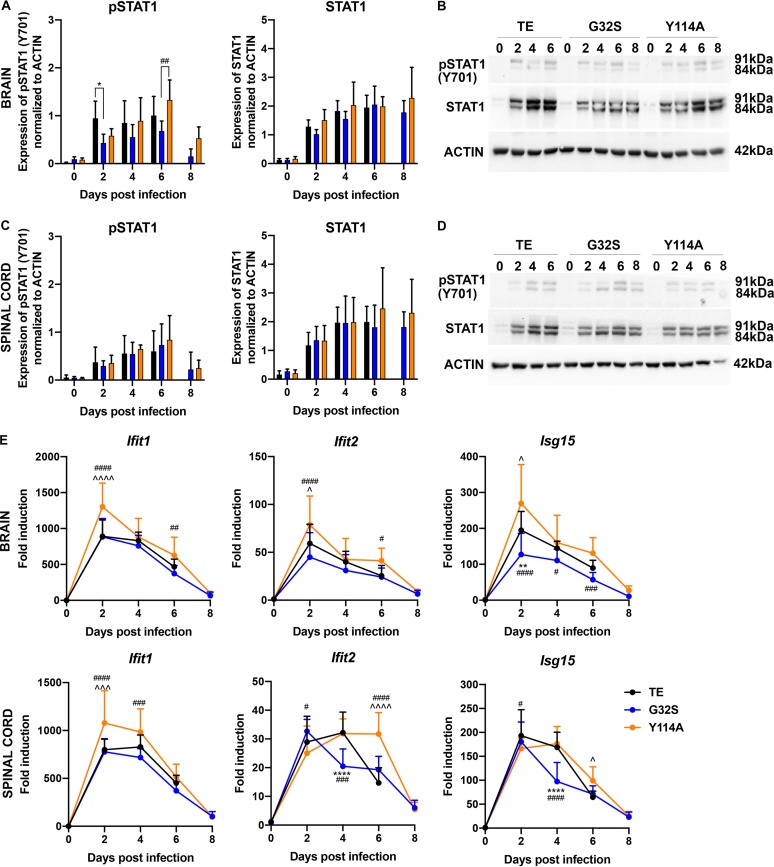
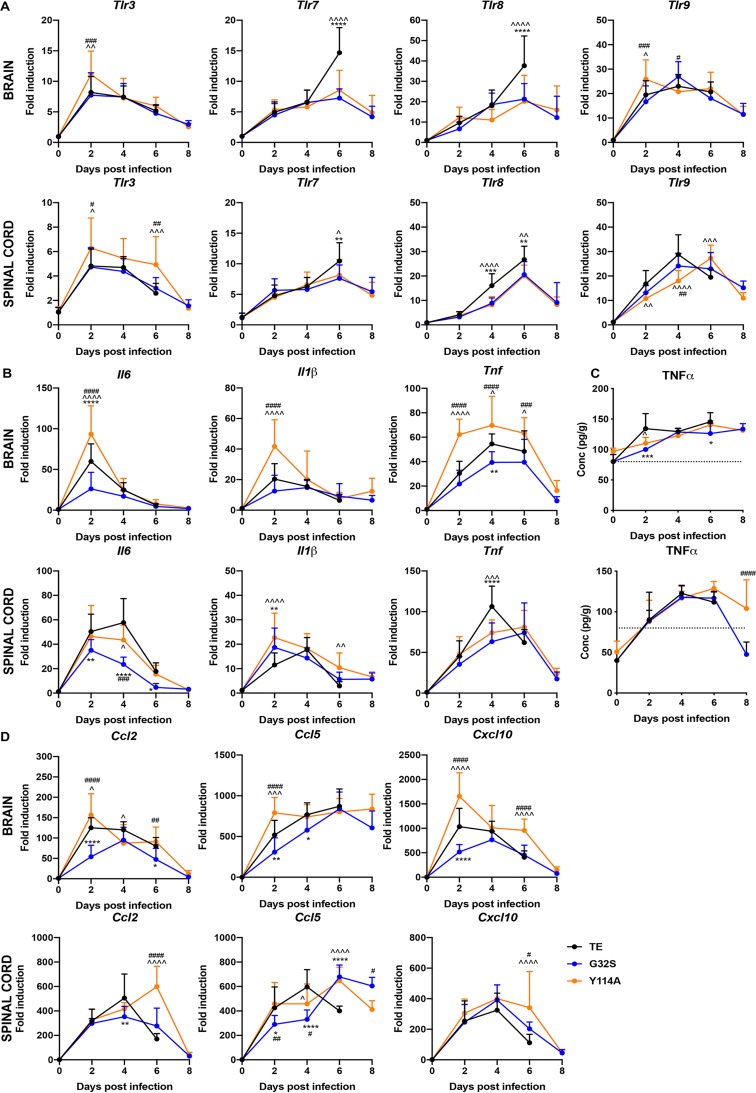
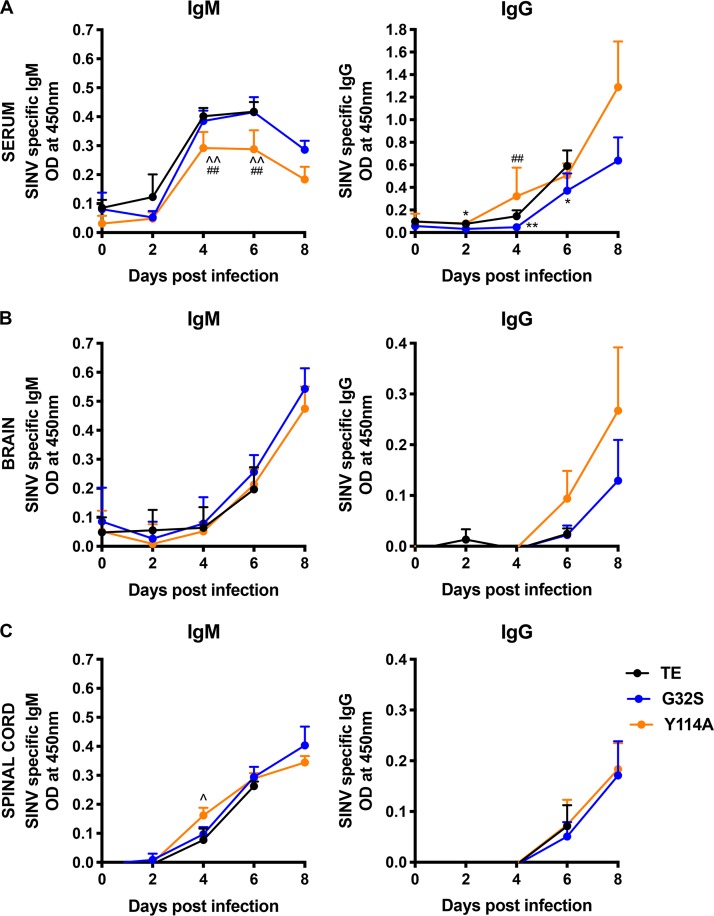
Macrodomain (MD), a highly conserved protein fold present in a subset of plus-strand RNA viruses, binds to and hydrolyzes ADP-ribose (ADPr) from ADP-ribosylated proteins. ADPr-binding by the alphavirus nonstructural protein 3 (nsP3) MD is necessary for the initiation of virus replication in neural cells, whereas hydrolase activity facilitates replication complex amplification. To determine the importance of these activities for pathogenesis of alphavirus encephalomyelitis, mutations were introduced into the nsP3 MD of Sindbis virus (SINV), and the effects on ADPr binding and hydrolase activities, virus replication, immune responses, and disease were assessed. Elimination of ADPr-binding and hydrolase activities (G32E) severely impaired in vitro replication of SINV in neural cells and in vivo replication in the central nervous systems of 2-week-old mice with reversion to wild type (WT) (G) or selection of a less compromising change (S) during replication. SINVs with decreased binding and hydrolase activities (G32S and G32A) or with hydrolase deficiency combined with better ADPr-binding (Y114A) were less virulent than WT virus. Compared to the WT, the G32S virus replicated less well in both the brain and spinal cord, induced similar innate responses, and caused less severe disease with full recovery of survivors, whereas the Y114A virus replicated well, induced higher expression of interferon-stimulated and NF-κB-induced genes, and was cleared more slowly from the spinal cord with persistent paralysis in survivors. Therefore, MD function was important for neural cell replication both in vitro and in vivo and determined the outcome from alphavirus encephalomyelitis in mice.IMPORTANCE Viral encephalomyelitis is an important cause of long-term disability, as well as acute fatal disease. Identifying viral determinants of outcome helps in assessing disease severity and developing new treatments. Mosquito-borne alphaviruses infect neurons and cause fatal disease in mice. The highly conserved macrodomain of nonstructural protein 3 binds and can remove ADP-ribose (ADPr) from ADP-ribosylated proteins. To determine the importance of these functions for virulence, recombinant mutant viruses were produced. If macrodomain mutations eliminated ADPr-binding or hydrolase activity, viruses did not grow. If the binding and hydrolase activities were impaired, the viruses grew less well than the wild-type virus, induced similar innate responses, and caused less severe disease, and most of the infected mice recovered. If binding was improved, but hydrolase activity was decreased, the virus replicated well and induced greater innate responses than did the WT, but clearance from the nervous system was impaired, and mice remained paralyzed. Therefore, macrodomain function determined the outcome of alphavirus encephalomyelitis.

Keywords: ADP-ribosyl hydrolase; ADP-ribosyl-binding activity; Sindbis virus; alphavirus; antibody; encephalomyelitis; innate immune response; macrodomain; nsP3.


Figures

FIG 1
FIG 1
ADP-ribosyl-binding and hydrolase activities of SINV nsP3MD mutants. (A) Representative image of results from the PARP10 catalytic domain (PARP10CD) demodification assay. PARP10CD was incubated with 32P-NAD+ to generate 32P-MARylated PARP10CD, which was incubated with buffer alone, nsP3 MDs from WT and mutants for 1 h at 37°C, followed by analysis by SDS-PAGE and autoradiography. Changes in the intensity of 32P-MARylated PARP10CD in samples containing nsP3MD from WT and mutants were quantified. (B) Quantitative representation of MAR hydrolase activity of nsP3 MD mutants relative to WT. Assays were performed in triplicate, buffer control was subtracted, and values were normalized to the activity levels of nsP3 MD WT. The data are presented as the percent WT activity values obtained from three independent experiments. Significance was determined by one-way ANOVA with Dunnett’s multiple-comparison test. ****, P < 0.0001 (WT versus N24A, G32E, TM [G32E/I113R/Y114N], and Y114A). (C) Quantification of ADPr-binding in KD (μM) from three runs of microscale thermophoresis (MST). Defined length PAR labeled on the 1″ terminus with Cy5 (10 nM) was incubated with 2-fold serial dilutions (diluted down from 0.5 to 1 mM stock concentration to 15 to 30 nM) of SINV WT and mutant MDs. MST was measured using a Monolith NT.115 (NanoTemper) at 80% excitation power and 20% MST power. The data are shown as the mean normalized fluorescence ± the SD.
FIG 2
FIG 2
Replication of SINV WT and nsP3MD mutants in mouse neuronal NSC34 cells. NSC34 cells were infected with SINV WT (TE strain) and nsP3 MD mutants N24A, G32A, G32E, G32S, Y114A, and TM (G32E/I113R/Y114N) at an MOI of 10. (A) Virus production was measured by plaque formation in Vero cells. The data are presented as means ± the SD obtained from three independent experiments *, P < 0.05; **, P < 0.01; ***, P < 0.001; ****, P < 0.0001 (TE versus nsP3 MD mutants N24A, G32A, G32E, Y114A, and TM). (B) Cell viability after infection was determined by trypan blue exclusion. The data are presented as means ± the SD obtained from three independent experiments of the numbers of viable cells compared to day 0 expressed as a percentage. *, P < 0.05; **, P < 0.01; ***, P < 0.001; ****, P < 0.0001 (G32E versus TE and nsP3 MD mutants N24A, G32A, G32S, Y114A, and TM). Significance was determined by two-way ANOVA with Tukey’s multiple-comparison test.
FIG 3
FIG 3
Morbidity and mortality of CD-1 mice infected with SINV WT and nsP3 MD mutants. Two-week-old CD-1 mice were inoculated intracranially with 1,000 PFU of SINV WT or nsP3 MD mutants N24A, G32A, G32E, G32S, Y114A, and TM (G32E/I11R/Y114N) and evaluated daily for 14 days. (A) Survival was assessed by Kaplan-Meier analysis and log rank Mantel Cox test. Survival was 0% for mice infected with WT TE with a mean day of death (MDOD) of 6.2; 15.8% for N24A with MDOD of 6.4, 68.2% for G32A with MDOD of 9.6, 15% for G32E with MDOD 6, 70.8% for G32S with MDOD of 8.2, 70% for TM with MDOD of 8.7, and 40% for Y114A with MDOD of 6.8. The data are from 20 to 22 mice per group of two independent experiments. ****, P < 0.0001 (WT versus G32S, G32A, and TM); ***, P < 0.001 (WT versus Y114A). (B) Signs of disease assessed using the following clinical scoring scale: 0, clinically normal; 1, ataxia and abnormal gait and tail posture; 2, hunched posture with occasional hind limb rearing (abnormal gait but normal locomotor activity); 3, severe hunched posture with limited to no locomotor activity (paralysis); and 4, death. The data are presented as the proportion of mice (18 to 20/group; 10 for G32S and G32A) showing clinical signs each day as means ± the SD. P values were determined by multiple t tests using the Holm-Sidak method. *, P < 0.05; **, P < 0.01; ***, P < 0.001; ****, P < 0.0001 (WT versus G32S, G32A, TM, or Y114A). (C) Body weight measured daily, normalized to body weight at the time of infection (dotted line) and represented as the percent body weight change. The data are presented as means ± the SD for 10 mice per group. P values were determined by using multiple Student t tests with the Holm-Sidak method. **, P < 0.01; ***, P < 0.001; ****, P < 0.0001 (WT versus N24A, G32A, G32S, TM, or Y114A).
FIG 4
FIG 4
Infectious virus and SINV RNA in brains and spinal cords of mice infected with WT and nsP3 MD mutants. Two-week-old CD-1 mice were inoculated intracranially with 1,000 PFU of SINV WT or nsP3 MD mutants G32S and Y114A. Brain (A) and spinal cord (B) homogenates from four mice from each group at each time point were assayed for infectious virus by plaque assay. RNA extracted from brain and spinal cord tissues was assayed for viral subgenomic and genomic (C and D) and genomic (E and F) RNA by qRT-PCR. Data pooled from two independent experiments are presented as means ± the SD for eight mice for each time point per group. Significance was determined by two-way ANOVA with Tukey’s multiple-comparison test. *, P < 0.05; ****, P < 0.0001 (WT versus G32S). ^, P < 0.05; ^̂̂̂, P < 0.0001 (WT versus or Y114A). #, P < 0.05; ##, P < 0.01; ###, P < 0.001; ####, P < 0.0001 (G32S versus Y114A).
FIG 5
FIG 5
Modulation of PARP mRNA and protein expression in the CNS of mice infected with WT and nsP3 MD mutants. Two-week-old CD-1 mice were inoculated intracranially with 1,000 PFU of SINV WT (TE) or nsP3 MD mutants G32S and Y114A. RNA was extracted from brain and spinal cord tissues and the expression of Parp1, Parp9, Parp10, and Parp12 (A) and of Parp13 and Parp14 (B) (upper panels, brain; lower panels, spinal cord) mRNAs were measured by qRT-PCR. CT values were normalized to Gapdh, and the fold change was calculated relative to samples from day 0 (ΔΔCT). Data pooled from two independent experiments are presented as means ± the SD for eight mice per group. Significance was determined by two-way ANOVA with Tukey’s multiple-comparison test. *, P < 0.05; **, P < 0.01; ***, P < 0.001 (WT versus G32S). ^, P < 0.05; ^̂, P < 0.01; ^̂̂̂, P < 0.0001 (WT versus Y114A). #, P < 0.05; ##, P < 0.01; ###, P < 0.001; ####, P < 0.0001 (G32S versus Y114A). (C) Immunoblots of brain and spinal cord homogenates (20 μg of 10% [wt/vol]) probed for PARP14. Antibody against β-actin was used for loading controls. The levels of PARP14 (170-kDa band) relative to actin in the brain (upper panel) and spinal cord (lower panel) were determined using densitometry from five blots for brain and four blots for spinal cord and presented as a bar graph. Significance was determined by 2-way ANOVA with Tukey’s multiple-comparison test. ^, P < 0.05; ^̂̂̂, P < 0.0001 (WT versus Y114A). ####, P < 0.0001 (G32S versus Y114A). (D) Representative immunoblot images of brain (upper) and spinal cord (lower) homogenates probed for PARP14 and actin.
FIG 6
FIG 6
IFN signaling pathway in the CNS of the mice infected with WT and nsP3 MD mutants. Two-week-old CD-1 mice were inoculated intracranially with 1,000 PFU SINV TE or nsP3 MD mutants G32S and Y114A. (A) RNA was extracted from brain and spinal cord tissues, and the levels of Rig-I and Mda5 mRNAs were measured by qRT-PCR (upper panels, brain; lower panels, spinal cord). CT values were normalized to Gapdh, and the fold change was calculated relative to day 0 (ΔΔCT). Data pooled from two independent experiments are presented as means ± the SD for eight mice for each time point per group. Significance was determined by two-way ANOVA with Tukey’s multiple-comparison test. *, P < 0.05 (WT versus G32S). ^, P < 0.05; ^̂, P < 0.01; ^̂̂̂, P < 0.0001 (WT versus Y114A). ##, P < 0.01; ####, P < 0.0001 (G32S versus Y114A). (B) Brain (top) and spinal cord (bottom) homogenates were tested by EIA for IFN-α (left) and IFN-β (right). The graphs show the average concentrations of IFN in pg/g of tissues from four animals per group. The dotted line indicates the lowest assay range value in pg/ml. Significance was determined by two-way ANOVA with Tukey’s multiple-comparison test. ***, P < 0.001; ****, P < 0.0001 (WT versus G32S). ^, P < 0.05; ^̂̂̂, P < 0.0001 (WT versus Y114A). #, P < 0.05 (G32S versus Y114A).
FIG 7
FIG 7
STAT1 activation and ISG expression in the CNS of mice infected with WT and nsP3 MD mutants. Two-week-old CD-1 mice were inoculated intracranially with 1,000 PFU of SINV TE or nsP3 MD mutants G32S and Y114A. Immunoblots of brain (A and B) and spinal cord (C and D) homogenates (20 μg of 10% [wt/vol]) were probed for total and phosphorylated STAT1. Antibody against β-actin was used for loading controls. The levels of pSTAT1 (Y701) and STAT1 (91- + 84-kDa band) relative to the actin in brain (A) and spinal cord (C) were quantitated using densitometry from five blots and are presented as a bar graph. Significance was determined by two-way ANOVA with Tukey’s multiple-comparison test. *, P < 0.05 (WT versus G32S). ##, P < 0.01 (G32S versus Y114A). Representative immunoblot images of brain (B) and spinal cord (D) homogenates probed for pSTAT1, STAT1, and actin. (E) RNA extracted from brain and spinal cord tissues assayed for mRNA expression of Ifit1, Ifit2, and Isg15 by qRT-PCR. CT values were normalized to Gapdh, and the fold change was calculated relative to infected controls at day 0 (ΔΔCT). Data pooled from two independent experiments are presented as means ± the SD for eight mice for each time point per group. Significance was determined by two-way ANOVA with Tukey’s multiple-comparison test. *, P < 0.05; **, P < 0.01; ***, P < 0.001; ****, P < 0.0001 (WT versus G32S). ^, P < 0.05; ^̂̂, P < 0.001; ^̂̂̂, P < 0.0001 (WT versus Y114A). #, P < 0.05; ##, P < 0.01; ###, P < 0.001; ####, P < 0.0001 (G32S versus Y114A).
FIG 8
FIG 8
Expression of Toll-like receptors, cytokines, and chemokines in the CNS of mice infected with WT and nsP3 MD mutants. Two-week-old CD-1 mice were inoculated intracranially with 1,000 PFU of SINV TE or nsP3 MD mutants G32S and Y114A. RNA was extracted from brain and spinal cord tissues and mRNA expression of Tlr3, Tlr7, Tlr8, and Tlr9 (A) and Il6, Il1β, and Tnf (B) was measured by qRT-PCR (upper panels, brain; lower panels, spinal cord). The CT values were normalized to Gapdh, and the fold change was calculated relative to day 0 (ΔΔCT). Data pooled from two independent experiments are presented as means ± the SD for eight mice for each time point per group. Significance was determined by two-way ANOVA with Tukey’s multiple-comparison test. (C) Brain (upper panel) and spinal cord (lower panel) homogenates were tested by EIA for TNF-α. Graphs show the average concentration of TNF-α in pg/g tissue from four animals per group. The dotted line indicates the lowest assay range value in pg/ml. Significance was determined by two-way ANOVA with Tukey’s multiple-comparison test. (D) Expression of Ccl2, Ccl5, and Cxcl10 mRNAs (upper panels, brain; lower panels, spinal cord) was measured by qRT-PCR. The CT values were normalized to Gapdh, and the fold change was calculated relative to day 0 (ΔΔCT). Data pooled from two independent experiments are presented as means ± the SD for eight mice per group for each time point. Significance was determined by two-way ANOVA with Tukey’s multiple-comparison test. *, P < 0.05; **, P < 0.01; ***, P < 0.001; ****, P < 0.0001 (WT versus G32S). ^, P < 0.05; ^̂, P < 0.01; ^̂̂, P < 0.001; ^̂̂̂, P < 0.0001 (WT versus Y114A). #, P < 0.05; ##, P < 0.01; ###, P < 0.001; ####, P < 0.0001 (G32S versus Y114A).
FIG 9
FIG 9
Antibody responses of mice infected with WT and nsP3 MD mutants. Two-week-old CD-1 mice were inoculated intracranially with 1,000 PFU of SINV TE and nsP3 MD mutants G32S and Y114A. Serum (A), brain (B), and spinal cord (C) homogenates were tested for SINV-specific IgM (left panels) and IgG (right panels) by EIA. The graphs show the OD of serum (1:100 dilution) and 10% (wt/vol) brain and spinal cord homogenates (1:2 dilution) from four animals per group. Significance was determined by multiple Student t tests using the Holm-Sidak method. *, P < 0.05; **, P < 0.01 (WT versus G32S). ^, P < 0.05; ^̂, P < 0.01 (WT versus G32S versus Y114A). ##, P < 0.01 (G32S versus Y114A).
FIG 10
FIG 10
Cellular immune response genes expressed by mice infected with WT and nsP3 MD mutants. Expression of Ifnγ, Il10, and IFN-γ-induced ISG mRNAs in the CNS of mice infected with WT and nsP3 MD mutants. Two-week-old CD-1 mice were inoculated intracranially with 1,000 PFU of SINV TE or nsP3 MD mutants G32S and Y114A. RNA was extracted from brain and spinal cord tissues, and the mRNAs for Cd4, Cd8a, and Cd8b (A) and Ifnγ, Il10, Gbp1, and Gbp2 (B) were measured by qRT-PCR (upper panels, brain; lower panels, spinal cord). The CT values were normalized to Gapdh, and the fold change was calculated relative to day 0 (ΔΔCT). Data pooled from two independent experiments are presented as means ± the SD for eight mice for each time point per group. Significance was determined by two-way ANOVA with Tukey’s multiple-comparison test. *, P < 0.05; **, P < 0.01; ***, P < 0.001; ****, P < 0.0001 (WT versus G32S). ^, P < 0.05; ^̂, P < 0.01; ^̂̂, P < 0.001; ^̂̂̂, P < 0.0001 (WT versus Y114A). #, P < 0.05; ##, P < 0.01; ####, P < 0.0001 (G32S versus Y114A).

References

    1. Sane J, Kurkela S, Desdouits M, Kalimo H, Mazalrey S, Lokki ML, Vaheri A, Helve T, Tornwall J, Huerre M, Butler-Browne G, Ceccaldi PE, Gessain A, Vapalahti O. 2012. Prolonged myalgia in Sindbis virus infection: case description and in vitro infection of myotubes and myoblasts. J Infect Dis 206:407–414. doi:10.1093/infdis/jis358. - DOI - PubMed
    1. Weaver SC, Forrester NL. 2015. Chikungunya: evolutionary history and recent epidemic spread. Antiviral Res 120:32–39. doi:10.1016/j.antiviral.2015.04.016. - DOI - PubMed
    1. Bruyn HB, Lennette EH. 1953. Western equine encephalitis in infants; a report on three cases with sequelae. Calif Med 79:362–366. - PMC - PubMed
    1. Villari P, Spielman A, Komar N, McDowell M, Timperi RJ. 1995. The economic burden imposed by a residual case of eastern encephalitis. Am J Trop Med Hyg 52:8–13. doi:10.4269/ajtmh.1995.52.8. - DOI - PubMed
    1. Lustig S, Jackson AC, Hahn CS, Griffin DE, Strauss EG, Strauss JH. 1988. Molecular basis of Sindbis virus neurovirulence in mice. J Virol 62:2329–2336. doi:10.1128/JVI.62.7.2329-2336.1988. - DOI - PMC - PubMed

Publication types

LinkOut - more resources