. 2020 Feb 11;10(1):2329.
doi: 10.1038/s41598-020-59216-8.

Non-secretory renin reduces oxidative stress and increases cardiomyoblast survival during glucose and oxygen deprivation

Affiliations

Non-secretory renin reduces oxidative stress and increases cardiomyoblast survival during glucose and oxygen deprivation

Heike Wanka et al. Sci Rep. .

Abstract

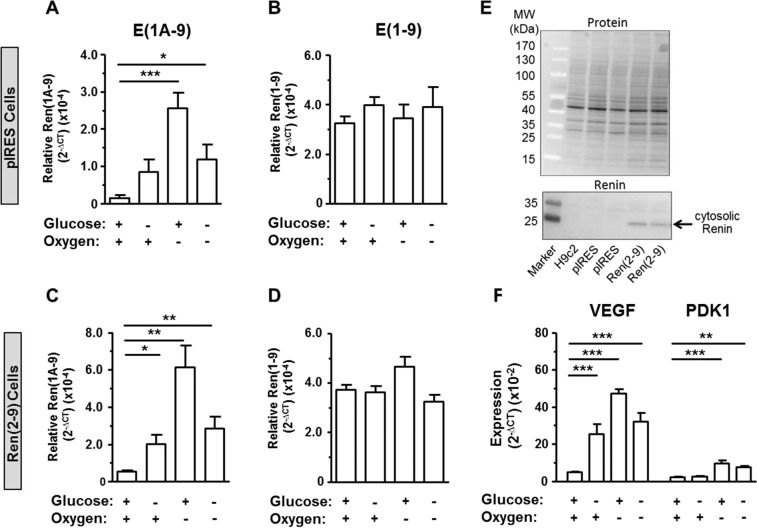
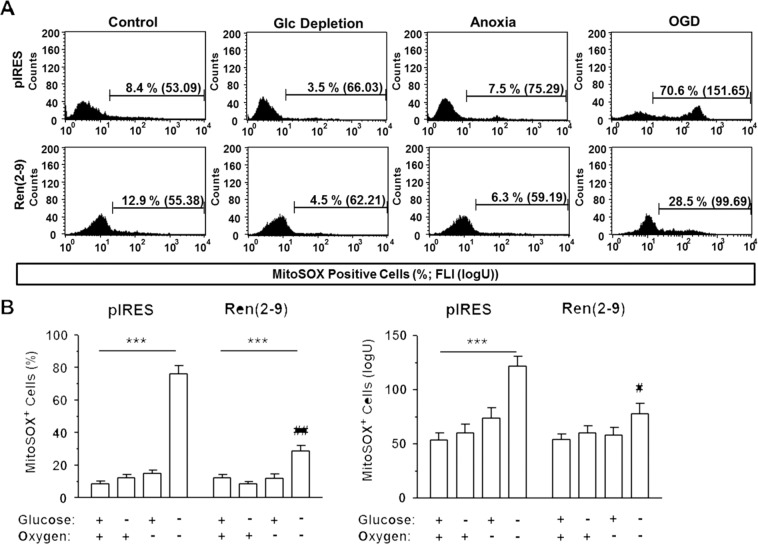
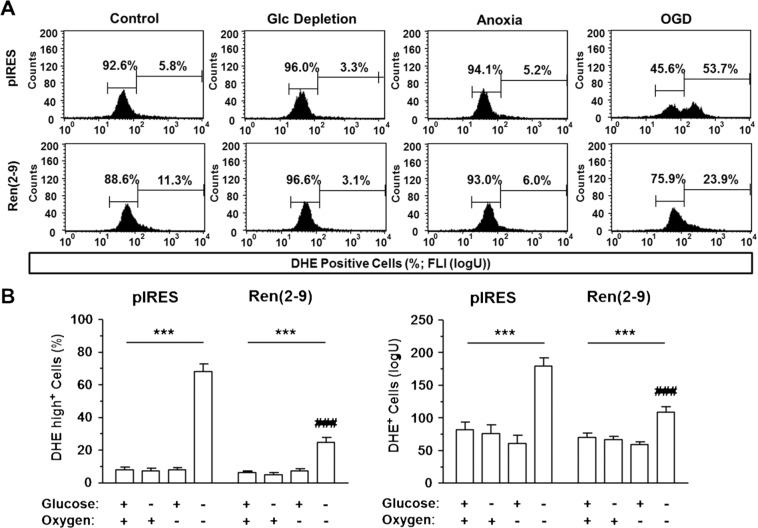
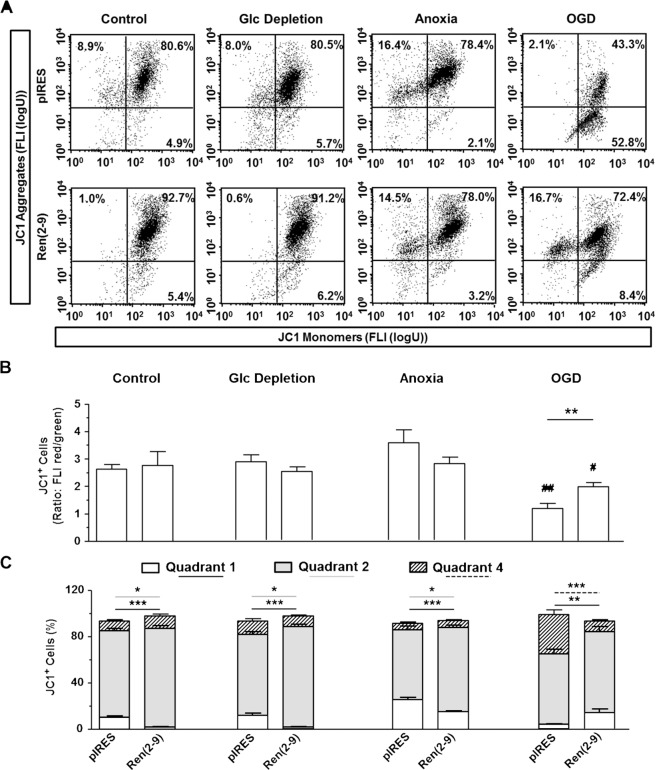
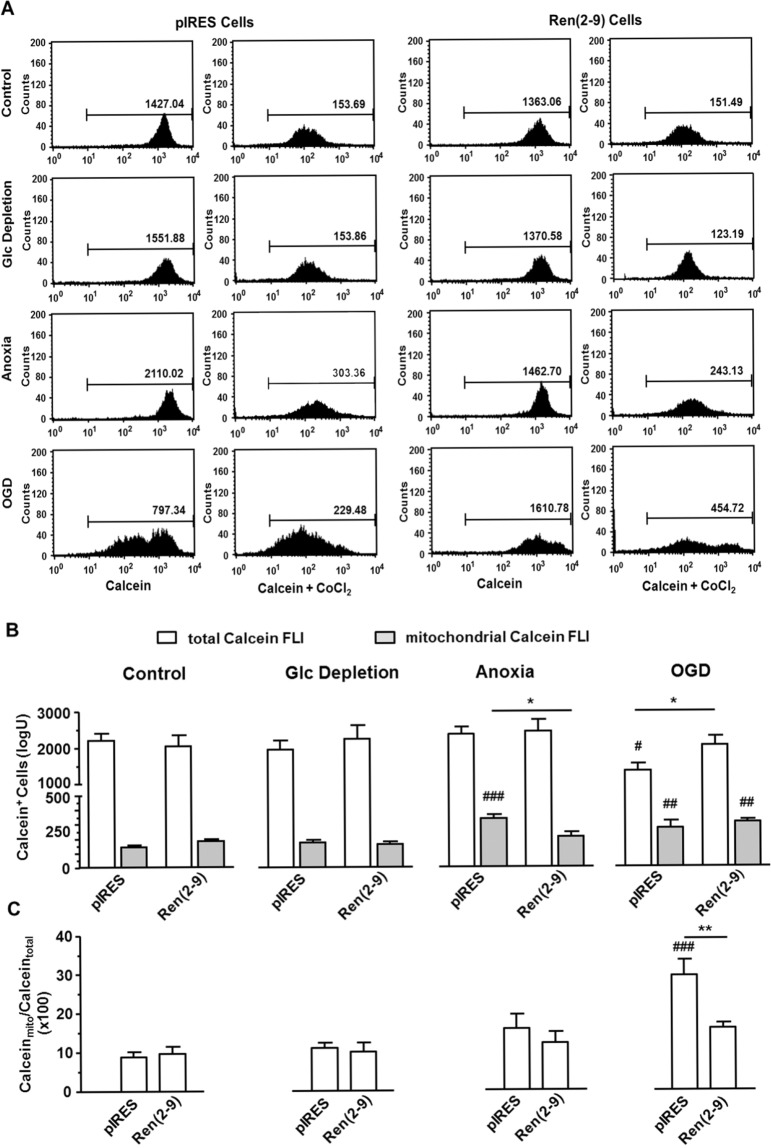
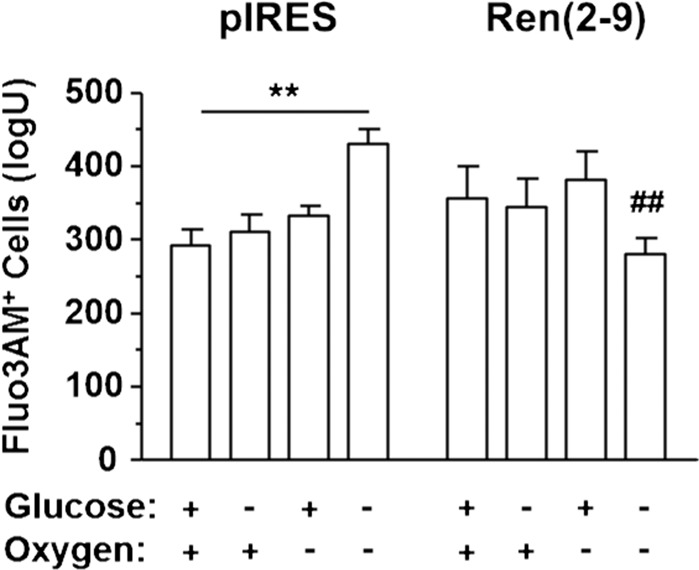
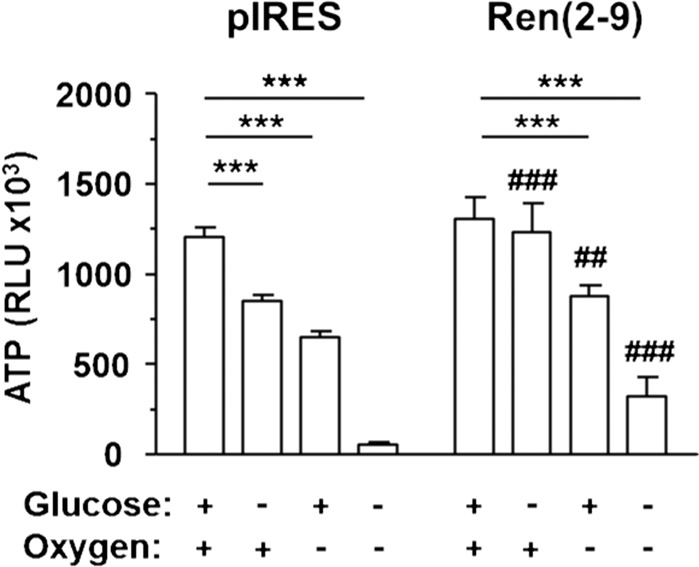
Although the renin-angiotensin system usually promotes oxidative stress and cell death, renin transcripts have been discovered, whose transcription product may be cardioprotective. These transcripts encode a non-secretory renin isoform that is localized in the cytosol and within mitochondria. Here we tested the hypotheses that cytosolic renin [ren(2-9)] expression promotes cell survival under hypoxia and glucose depletion by preserving the mitochondrial membrane potential (∆Ψm) and mitigating the accumulation of ROS. To simulate ischemic insults, we exposed H9c2 cells to glucose deprivation, anoxia or to combined oxygen-glucose deprivation (OGD) for 24 hours and determined renin expression. Furthermore, H9c2 cells transfected with the empty pIRES vector (pIRES cells) or ren(2-9) cDNA-containing vector [ren(2-9) cells] were analyzed for cell death, ∆Ψm, ATP levels, accumulation of ROS, and cytosolic Ca2+ content. In pIRES cells, expression of ren(1A-9) was stimulated under all three ischemia-related conditions. After OGD, the cells lost their ∆Ψm and exhibited enhanced ROS accumulation, increased cytosolic Ca2+ levels, decreased ATP levels as well as increased cell death. In contrast, ren(2-9) cells were markedly protected from these effects. Ren(2-9) appears to represent a protective response to OGD by reducing ROS generation and preserving mitochondrial functions. Therefore, it is a promising new target for the prevention of ischemia-induced myocardial damage.


Conflict of interest statement

The authors declare no competing interests.

Figures

Figure 1
Figure 1
Expression of renin transcripts in transfected pIRES and ren(2-9) cells. Cardiac pIRES controls (empty vector-transfected cells) and ren(2-9)-overexpressing cells [Ren(2-9)] were exposed to control conditions, glucose (Glc) depletion alone, anoxia alone, or the combination of oxygen and glucose depletion (OGD) for 24 hours. (AD) Renin transcript levels or (F) hypoxia-relevant genes normalized to the housekeeper YWHAZ were quantified by RT-PCR. (E) Renin protein of pIRES controls and ren(2-9) cells normalized to the protein content was detected by Western Blot. The data represent mean ± SEM values of 5-7 independent experiments or representative Western blots. *p < 0.05, ***p < 0.001 (Anova, Kruskis-Wallis (AD) or Bonferroni (E)), E(1A-9): exon(1A-9)renin, E(1-9): exon(1-9)renin.
Figure 2
Figure 2
Ren(2-9) protects H9c2 cells from apoptotic and necrotic death induced by ischemia-related conditions. Cardiac H9c2 pIRES controls (empty vector-transfected cells) and ren(2-9)-overexpressing cells [Ren(2-9)] were exposed to control conditions, glucose (Glc) depletion alone, anoxia alone, or the combination of oxygen and glucose depletion (OGD) for 24 hours. (A) Representative histograms of apoptotic cells labelled with apoptosis-specific markers and propidium iodide (PI). Apoptosis rate was quantified by the percentage of (B) CaspACE+, (C) Annexin V+ and (D) Fas receptor+ cells (n = 8–9, each). Cells were additionally labelled with PI to differentiate between early apoptosis (PI) and late apoptosis (PI+) (grey shaded). Necrosis rate was determined (E) by PI labelling (early necrosis, PI+ apoptosis- cells, n = 9) and (F) by the percentage ratio between released LDH and LDH content using the cytotoxicity detection kit (n = 10). Data represent mean ± SEM values. *p < 0.05, **p < 0.01, and ***p < 0.001 vs. basal conditions with glucose and oxygen; #p < 0.05, ##p < 0.01, and ###p < 0.001 vs. pIRES controls.
Figure 3
Figure 3
Ren(2-9) protects H9c2 cells from accumulation of mitochondrial superoxides induced by ischemia-related conditions. Cardiac pIRES controls (empty vector-transfected cells) and ren(2-9)-overexpressing cells [Ren(2-9)] were exposed to control conditions, glucose (Glc) depletion alone, anoxia alone or the combination of oxygen and glucose deprivation (OGD) for 24 hours. Afterwards, cells were incubated with MitoSOX fluorophore to detect mitochondrially localized superoxides. (A) Representative histograms and (B) analyses of percentage and mean fluorescence intensity of MitoSOX+ cells. Data represent mean ± SEM values of 9-10 experiments. ***p < 0.001 vs. basal conditions with glucose and oxygen; #p < 0.05, ##p < 0.01 vs. pIRES controls.
Figure 4
Figure 4
Ren(2-9) protects H9c2 cells from accumulation of cytosolic reactive oxygen species induced by ischemia-related conditions. Cardiac pIRES controls (empty vector-transfected cells) and ren(2-9)-overexpressing cells [Ren(2-9)] were exposed to control conditions, glucose (Glc) depletion alone, anoxia alone or the combination of oxygen and glucose deprivation (OGD) for 24 hours. Afterwards, cells were incubated with dihydroethidium (DHE) to detect reactive oxygen species in the cytosol. (A) Representative histograms and (B) analyses of percentage (left panel) and mean fluorescence intensity of DHE+ cells (right panel). Data represent mean ± SEM values of 7-10 experiments. ***p < 0.001 vs. basal control with glucose and oxygen; ###p < 0.001 vs. pIRES cells.
Figure 5
Figure 5
Ren(2-9) protects H9c2 cells from disruption of mitochondrial membrane potential induced by ischemia-related conditions. Cardiac pIRES controls (empty vector-transfected cells) and ren(2-9)-overexpressing cells [Ren(2-9)] were exposed to control conditions, glucose (Glc) depletion alone, anoxia alone or the combination of oxygen and glucose deprivation (OGD) for 24 hours. Afterwards, cells were incubated with JC1 dye to detect the mitochondrial membrane potential (∆Ψm). (A) Representative histograms of JC1+ cells separated in different quadrants according to the generation of JC1 aggregates (red fluorescence) or JC1 monomers (green fluorescence). (B) Analysis of the ratio of red/green fluorescence intensity (FLI) representing the ∆Ψm. (C) Distribution of JC1+ cells within the different quadrants according to their red or green fluorescence. Localization of quadrant 1: upper left, quadrant 2: upper right, quadrant 4: bottom right. Data show mean ± SEM values of 8 experiments. *p < 0.05, **p < 0.01, ***p < 0.001 vs. pIRES cells, #p < 0.05, ##p < 0.01, ###p < 0.001 vs. basal controls.
Figure 6
Figure 6
Ren(2-9) protects H9c2 cells from mitochondrial calcein overload induced by ischemia-related conditions. Cardiac pIRES controls (empty vector-transfected cells) and ren(2-9)-overexpressing cells [Ren(2-9)] were exposed to control conditions, glucose (Glc) depletion alone, anoxia alone or the combination of oxygen and glucose deprivation (OGD) for 24 hours. Afterwards, cells were incubated with calcein-AM or calcein-AM plus CoCl2 to monitor the distribution of calcein within all subcellular compartments combined vs. mitochondria alone. (A) Representative histograms of total vs. mitochondrial calcein fluorescence intensities (FLI). (B) Analyses of total (white columns) vs. mitochondrial calcein FLI (grey columns). (C) Ratio of mitochondrial to total calcein FLI representing mitochondrial permeability transition. Data represent mean ± SEM values of 8 experiments. *p < 0.05, **p < 0.01 vs. pIRES cells, ##p < 0.01, ###p < 0.001 vs. basal control.
Figure 7
Figure 7
Ren(2-9) protects H9c2 cells from OGD-induced cytosolic Ca2+ overload. Cardiac pIRES controls (empty vector-transfected cells) and ren(2-9)-overexpressing cells [Ren(2-9)] were exposed to control conditions, glucose depletion, anoxia or the combination of oxygen and glucose deprivation (OGD) for 24 hours. Afterwards, cells were incubated with the fluorophore Fluo3AM to detect cytosolic free Ca2+ levels via analysis of fluorescence intensity. Data show mean ± SEM values of 10 experiments. **p < 0.01 basal vs. control, ##p < 0.01 vs. pIRES cells.
Figure 8
Figure 8
Ren(2-9) limits decrease of ATP levels induced by ischemia-related conditions. Cardiac pIRES controls (empty vector transfected cells) and cyto-renin overexpressing cells [Ren(2-9)] were exposed to control conditions, glucose depletion alone, anoxia alone or the combination of glucose and oxygen deprivation (OGD) for 24 hours. Afterwards, cellular ATP levels were determined by the CellTiter Glo Cell Viability Assay. Data show mean ± SEM values of 6 experiments. ***p < 0.001 vs. basal control, ##p < 0.01, ###p < 0.001 vs. pIRES.

References

    1. Werner C, et al. RAS blockade with ARB and ACE inhibitors: current perspective on rationale and patient selection. Clin. Res. Cardiol. 2008;97:418–431. doi: 10.1007/s00392-008-0668-3. - DOI - PubMed
    1. Clausmeyer S, Sturzebecher R, Peters J. An alternative transcript of the rat renin gene can result in a truncated prorenin that is transported into adrenal mitochondria. Circ. Res. 1999;84:337–344. doi: 10.1161/01.RES.84.3.337. - DOI - PubMed
    1. Lee-Kirsch MA, Gaudet F, Cardoso MC, Lindpaintner K. Distinct renin isoforms generated by tissue-specific transcription initiation and alternative splicing. Circ. Res. 1999;84:240–246. doi: 10.1161/01.RES.84.2.240. - DOI - PubMed
    1. Sinn PL, Sigmund CD. Identification of three human renin mRNA isoforms from alternative tissue-specific transcriptional initiation. Physiol. Genomics. 2000;3:25–31. doi: 10.1152/physiolgenomics.2000.3.1.25. - DOI - PubMed
    1. Lutze P, et al. An alternative promoter in intron1 of the renin gene is regulated by glucose starvation via serum response factor. Cell. Physiol. Biochem. 2017;42:1447–1457. doi: 10.1159/000479209. - DOI - PubMed