. 2020 Feb 11;3(1):60.
doi: 10.1038/s42003-020-0784-9.

Nucleosome destabilization by nuclear non-coding RNAs

Affiliations

Nucleosome destabilization by nuclear non-coding RNAs

Risa Fujita et al. Commun Biol. .

Abstract

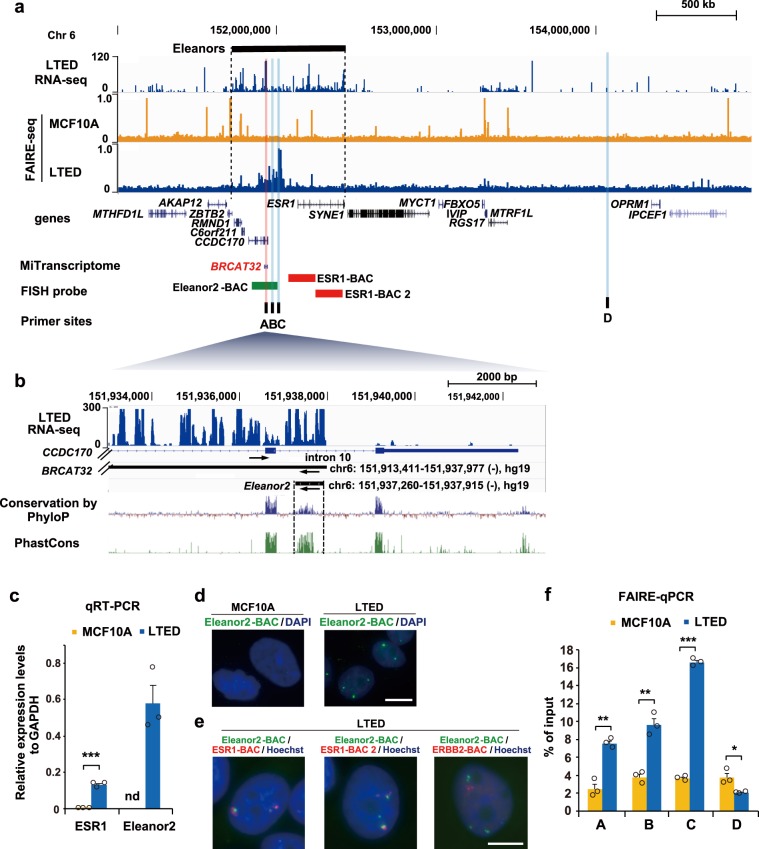
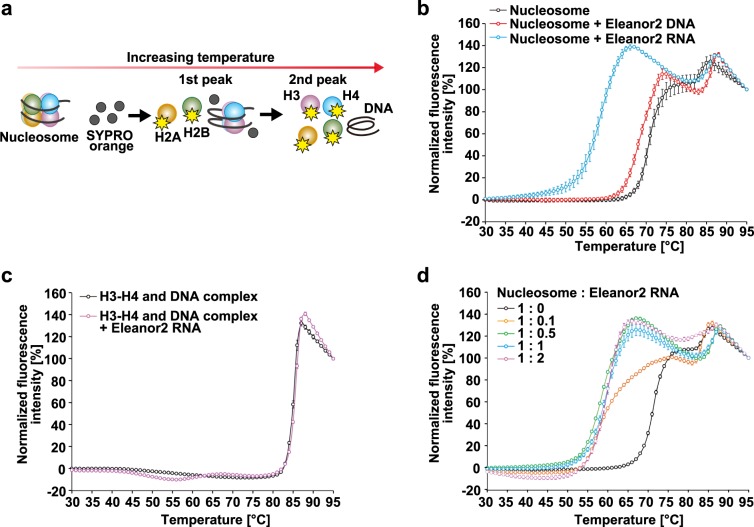
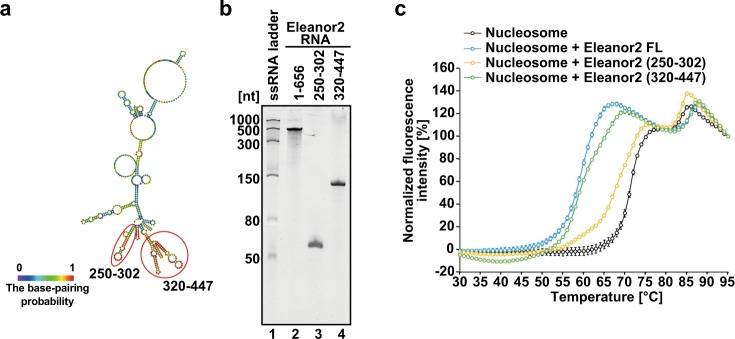
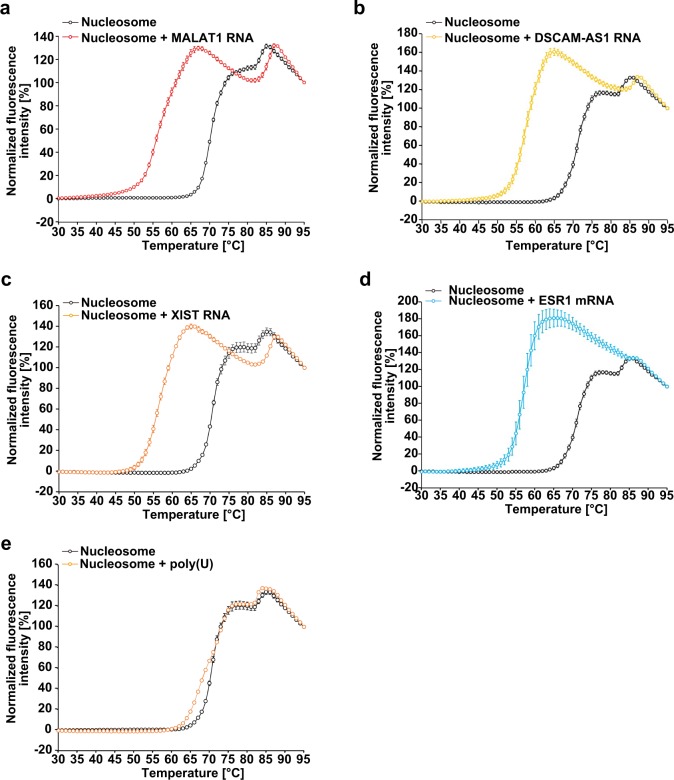
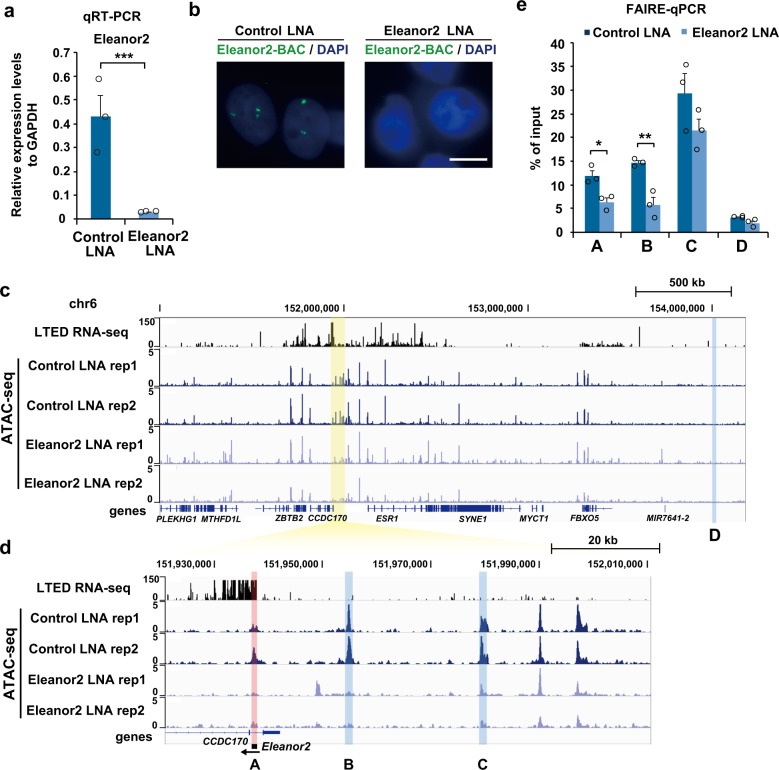
In the nucleus, genomic DNA is wrapped around histone octamers to form nucleosomes. In principle, nucleosomes are substantial barriers to transcriptional activities. Nuclear non-coding RNAs (ncRNAs) are proposed to function in chromatin conformation modulation and transcriptional regulation. However, it remains unclear how ncRNAs affect the nucleosome structure. Eleanors are clusters of ncRNAs that accumulate around the estrogen receptor-α (ESR1) gene locus in long-term estrogen deprivation (LTED) breast cancer cells, and markedly enhance the transcription of the ESR1 gene. Here we detected nucleosome depletion around the transcription site of Eleanor2, the most highly expressed Eleanor in the LTED cells. We found that the purified Eleanor2 RNA fragment drastically destabilized the nucleosome in vitro. This activity was also exerted by other ncRNAs, but not by poly(U) RNA or DNA. The RNA-mediated nucleosome destabilization may be a common feature among natural nuclear RNAs, and may function in transcription regulation in chromatin.


Conflict of interest statement

The authors declare no competing interests.

Figures

Fig. 1
Fig. 1. Eleanor2 RNA promotes an open chromatin conformation in LTED cells.
a Overview of the Eleanor2 locus and its neighboring region (Chr6:148,180,000–156,290,000). The RNA-seq and FAIRE-seq, tracks in the indicated cells are aligned against the genome reference GRCh37/hg19. Positions of the UCSC genes and lncRNAs annotated in MiTranscriptome. The BAC DNA used as the FISH probe (green bar: Eleanor2-BAC, red bars: ESR1-BAC and ESR1-BAC2), and the primers used for FAIRE-qPCR (black bars; A–D) in Fig. 1 df are also shown. The red vertical line indicates the most highly transcribed region of the Eleanors, named Eleanor2, which corresponds to part of the breast cancer-associated lncRNA BRCAT32. The primer site A is in the Eleanor2-coding site. Sites A, B, and C were suggested to have open chromatin conformations, while site D was predicted to be closed, according to the FAIRE-seq track above. b Enlarged view of the region surrounding Eleanor2, which is highly conserved among mammals. Eleanor2 and BRCAT32 are transcribed in the opposite orientation from the CCDC170 gene (arrows). c Eleanor2 RNA is highly expressed in LTED cells. The qRT-PCR values of ESR1 mRNA and Eleanor2 RNA relative to the control GAPDH mRNA are shown. The expression of Eleanor2 RNA was not detectable in MCF10A cells (marked as nd). d RNA-FISH visualizing RNA foci containing Eleanor2. The Eleanor2-BAC DNA was used as the probe (green). DNA was counterstained with DAPI (blue). Scale bar, 10 μm. e Transcripts from the Eleanor2 region, but not the ERBB2 region, were colocalized with the ESR1 region in the RNA clouds. The BAC-DNA clones were used as the probe. Scale bar, 10 μm. The maximum intensity z-projection of each channel is shown. f FAIRE-qPCR showing that the Eleanor chromatin forms an open configuration in LTED cells. Values represent amounts of DNA in the nucleosome-free fraction relative to the input DNA. Data presented in c and f are means ± s.e.m. (n = 3, biologically independent samples). P-values were calculated using the unpaired, two-tailed, Student’s t test (*P < 0.05, **P < 0.01, ***P < 0.001).
Fig. 2
Fig. 2. The Eleanor2 RNA destabilizes the nucleosome.
a Schematic representation of the nucleosome thermal stability assay. In this assay, SYPRO Orange binds to the hydrophobic surfaces of heat-denatured histones, but not DNA and RNA. The fluorescence signal from SYPRO Orange bound to histones is detected. The first and second peaks correspond to the dissociation phases of the H2A–H2B and H3–H4 complexes from the nucleosome, respectively. b Thermal stability curves of the nucleosome (1.25 μM) in the presence or absence of Eleanor2 DNA (0.62 μM) or RNA (1.25 μM). The fluorescence intensity was plotted against the temperature (from 30 °C to 95 °C). The means ± s.d. (n = 3) are shown. c Thermal stability curves of the H3–H4 and DNA complex (1.25 μM) in the presence or absence of the Eleanor2 RNA (1.25 μM). The means ± s.d. (n = 3) are shown. d Thermal stability curves of the nucleosome (1.25 μM) with increasing amounts of the Eleanor2 RNA (0.125, 0.625, 1.25, and 2.5 μM). Means ± s.d. (n = 3) are shown. The source data for the thermal stability assay are shown in Supplementary Fig. 6.
Fig. 3
Fig. 3. Thermal stability assay with the Eleanor2 RNA fragments.
a The Eleanor2 RNA secondary structures predicted by CentroidFold. RNA fragments employed in this assay are encircled by red ellipses with base numbers, 250–302 and 320–447. b Purified Eleanor2 RNA fragments transcribed in vitro were analyzed by 8% polyacrylamide/7 M urea denaturing gel electrophoresis with ethidium bromide staining. The uncropped gel image is shown in Supplementary Fig. 5. c Thermal stability curves of the nucleosome (1.25 μM) with Eleanor2 RNA fragments. Equimolar amounts (in moles of nucleotides) of the full-length Eleanor2 RNA (1–656) (1.25 μM), Eleanor2 (250–302) (14.0 μM), and Eleanor2 (320–447) (6.17 μM) were added to each reaction solution. The fluorescence intensity was plotted against the temperature (from 30 °C to 95 °C). Means ± s.d. (n = 3) are shown. The source data for the thermal stability assay are shown in Supplementary Fig. 7.
Fig. 4
Fig. 4. Thermal stability assay with other ncRNAs.
a Thermal stability curves of the nucleosome (1.25 μM) in the presence of MALAT1 RNA (0.22 μM). The amount of MALAT1 RNA (0.22 μM) corresponds to 1.25 μM Eleanor2 RNA in weight. Means ± s.d. (n = 3) are shown. b Thermal stability curves of the nucleosome (1.25 μM) in the presence of DSCAM-AS1 RNA (0.33 μM). The amount of DSCAM-AS1 RNA (0.33 μM) corresponds to 1.25 μM Eleanor2 RNA in weight. Means ± s.d. (n = 3) are shown. c Thermal stability curves of the nucleosome (1.25 μM) in the presence of XIST RNA (0.27 μM). The amount of XIST RNA (0.27 μM) corresponds to 1.25 μM Eleanor2 RNA in weight. Means ± s.d. (n = 3) are shown. d Thermal stability curves of the nucleosome (1.25 μM) in the presence of ESR1 mRNA (0.46 μM). The amount of ESR1 mRNA (0.46 μM) corresponds to 1.25 μM Eleanor2 RNA in weight. Means ± s.d. (n = 3) are shown. e Thermal stability curves of the nucleosome (1.25 μM) in the presence of poly(U) (265 ng/μl). The amount of poly(U) (265 ng/μl) corresponds to 1.25 μM Eleanor2 RNA in weight. Means ± s.d. (n = 3) are shown. The source data for the thermal stability assay are shown in Supplementary Fig. 8.
Fig. 5
Fig. 5. Eleanor2 RNA depletion reduced open chromatin conformation.
a Depletion of Eleanor2 RNA. LTED cells were treated with the indicated LNA (locked nucleic acid), and the expression of Eleanor2 RNA was measured by qRT-PCR. The values relative to the control GAPDH mRNA are shown. b The Eleanor RNA signal was suppressed with Eleanor2 RNA depletion. The Eleanor2-BAC was used as the probe for RNA FISH (green). Scale bar, 10 μm. c ATAC-seq showing that chromatin accessibility was reduced with Eleanor2 RNA depletion in LTED cells. Overview of the region, including the Eleanor2 site (highlighted in yellow). The RNA-seq and ATAC-seq tracks of LTED cells with the control LNA and Eleanor2 LNA were aligned against the genome reference GRCh37/hg19. d Enlarged view of the Eleanor2 site. ATAC-seq peaks of A, B, and C were reduced by the Eleanor2 depletion. e FAIRE-qPCR revealed that nucleosome-depleted DNA was decreased with Eleanor2 RNA depletion in LTED cells. Values represent amounts of DNA in the nucleosome-free fraction relative to the input DNA. Data presented in a, e are means ± s.e.m. (n = 3 biologically independent samples). P-values were calculated using the unpaired, two-tailed, Student’s t test (*P < 0.05, **P < 0.01, ***P < 0.001).

References

    1. Wolffe AP. Chromatin: Structure & Function. London, UK: Academic Press; 1998.
    1. Luger K, Mäder AW, Richmond RK, Sargent DF, Richmond TJ. Crystal structure of the nucleosome core particle at 2.8 Å resolution. Nature. 1997;389:251–260. doi: 10.1038/38444. - DOI - PubMed
    1. Bondarenko VA, et al. Nucleosomes can form a polar barrier to transcript elongation by RNA polymerase II. Mol. Cell. 2006;24:469–479. doi: 10.1016/j.molcel.2006.09.009. - DOI - PubMed
    1. Luger K, Dechassa ML, Tremethick DJ. New insights into nucleosome and chromatin structure: an ordered state or a disordered affair? Nat. Rev. Mol. Cell Biol. 2012;13:436–447. doi: 10.1038/nrm3382. - DOI - PMC - PubMed
    1. Petesch SJ, Lis JT. Overcoming the nucleosome barrier during transcript elongation. Trends Genet. 2012;28:285–294. doi: 10.1016/j.tig.2012.02.005. - DOI - PMC - PubMed

Publication types