. 2020 Feb 11;10(1):2333.
doi: 10.1038/s41598-020-59355-y.

TRPM7 contributes to progressive nephropathy

Affiliations

TRPM7 contributes to progressive nephropathy

Sayuri Suzuki et al. Sci Rep. .

Abstract

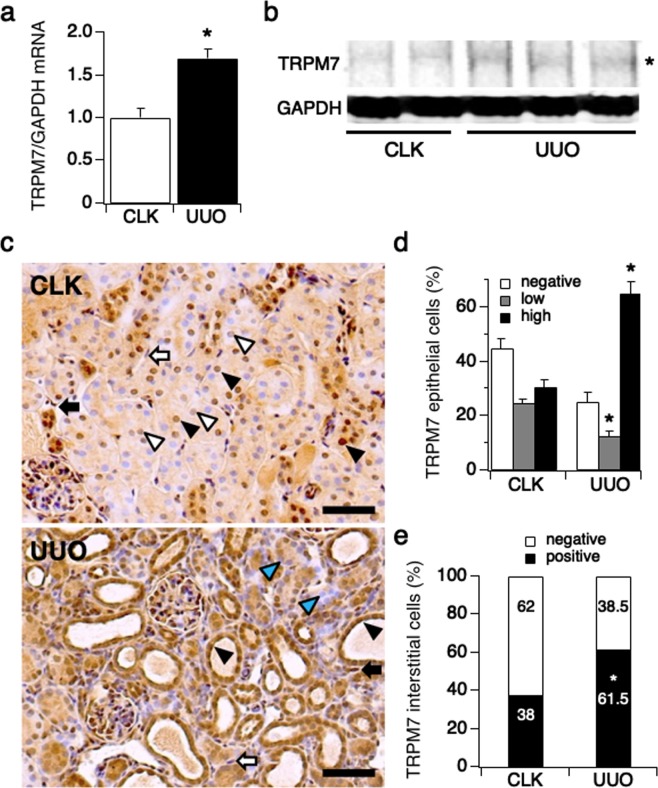
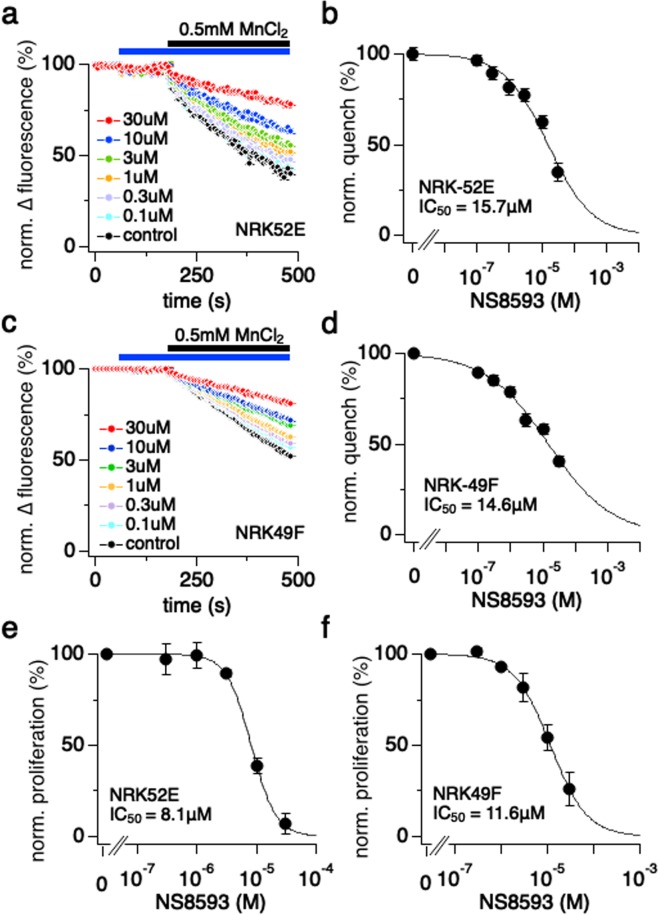
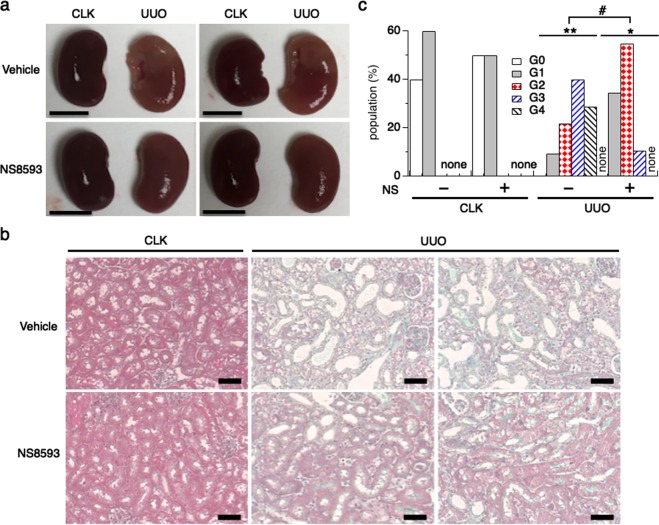
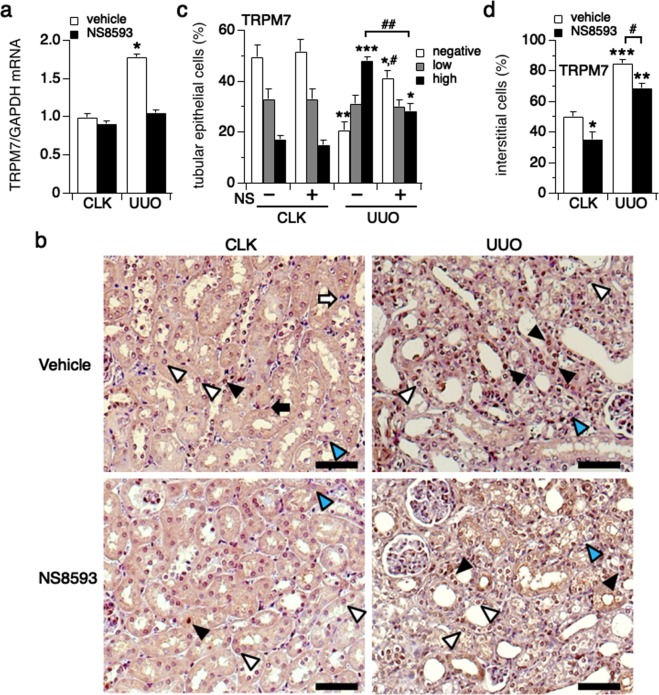
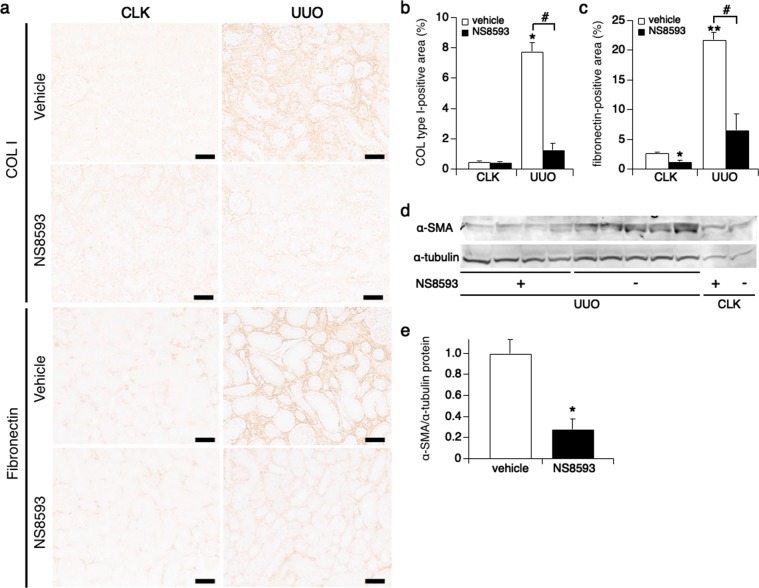
TRPM7 belongs to the Transient Receptor Potential Melastatin family of ion channels and is a divalent cation-conducting ion channel fused with a functional kinase. TRPM7 plays a key role in a variety of diseases, including neuronal death in ischemia, cancer, cardiac atrial fibrillation, malaria invasion. TRPM7 is aberrantly over-expressed in lung, liver and heart fibrosis. It is also overexpressed after renal ischemia-reperfusion, an event that induces kidney injury and fibrosis. However, the role of TRPM7 in kidney fibrosis is unclear. Using the unilateral ureteral obstruction (UUO) mouse model, we examined whether TRPM7 contributes to progressive renal damage and fibrosis. We find that TRPM7 expression increases in UUO kidneys. Systemic application of NS8593, a known TRPM7 inhibitor, prevents kidney atrophy in UUO kidneys, retains tubular formation, and reduces TRPM7 expression to normal levels. Cell proliferation of both tubular epithelial cells and interstitial cells is reduced by NS8593 treatment in UUO kidneys, as are TGF-β1/Smad signaling events. We conclude that TRPM7 is upregulated during inflammatory renal damage and propose that pharmacological intervention targeting TRPM7 may prove protective in progressive kidney fibrosis.


Conflict of interest statement

The authors declare no competing interests.

Figures

Figure 1
Figure 1
TRPM7 expression is up-regulated in renal damage. The left kidney was obstructed in C57BL/6 mice by ureter ligation (UUO mouse model, see Methods) inducing progressive kidney damage, (n = 5). After 7 days, obstructed (UUO kidneys) and non-obstructed contralateral kidneys (CLK kidneys) were collected from sacrificed mice. (a) The level of TRPM7 mRNA expression was assessed in tissue from cortical kidney using qRT-PCR. (*p < 0.001). (b) The level of TRPM7 protein expression was examined in cortical kidney tissue using western blotting. The full-length gel is presented in Suppl. Fig. S1c. (c) Upper panel: Representative picture of immunostaining against TRPM7 (magnification x200) in CLK kidneys, where white triangular arrows indicate low expression- and black triangular arrows high expression levels of TRPM7 in renal tubular epithelial cells. White arrows point to TRPM7-negative (TRPM7 staining not detectable) and black arrows point to TRPM7-positive renal interstitial cells. Lower panel: Representative picture of TRPM7 immunostaining in UUO kidneys, where TRPM7-high expression epithelial cells preferentially are localized in dilated renal tubules (black triangular arrow) and TRPM7-negative epithelial cells are localized in non-dilated tubules (blue triangular arrow) at day 7 after surgery. Scale bars represent 100 μm. (d) The percentage of TRPM7-high expression (black bar), TRPM7-low expression (gray bar) and non-detectable TRPM7 staining (white bar) in tubular epithelial cells assessed in a total of 10 non-overlapping fields. The average tubular epithelial cell number per field was 513 cells in CLK kidneys and 589 cells in UUO kidneys. *p < 0.001 vs. CLK kidneys. (e) The percentage of TRPM7-positive (black bar) or TRPM7-negative (non-detectable, white bar) interstitial cells assessed at same fields in (d). The average interstitial cell number per field was 121 cells in CLK kidneys and 444 cells in UUO kidneys. *p < 0.001 vs. CLK kidneys.
Figure 2
Figure 2
NS8593 suppresses Mn2+ influx and cell proliferation in epithelial and fibroblast kidney cells. (a) NRK-52E cells were investigated for the inhibitory efficacy of NS8593 in a TRPM7-specific bioassay, using Fura-2AM Mn2+ quench assessed with a fluorescent kinetic plate reader in 96-well format. The excitation wavelength was 360 nm. Control (0 μM), 0.1, 0.3, 1, 3, 10, 30 μM of NS8593 was added at 61 s for pre-incubation (blue bar). In a second application, the final concentration of 0.5 mM MnCl2 was added to each well at 181 s (black bar) (n = 4). (b) The graph shows the dose-response behavior of Mn2+ quench in response to increasing concentrations of NS8593. The percent quench of Fura-2AM fluorescence was assessed at 480 s into the experiment, averaged, plotted versus time and approximated with a dose-response fit. (c) Same experimental outline as in (a), assessed in the NRK-49F cell line (n = 4). (d) The graph shows the dose-response behavior of Mn2+ quench as in (b), assessed in the NRK-49F cell line. (e) The inhibitory effect of NS8593 on cell proliferation was examined in NRK-52E cells using the MTT assay (see Methods). Cells were incubated with increasing concentrations of NS8593 in a 96-well plate for 2 days, after which percent cell viability was evaluated, averaged, plotted and approximated with a dose-response fit (n = 3). (f) Same MTT experiment as in (e) but with NRK-49F cells (n = 3). Here cells were incubated with increasing concentrations of NS8593 for 3 days before the MTT analysis. The plate medium was exchanged every 24 hours with fresh medium supplemented with appropriate NS8593 concentrations.
Figure 3
Figure 3
NS8593 blocks TRPM7 currents in kidney cells. (a) Inhibitory effects of NS8593 on TRPM7 current in NRK-52E cells was investigated using whole-cell patch-clamp recordings. Average TRPM7-mediated outward currents at +80 mV and inward currents at −80 mV extracted from ramp currents delivered at 0.5 Hz and plotted as a function of time. 10 μM NS8593 (black circle, n = 15) was applied from 150 s (black bar). 0 μM NS8593 contained DMSO vehicle and was used as control (white circle, n = 8). (b) Average I/V curve of TRPM7 currents extracted before (148 s, dot lines) and after (300 s, solid lines) NS8593 application. Black lines represent control cells and red lines are NS8593 treatment cells. (c) Same experimental protocol as in (a), but recorded in NRK-49F cells. Black circles represent 10 μM NS8593 application (n = 11) and white circles represent vehicle control (n = 6). (d) Average I/V curve of TRPM7 on NRK-49F as in (b).
Figure 4
Figure 4
NS8593 attenuates kidney atrophy in the UUO mouse model. (a) Pictures of representative CLK and UUO kidneys isolated from UUO mice at day 7 after ureteral obstruction surgery. The non-treatment control group was injected with vehicle daily (n = 5, upper panels). NS8593 (5 mg/kg) was injected intraperitoneally daily from post-surgery day 0 to day 6 (n = 4, lower panel). Scale bars depict 5 mm. (b) Representative pictures of Masson’s trichrome staining taken from one CLK and two representative UUO kidney sections (magnification x200, see Methods). Collagen fibers, an indicator of degree of fibrosis, appear in green. The cytoplasm appears in light red. UUO kidneys in the NS8593 treatment group (lower right panels) have substantially reduced manifestation of green compared to control (upper right panels). Scale bars, 100 μm. (c) The intensities in (b) were graded semi-quantitatively, as follows: G0 (grade 0, 0%, white bars); G1 (grade 1, ≤20% in interstitial area colored green, grey bars); G2 (grade 2, 21–50%, red dot bars); G3 (grade 3, 51–80%, blue line bars) and G4 (grade 4, ≥81%, black line bars). Average grading of each mouse was used for statistical analysis. *p < 0.005; CLK vs. UUO kidney with NS8593 treatment, **p < 0.001; CLK vs. UUO kidney with non-treatment, #p < 0.005 comparing UUO kidneys in non-treatment vs. NS8593 treatment groups.
Figure 5
Figure 5
NS8593 suppresses TRPM7 expression in renal damage. (a) The level of TRPM7 mRNA expression was examined using UUO kidneys with (black bars) or without NS8593 treatment (white bars). *p < 0.005 compared to CLK kidneys in the non-treatment control group. (b) Representative slides of TRPM7 immunostaining (magnification x200) in the non-treatment (upper panels) and NS8593 treatment group (lower panels) both from CLK (left panels) and UUO kidneys (right panels). Scale bars are 100 μm. Triangular arrows indicate epithelial cells with TRPM7-high expression (black), TRPM7-low expression (white) and non-detectable (blue). Arrows point to interstitial cells that are either TRPM7-positive (black) or TRPM7-negative (white). (c) The graph plots the analysis of TRPM7 expression in tubular epithelial cells assessed in 10 representative and non-overlapping slides (negative, white bars; low expression, grey bars, high expression, black bars). The average tubular epithelial cell number per field was 338 cells in non-treatment CLK kidneys, 359 cells in CLK kidneys with NS8593 treatment, 418 cells in non-treatment UUO kidneys and 396 cells in UUO kidneys with NS8593 treatment. *p < 0.05 vs. CLK kidney with NS8593 treatment, **p < 0.005, ***p < 0.001 vs. CLK kidney with non-treatment, #p < 0.005, ##p < 0.001; UUO kidneys with non-treatment vs. NS8593 treatment. (d) Percentage of TRPM7-positive interstitial cells assessed in non-treatment control kidneys (white bars) versus NS8593 treatment (black bars). The average interstitial cell number per field was 90 cells in non-treatment CLK kidneys, 104 cells in CLK kidneys with NS8593 treatment, 207 cells in non-treatment UUO kidneys and 142 cells in UUO kidneys with NS8593 treatment. *p < 0.05 vs. CLK kidney with non-treatment, **p < 0.005 vs. CLK kidney with NS8593 treatment, ***p < 0.001 vs. CLK kidney with non-treatment, #p < 0.005 comparing UUO kidneys in non-treatment vs. NS8593 treatment groups.
Figure 6
Figure 6
Cell proliferation is suppressed by NS8593 in UUO kidneys. (a) Representative pictures of Ki67 immunostaining (magnification x200) from CLK (left panels) and UUO kidneys (right panels) in non-treatment group (upper panels) and NS8593 treatment group (lower panels). Scale bars are 100 μm. Black triangular arrow indicates Ki67-positive tubular epithelial cells. Black arrow points to Ki67-positive renal interstitial cells. (b) Quantitative analysis of Ki67-positive renal tubular epithelial cells assessed in 10 representative non-overlapping slides in kidneys from non-treatment (white bars) and NS8593 treatment-groups (black bar), in percent. *p < 0.05 vs. CLK kidney with NS8593 treatment. **p < 0.01 vs. CLK kidney in the non-treatment group, #p < 0.005; UUO kidneys with non-treatment vs. NS8593 treatment. (c) The graph plots the percentage of Ki67-positive interstitial cells assessed in 10 slides. *p < 0.005 vs. CLK kidney with non-treatment, #p = 0.001; UUO kidneys with non-treatment vs. NS8593 treatment. (d) Average number of epithelial cells counted per tubule in the analyzed field (see also Suppl. Fig. 3 for average number of tubules). *p < 0.001 vs. CLK kidneys with non-treatment, #p < 0.001 UUO kidneys with non-treatment vs. NS8593 treatment. (e) The number of total interstitial cells in a field is indicated. *p = 0.005 vs. CLK kidney with NS8593 treatment, **p < 0.001 vs. CLK kidney with non-treatment, #p < 0.001; UUO kidneys in non-treatment vs. NS8593 treatment groups.
Figure 7
Figure 7
Renal fibrosis is ameliorated by NS8593 treatment. (a) Representative pictures of immunostainings for collagen type I and fibronectin in CLK (left panels) and UUO kidneys (right panels, magnification x200) with or without NS8593 treatment. Scale bars are 100 μm. (b) The graph plots the average percentage of the collagen type I-positive area in kidneys in non-treatment (white bar) and NS8593 treatment groups (black bar). The staining intensity in the interstitum was computed using ImageJ software. *p < 0.001 vs. CLK kidney with non-treatment, #p < 0.001; UUO kidneys with non-treatment vs. NS8593 treatment. (c) The average percentage of fibronectin-positive areas is displayed for CLK and UUO kidneys with or without treatment. *p = 0.001 vs. CLK kidneys with non-treatment, **p < 0.001 vs. CLK kidney with non-treatment, #p = 0.001; UUO kidneys with non-treatment vs. NS8593 treatment. (d) The level of α-SMA protein expression was examined in cortical kidney tissue using western blotting. The full-length gel is indicated on Suppl. Fig. S5. (e) The intensity of α-SMA protein level computed from western blotting bands in (d) using Odyssey CLx Imaging System. The data were normalized by α-tubulin. *p < 0.005 vs. UUO kidneys with non-treatment.
Figure 8
Figure 8
Phosphorylation of Smad2 and Smad3 decreases in UUO kidneys treated with NS8593. mRNA levels of (a) TGF-β1, (b) Smad2 and (c) Smad3 in kidneys of the non-treatment group (white bar) and the NS8593 treatment group (black bar). *p < 0.005 vs. CLK kidneys with NS8593 treatment, **p < 0.001 vs. CLK kidneys with non-treatment in (a). *p < 0.01 vs. CLK kidneys with NS8593 treatment, **p < 0.001 vs. CLK kidneys with non-treatment in (b). *p < 0.01 vs. CLK kidneys with non-treatment, **p < 0.001 vs. CLK kidneys with NS8593 treatment in (c). #p < 0.05 CLK kidneys vs. UUO kidneys. (d) Representative immunostaining for Smad2 (pS467) and Smad3 (pS423/pS425) in CLK (left panels) and UUO kidneys (right panels, magnification x200) extracted from mice with or without NS8593 treatment. Scale bars, 100 μm. Triangular arrows point to positively stained tubular epithelial cells. (e) Average analysis of phosphorylated Smad2-positive kidney cells in control (white bar) and with NS8593 treatment (black bar), in percent. *p = 0.001 vs. CLK kidneys with non-treatment, #p < 0.001; UUO kidneys with non-treatment vs. NS8593 treatment. (f) The average percentage of phosphorylated Smad3-positive cells, *p < 0.05, ***p < 0.001 vs. CLK kidneys with non-treatment. **p < 0.01 vs. CLK kidneys with NS8593 treatment. #p < 0.001; UUO kidneys with non-treatment vs. NS8593 treatment. (g) The level of phosphorylated Smad3 protein expression was examined in cortical kidney tissue using western blotting. The full-length gel is indicated on Suppl. Fig. S7. (h) The level of TRPM7 protein expression stimulated by TGF-β1 (0, 0.4, 2, 5, 10 ng/ml) examined in NRK-52E kidney cells using western blotting. The full-length gel is indicated on Suppl. Fig. S9.

References

    1. Fleig A, Chubanov V. TRPM7. Handb. Exp. Pharmacol. 2014;222:521–546. doi: 10.1007/978-3-642-54215-2_21. - DOI - PMC - PubMed
    1. Trapani V, Arduini D, Cittadini A, Wolf FI. From magnesium to magnesium transporters in cancer: TRPM7, a novel signature in tumour development. Magnes. Res. 2013;26:149–155. - PubMed
    1. Nadolni W, Zierler S. The Channel-Kinase TRPM7 as Novel Regulator of Immune System Homeostasis. Cell. 2018;7:109. doi: 10.3390/cells7080109. - DOI - PMC - PubMed
    1. Chen W, et al. TRPM7 inhibitor carvacrol protects brain from neonatal hypoxic-ischemic injury. Mol. Brain. 2015;8:11. doi: 10.1186/s13041-015-0102-5. - DOI - PMC - PubMed
    1. Meng Z, Wang X, Yang Z, Xiang F. Expression of transient receptor potential melastatin 7 up-regulated in the early stage of renal ischemia-reperfusion. Transplant. Proc. 2012;44:1206–1210. doi: 10.1016/j.transproceed.2011.11.068. - DOI - PubMed

Publication types

MeSH terms

Substances