

MarkeTrak 10 (MT10) Survey Results Demonstrate High Satisfaction with and Benefits from Hearing Aids
- PMID: 32047346
- PMCID: PMC7010487
- DOI: 10.1055/s-0040-1701243
MarkeTrak 10 (MT10) Survey Results Demonstrate High Satisfaction with and Benefits from Hearing Aids
Abstract
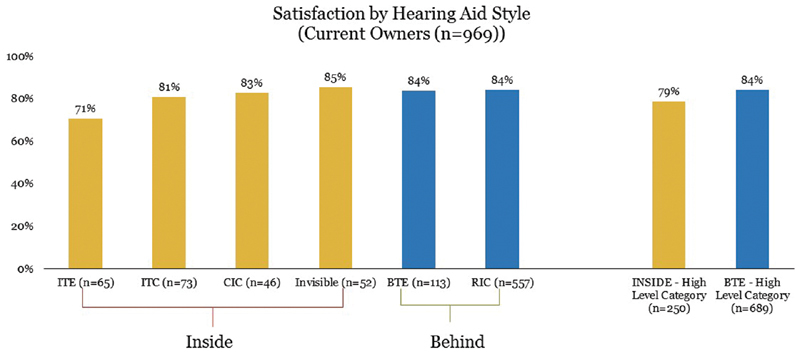
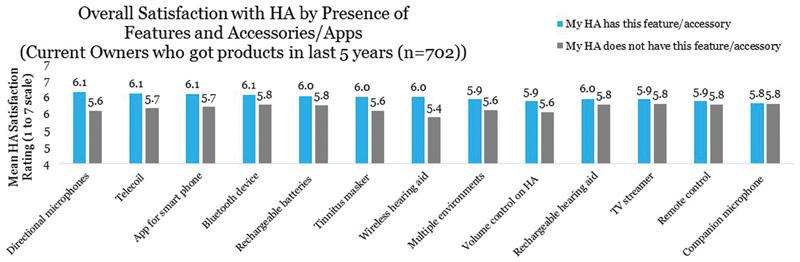
The purpose of this article is threefold. First, it is to evaluate current rates of hearing aid satisfaction, in addition to the examination of factors that influence satisfaction rates. A second purpose is to evaluate the effects of hearing aid use on mental health and quality of life, from the consumer perspective. The third purpose of this article is to review the current status of the market in terms of usage and ownership. The usage statistics from MarkeTrak 10 answer questions such as what is the most common type of hearing aid style. And what types of hearing aid features are popular? The results of the usage statistics provide not only insight into the satisfaction and quality-of-life metrics but also information about marketplace trends. By fulfilling these purposes, strengths and weaknesses of the current hearing aid marketplace can be determined, guiding future technological and clinical practice developments. Survey results demonstrate the continued dominance of mini-BTE (behind the ear) hearing aids and high popularity of features, including wireless capabilities. Overall satisfaction rates are encouragingly high, driven by satisfaction with BTE instruments, especially those acquired in the past 5 years. Noted areas for improvement continue to be related to listening in noise and patient understanding of their hearing aids. Given the high levels of noted satisfaction, it is not surprising that the sample revealed significant hearing aid benefits, notably in a lower risk for depression, higher satisfaction listening in almost all environments, and improved quality of life on a regular basis. Together, these data provide insights into the factors that drive satisfaction, encourage industrial and scientific advancements in the identified areas of weakness, and paint a bright picture of the hearing aid market from the consumer perspective.
Keywords: hearing aid; satisfaction; survey.
© Thieme Medical Publishers.
Figures


References
-
- Humes L E, Roberts L. Speech-recognition difficulties of the hearing-impaired elderly: the contributions of audibility. J Speech Hear Res. 1990;33(04):726–735. - PubMed
-
- Plomp R. A signal-to-noise ratio model for the speech-reception threshold of the hearing impaired. J Speech Hear Res. 1986;29(02):146–154. - PubMed
-
- Bronkhorst A W. The cocktail party phenomenon: a review of research on speech intelligibility in multiple-talker conditions. Acustica. 2000;86(01):117–128.
-
- Sherbecoe R L, Studebaker G A. Audibility-index functions for the connected speech test. Ear Hear. 2002;23(05):385–398. - PubMed
-
- Kramer S E, Kapteyn T S, Kuik D J, Deeg D J. The association of hearing impairment and chronic diseases with psychosocial health status in older age. J Aging Health. 2002;14(01):122–137. - PubMed
Publication types
LinkOut - more resources
Full Text Sources
Miscellaneous
