

Development of an Immune-Related Prognostic Signature in Breast Cancer
- PMID: 32047513
- PMCID: PMC6997532
- DOI: 10.3389/fgene.2019.01390
Development of an Immune-Related Prognostic Signature in Breast Cancer
Abstract
Background: Although increased early detection, diagnosis and treatment have improved the outcome of breast cancer patients, prognosis estimation still poses challenges due to the disease heterogeneity. Accumulating data indicated an evident correlation between tumor immune microenvironment and clinical outcomes.
Objective: To construct an immune-related signature that can estimate disease prognosis and patient survival in breast cancer.
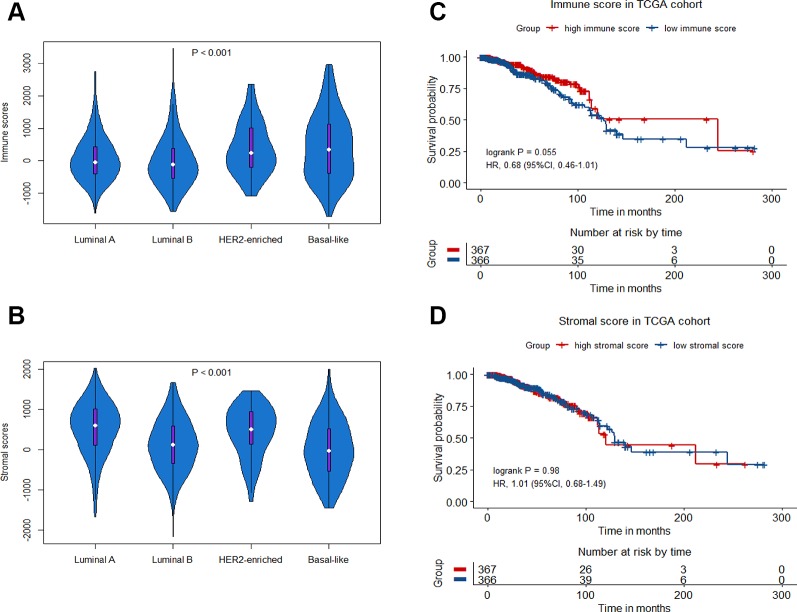
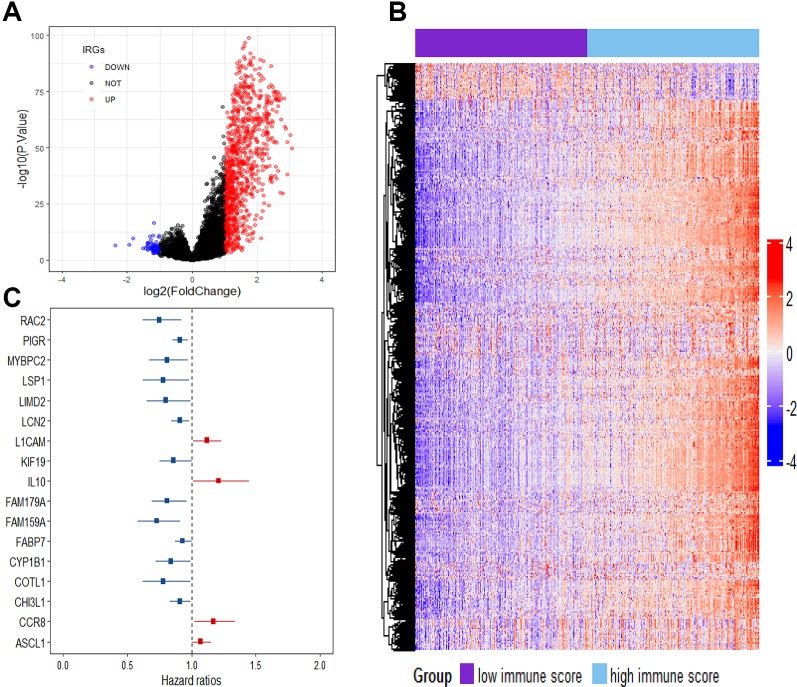
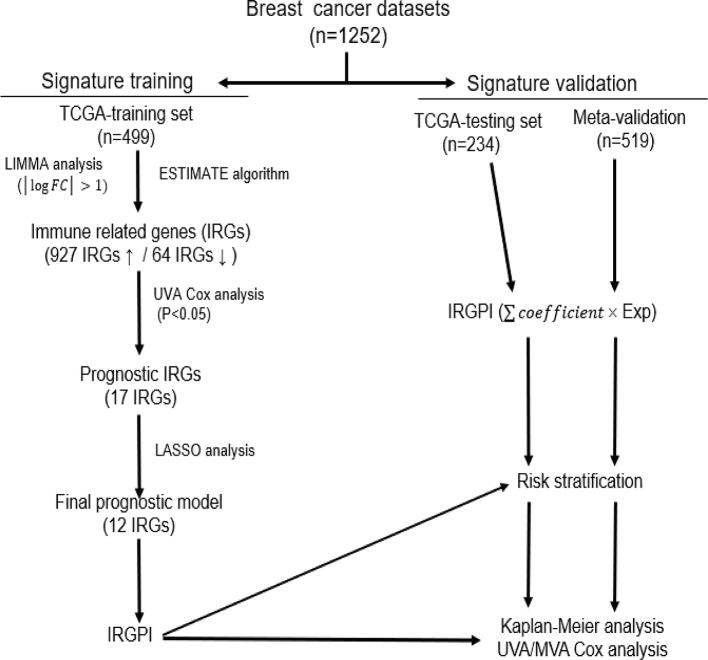
Methods: Gene expression profiles and clinical data of breast cancer patients were collected from The Cancer Genome Atlas (TCGA) and Gene Expression Omnibus (GEO) databases, which were further divided into a training set (n = 499), a testing set (n = 234) and a Meta-validation set (n = 519). In the training set, immune-related genes were recognized using combination of gene expression data and ESTIMATE algorithm-derived immune scores. An immune-related prognostic signature was generated with LASSO Cox regression analysis. The prognostic value of the signature was validated in the testing set and the Meta-validation set.
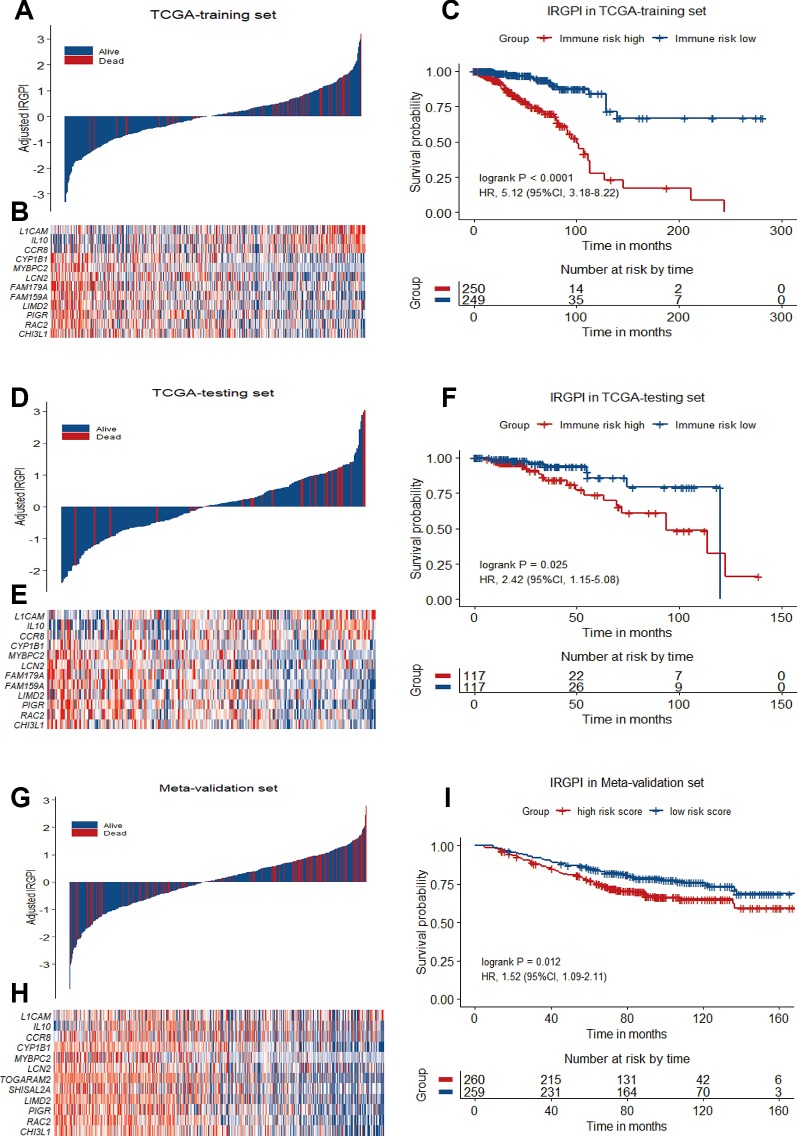
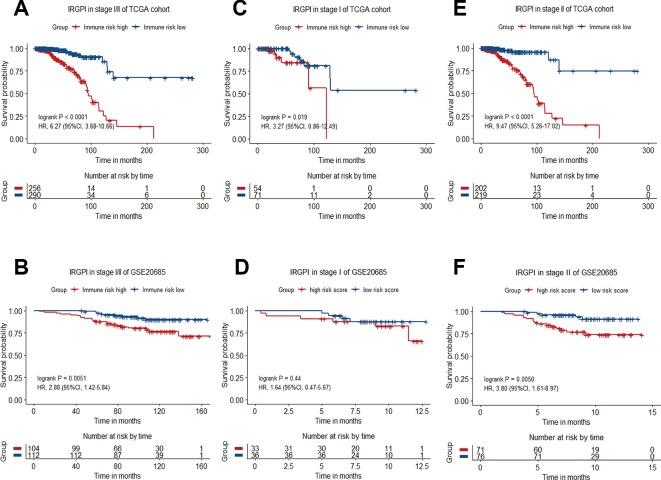
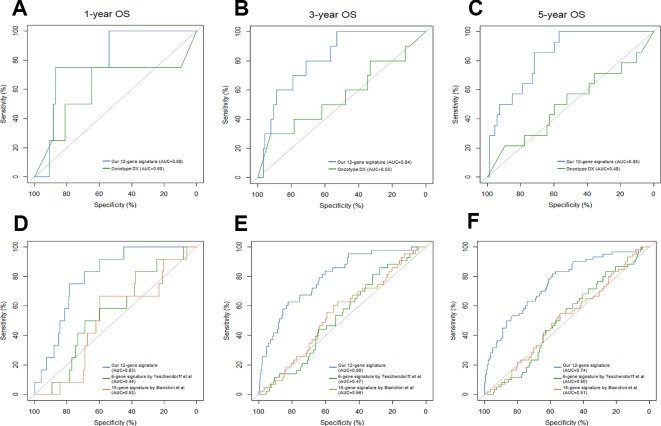
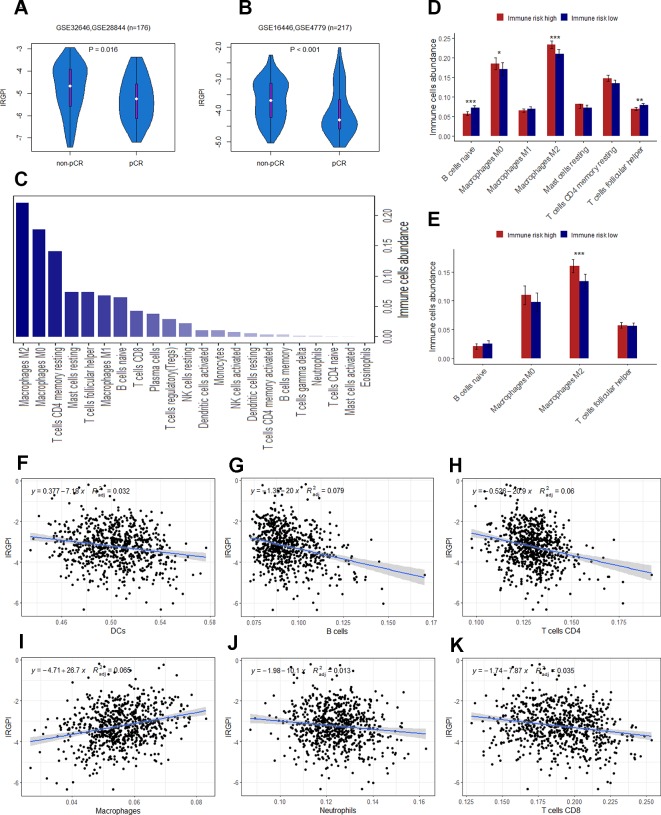
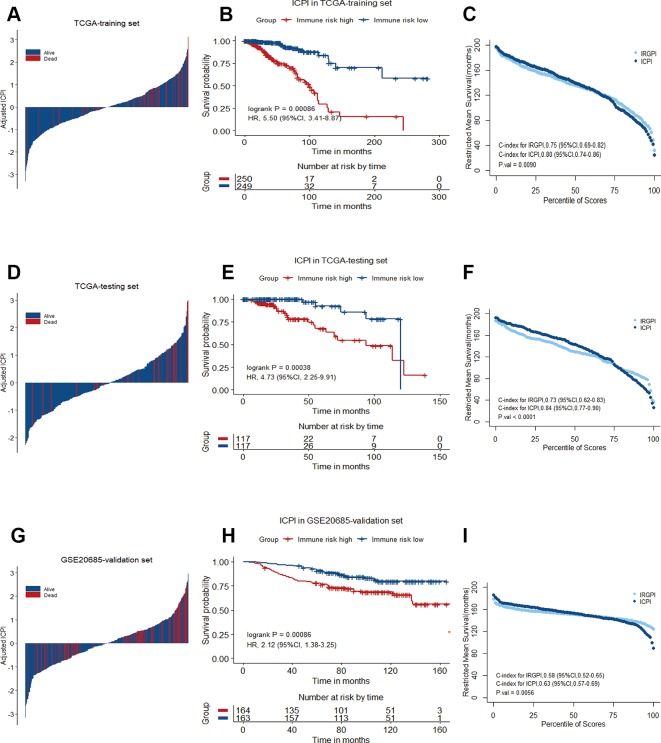
Results: A total of 991 immune-related genes were identified. Twelve genes with non-zero coefficients in LASSO analysis were used to construct an immune-related prognostic signature. The 12-gene signature significantly stratified patients into high and low immune risk groups in terms of overall survival independent of clinical and pathologic factors. The signature also significantly stratified overall survival in clinical defined groups, including stage I/II disease. Several biological processes, such as immune response, were enriched among genes in the immune-related signature. The percentage of M2 macrophage infiltration was significantly different between low and high immune risk groups. Time-dependent ROC curves indicated good performance of our signature in predicting the 1-, 3- and 5-year overall survival for patients from the full TCGA cohort. Furthermore, the composite signature derived by integrating immune-related signature with clinical factors, provided a more accurate estimation of survival relative to molecular signature alone.
Conclusion: We developed a 12-gene prognostic signature, providing novel insights into the identification of breast cancer with a high risk of death and assessment of the possibility of immunotherapy incorporation in personalized breast cancer management.
Keywords: breast cancer; immune system; model statistical; prognosis; survival.
Copyright © 2020 Xie, Ma, Yu, An, He and Zhang.
Figures
Similar articles
-
Development and validation of a robust immune-related prognostic signature in early-stage lung adenocarcinoma.J Transl Med. 2020 Oct 7;18(1):380. doi: 10.1186/s12967-020-02545-z. J Transl Med. 2020. PMID: 33028329 Free PMC article.
-
Development and Validation of an Individualized Immune Prognostic Signature in Early-Stage Nonsquamous Non-Small Cell Lung Cancer.JAMA Oncol. 2017 Nov 1;3(11):1529-1537. doi: 10.1001/jamaoncol.2017.1609. JAMA Oncol. 2017. PMID: 28687838 Free PMC article.
-
A novel immunogenomic signature to predict prognosis and reveal immune infiltration characteristics in pancreatic ductal adenocarcinoma.Precis Clin Med. 2022 Apr 25;5(2):pbac010. doi: 10.1093/pcmedi/pbac010. eCollection 2022 Jun. Precis Clin Med. 2022. PMID: 35694712 Free PMC article.
-
Immune-related lncRNAs as predictors of survival in breast cancer: a prognostic signature.J Transl Med. 2020 Nov 23;18(1):442. doi: 10.1186/s12967-020-02522-6. J Transl Med. 2020. PMID: 33225954 Free PMC article.
-
Identification of the prognostic value of ferroptosis-related gene signature in breast cancer patients.BMC Cancer. 2021 May 31;21(1):645. doi: 10.1186/s12885-021-08341-2. BMC Cancer. 2021. PMID: 34059009 Free PMC article.
Cited by
-
Identification of Immune-Related Prognostic Biomarkers Based on the Tumor Microenvironment in 20 Malignant Tumor Types With Poor Prognosis.Front Oncol. 2020 Jul 31;10:1008. doi: 10.3389/fonc.2020.01008. eCollection 2020. Front Oncol. 2020. PMID: 32903590 Free PMC article.
-
A signature of immune-related genes correlating with clinical prognosis and immune microenvironment in sepsis.BMC Bioinformatics. 2023 Jan 17;24(1):20. doi: 10.1186/s12859-023-05134-1. BMC Bioinformatics. 2023. PMID: 36650470 Free PMC article.
-
Three Genes Predict Prognosis in Microenvironment of Ovarian Cancer.Front Genet. 2020 Sep 2;11:990. doi: 10.3389/fgene.2020.00990. eCollection 2020. Front Genet. 2020. PMID: 32983229 Free PMC article.
-
FabNet: A Features Agglomeration-Based Convolutional Neural Network for Multiscale Breast Cancer Histopathology Images Classification.Cancers (Basel). 2023 Feb 5;15(4):1013. doi: 10.3390/cancers15041013. Cancers (Basel). 2023. PMID: 36831359 Free PMC article.
-
Identification of a distinctive immunogenomic gene signature in stage-matched colorectal cancer.J Cancer Res Clin Oncol. 2024 Dec 14;151(1):9. doi: 10.1007/s00432-024-06034-4. J Cancer Res Clin Oncol. 2024. PMID: 39673574 Free PMC article.
References
-
- Blows F. M., Driver K. E., Schmidt M. K., Broeks A., van Leeuwen F. E., Wesseling J., et al. (2010). Subtyping of breast cancer by immunohistochemistry to investigate a relationship between subtype and short and long term survival: a collaborative analysis of data for 10,159 cases from 12 studies. PLoS Med. 7, e1000279. 10.1371/journal.pmed.1000279 - DOI - PMC - PubMed
LinkOut - more resources
Full Text Sources