

p62 Suppressed VK3-induced Oxidative Damage Through Keap1/Nrf2 Pathway In Human Ovarian Cancer Cells
- PMID: 32047536
- PMCID: PMC6995367
- DOI: 10.7150/jca.34423
p62 Suppressed VK3-induced Oxidative Damage Through Keap1/Nrf2 Pathway In Human Ovarian Cancer Cells
Abstract
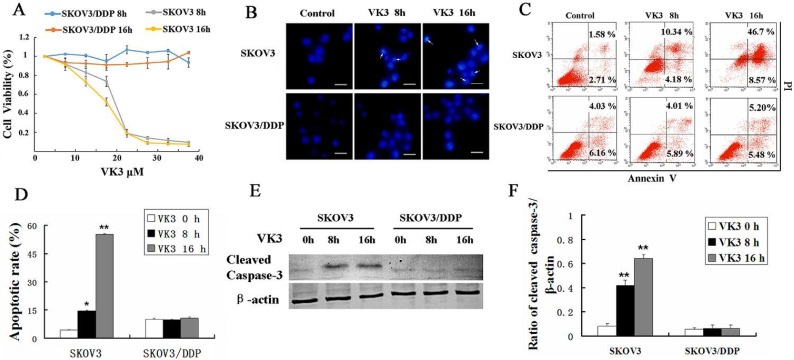
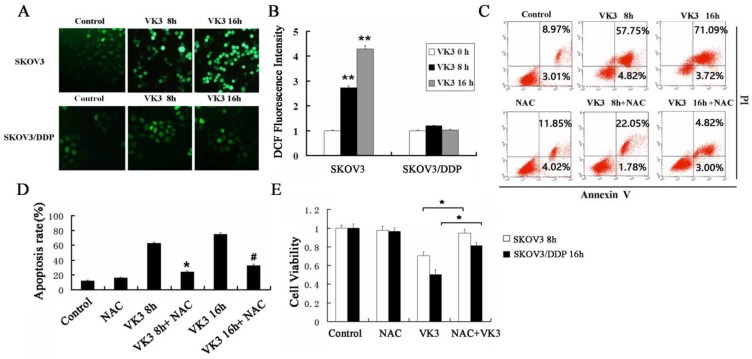
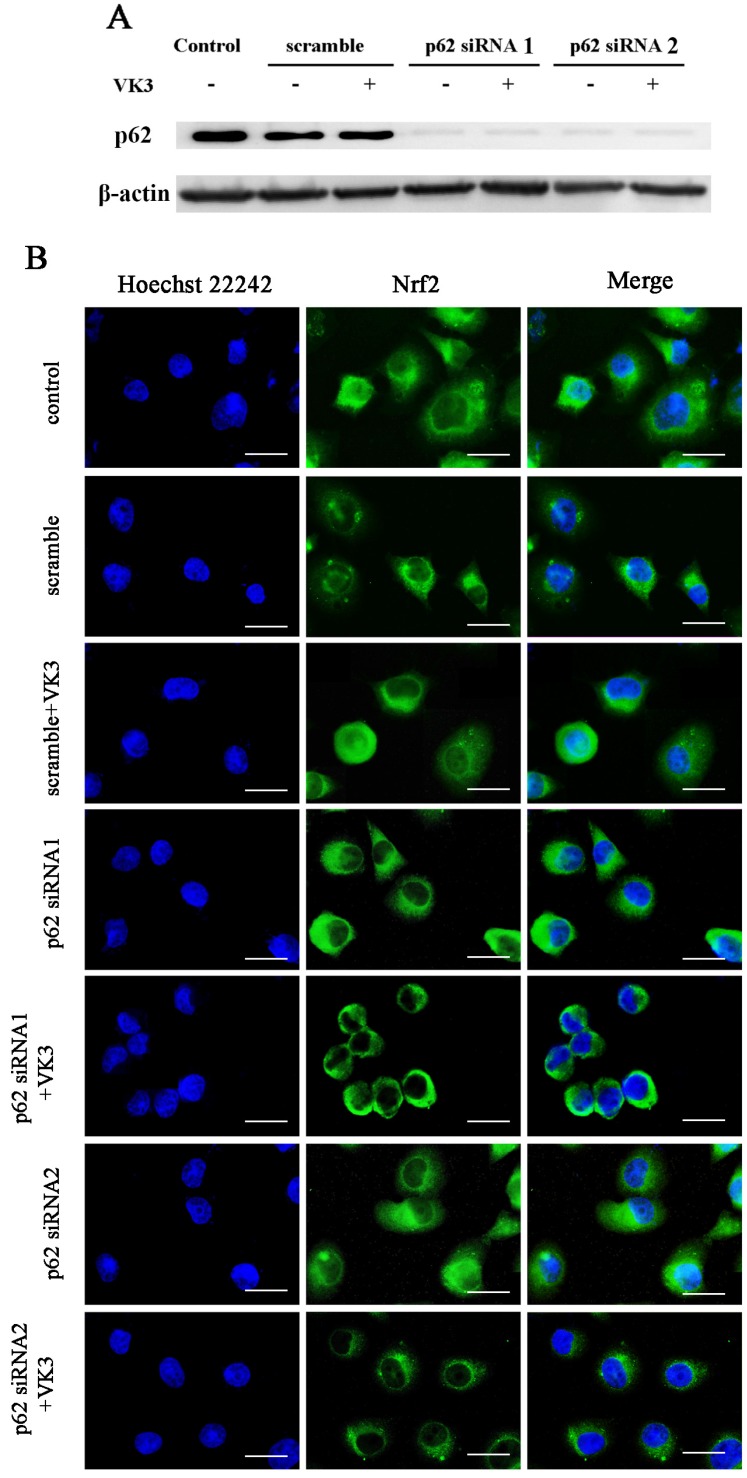
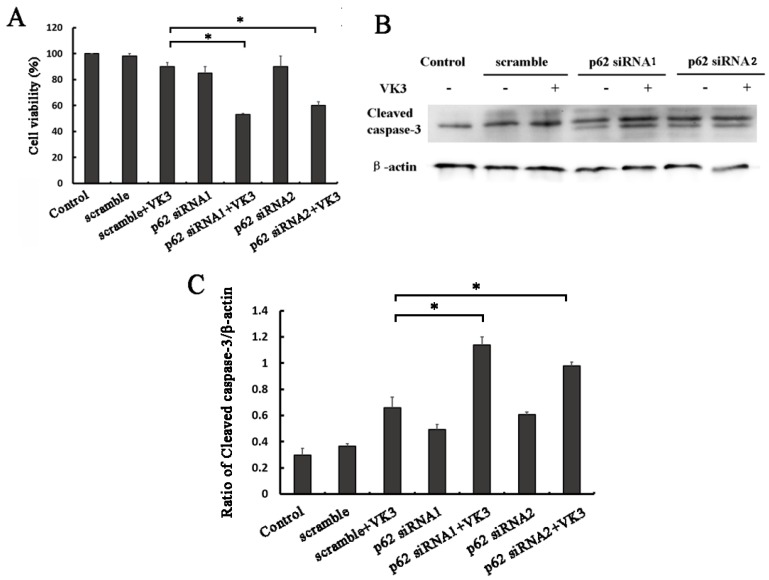
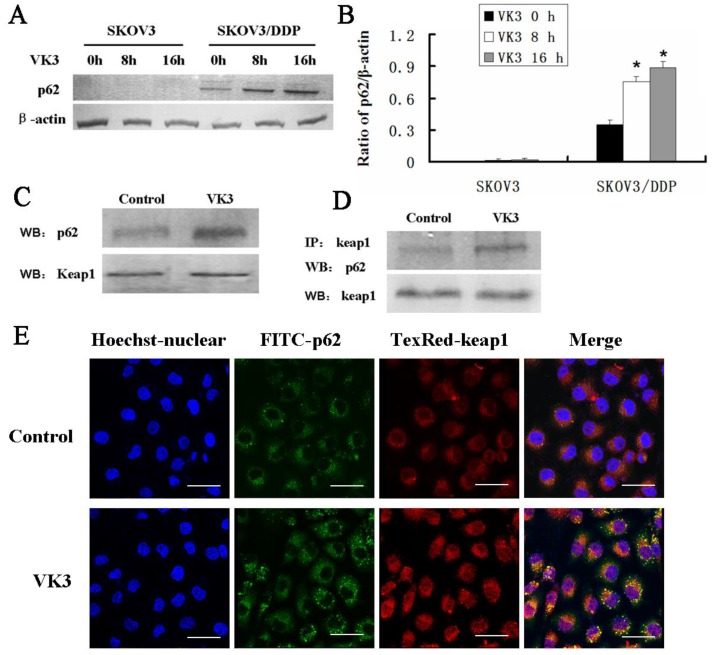
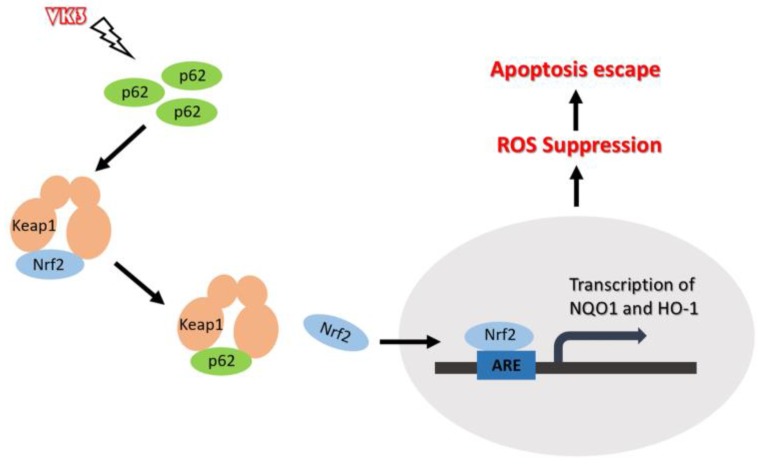
Imbalance of redox homeostasis may be responsible for the resistance of cancer to chemotherapy. Currently, increasing studies demonstrated that vitamin K3 (VK3), which promoted the production of ROS, had potential to be developed as an anti-tumor agent. We found SKOV3/DDP cells with high levels of p62 were insensitive to VK3 compared with SKOV3 cells. Furthermore, Nrf2 downstream antioxidant genes such as HO-1(heme oxygenase 1) and NQO1 (NAD (P) H: quinone oxidoreductase 1) were upregulated in SKOV3/DDP cells with VK3 treatment, which indicated VK3 activated Nrf2 signaling in SKOV3/DDP cells. Moreover, co-localization of p62 and Keap1 was also observed. Suppression of p62 expression increased the apoptosis induced by VK3, and the expression of Nrf2, HO-1 and NQO1 were all downregulated in SKOV3/DDP cells. Our results suggested that overexpressed p62 may protect cells from oxidative damage caused by VK3 through activating Keap1/Nrf2 signaling in ovarian cancer.
Keywords: Drug resistance; Keap1; Nrf2; ROS; VK3; p62.
© The author(s).
Conflict of interest statement
Competing Interests: The authors have declared that no competing interest exists.
Figures

Similar articles
-
p62/SQSTM1 protects against cisplatin-induced oxidative stress in kidneys by mediating the cross talk between autophagy and the Keap1-Nrf2 signalling pathway.Free Radic Res. 2019 Jul;53(7):800-814. doi: 10.1080/10715762.2019.1635251. Epub 2019 Jul 8. Free Radic Res. 2019. PMID: 31223046
-
p62/SQSTM1 is involved in cisplatin resistance in human ovarian cancer cells via the Keap1-Nrf2-ARE system.Int J Oncol. 2014 Dec;45(6):2341-8. doi: 10.3892/ijo.2014.2669. Epub 2014 Sep 24. Int J Oncol. 2014. PMID: 25269472
-
Severe Fever with Thrombocytopenia Syndrome Virus NSs Interacts with TRIM21 To Activate the p62-Keap1-Nrf2 Pathway.J Virol. 2020 Feb 28;94(6):e01684-19. doi: 10.1128/JVI.01684-19. Print 2020 Feb 28. J Virol. 2020. PMID: 31852783 Free PMC article.
-
Insights into the New Cancer Therapy through Redox Homeostasis and Metabolic Shifts.Cancers (Basel). 2020 Jul 7;12(7):1822. doi: 10.3390/cancers12071822. Cancers (Basel). 2020. PMID: 32645959 Free PMC article. Review.
-
Discovery of direct inhibitors of Keap1-Nrf2 protein-protein interaction as potential therapeutic and preventive agents.Acta Pharm Sin B. 2015 Jul;5(4):285-99. doi: 10.1016/j.apsb.2015.05.008. Epub 2015 Jul 2. Acta Pharm Sin B. 2015. PMID: 26579458 Free PMC article. Review.
Cited by
-
Insights into the Role of Oxidative Stress in Ovarian Cancer.Oxid Med Cell Longev. 2021 Oct 7;2021:8388258. doi: 10.1155/2021/8388258. eCollection 2021. Oxid Med Cell Longev. 2021. PMID: 34659640 Free PMC article. Review.
-
The Associated Regulatory Mechanisms of Zinc Lactate in Redox Balance and Mitochondrial Function of Intestinal Porcine Epithelial Cells.Oxid Med Cell Longev. 2020 Dec 17;2020:8815383. doi: 10.1155/2020/8815383. eCollection 2020. Oxid Med Cell Longev. 2020. PMID: 33381268 Free PMC article.
-
The Interplay between Autophagy and Redox Signaling in Cardiovascular Diseases.Cells. 2022 Apr 2;11(7):1203. doi: 10.3390/cells11071203. Cells. 2022. PMID: 35406767 Free PMC article. Review.
-
Role of Vitamin K in Selected Malignant Neoplasms in Women.Nutrients. 2022 Aug 18;14(16):3401. doi: 10.3390/nu14163401. Nutrients. 2022. PMID: 36014904 Free PMC article. Review.
-
Oncogenic microRNA-181d binding to OGT contributes to resistance of ovarian cancer cells to cisplatin.Cell Death Discov. 2021 Dec 8;7(1):379. doi: 10.1038/s41420-021-00715-6. Cell Death Discov. 2021. PMID: 34876558 Free PMC article.
References
-
- Backos DS, Franklin CC, Reigan P. The role of glutathione in brain tumor drug resistance. Biochemical Pharmacology. 2012;83:1005. - PubMed
LinkOut - more resources
Full Text Sources
Miscellaneous
