

Genome-wide Analysis of the Alternative Splicing Profiles Revealed Novel Prognostic Index for Kidney Renal Cell Clear Cell Carcinoma
- PMID: 32047561
- PMCID: PMC6995393
- DOI: 10.7150/jca.36998
Genome-wide Analysis of the Alternative Splicing Profiles Revealed Novel Prognostic Index for Kidney Renal Cell Clear Cell Carcinoma
Abstract
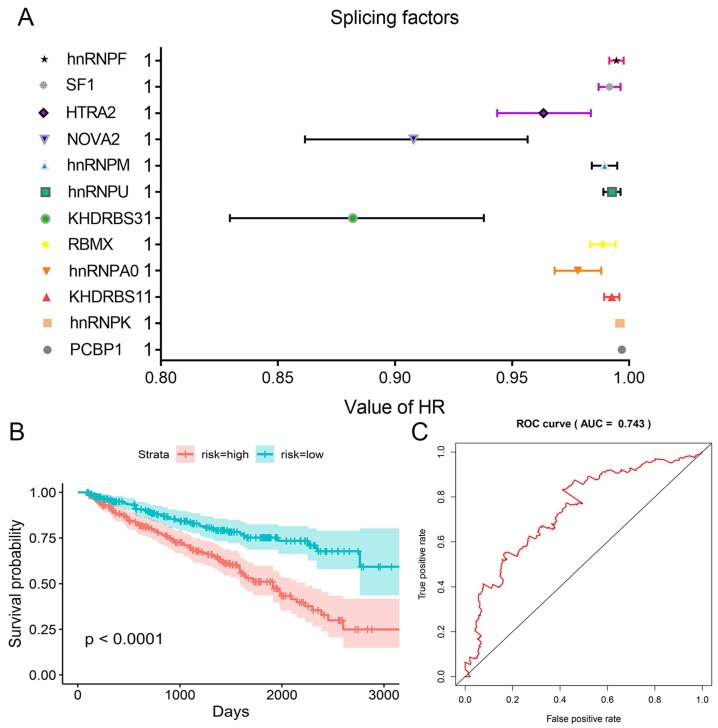
Alternative splicing (AS) is a major mechanism that greatly enhanced the diversity of proteome. Mounting evidence demonstrated that aberration of AS are important steps for the initiation and progression of human cancers. Here, we comprehensively investigated the association between whole landscape of AS profiles and the survival outcome of renal cell carcinoma (RCC) patients using RNA-seq data from TCGA SpliceSeq. Because of the limited number size of deaths in kidney chromophobe renal cell carcinoma (KICH) and papillary renal cell carcinoma (KIRP) TCGA cohorts, we only conducted survival analysis in kidney clear renal cell carcinoma (KIRC). We further constructed prognostic index (PI) based on prognosis-related AS events and built correlation network for splicing factors and prognosis-related AS events. According to the results, a total of 5351 AS events in 3522 genes were significantly correlated with the overall survival (OS) of kidney clear cell renal cell carcinoma (KIRC) patients. Seven of the PI models exhibited preferable prognosis-predicting capacity for KIRC with PI-ALL reaching the highest area under curve value of 0.875. The splicing regulatory network between splicing factors and prognosis-related AS events depicted a tangled web of relationships between them. One of the splicing factors: KHDRBS3 was validated by immunohistochemistry to be down-regulated in KIRC tissues. In conclusion, the powerful efficiency of risk stratification of PI models indicated the potential of AS signature as promising prognostic markers for KIRC and the splicing regulation network provided possible genetic mechanism of KIRC.
Keywords: alternative splicing; kidney clear renal cell carcinoma; prognostic index; splicing factor; the cancer genome atlas..
© The author(s).
Conflict of interest statement
Competing Interests: The authors have declared that no competing interest exists.
Figures


Similar articles
-
Systematic analysis of alternative splicing signature unveils prognostic predictor for kidney renal clear cell carcinoma.J Cell Physiol. 2019 Dec;234(12):22753-22764. doi: 10.1002/jcp.28840. Epub 2019 May 29. J Cell Physiol. 2019. PMID: 31140607 Free PMC article.
-
Systematic analysis of survival-associated alternative splicing signatures in clear cell renal cell carcinoma.J Cell Biochem. 2020 Oct;121(10):4074-4084. doi: 10.1002/jcb.29590. Epub 2019 Dec 30. J Cell Biochem. 2020. PMID: 31886566
-
System analysis of VEGFA in renal cell carcinoma: The expression, prognosis, gene regulation network and regulation targets.Int J Biol Markers. 2022 Mar;37(1):90-101. doi: 10.1177/17246008211063501. Epub 2021 Dec 6. Int J Biol Markers. 2022. PMID: 34870494
-
Landscape analysis of alternative splicing in kidney renal clear cell carcinoma and their clinical significance.Aging (Albany NY). 2024 Jun 10;16(11):10016-10032. doi: 10.18632/aging.205915. Epub 2024 Jun 10. Aging (Albany NY). 2024. PMID: 38862257 Free PMC article.
-
Integrative data mining and meta-analysis to investigate the prognostic role of microRNA-200 family in various human malignant neoplasms: A consideration on heterogeneity.Gene. 2019 Oct 20;716:144025. doi: 10.1016/j.gene.2019.144025. Epub 2019 Aug 5. Gene. 2019. PMID: 31394177 Review.
Cited by
-
TF-RBP-AS Triplet Analysis Reveals the Mechanisms of Aberrant Alternative Splicing Events in Kidney Cancer: Implications for Their Possible Clinical Use as Prognostic and Therapeutic Biomarkers.Int J Mol Sci. 2021 Aug 16;22(16):8789. doi: 10.3390/ijms22168789. Int J Mol Sci. 2021. PMID: 34445498 Free PMC article.
-
Significance and Possible Biological Mechanism for CLDN8 Downregulation in Kidney Renal Clear Cell Carcinoma Tissues.World J Oncol. 2024 Aug;15(4):662-674. doi: 10.14740/wjon1869. Epub 2024 Jul 5. World J Oncol. 2024. PMID: 38993257 Free PMC article.
-
ROCK2-RNA interaction map reveals multiple biological mechanisms underlying tumor progression in renal cell carcinoma.Hum Cell. 2023 Sep;36(5):1790-1803. doi: 10.1007/s13577-023-00947-x. Epub 2023 Jul 7. Hum Cell. 2023. PMID: 37418232
References
-
- Ricketts CJ, De Cubas AA, Fan H. et al. The Cancer Genome Atlas Comprehensive Molecular Characterization of Renal Cell Carcinoma. Cell Rep. 2018;23:3698. - PubMed
-
- Fernandez-Pello S, Hofmann F, Tahbaz R. et al. A Systematic Review and Meta-analysis Comparing the Effectiveness and Adverse Effects of Different Systemic Treatments for Non-clear Cell Renal Cell Carcinoma. Eur Urol. 2017;71:426–436. - PubMed
LinkOut - more resources
Full Text Sources
Research Materials
Miscellaneous
