

Genetic associations with mathematics tracking and persistence in secondary school
- PMID: 32047651
- PMCID: PMC7002519
- DOI: 10.1038/s41539-020-0060-2
Genetic associations with mathematics tracking and persistence in secondary school
Abstract
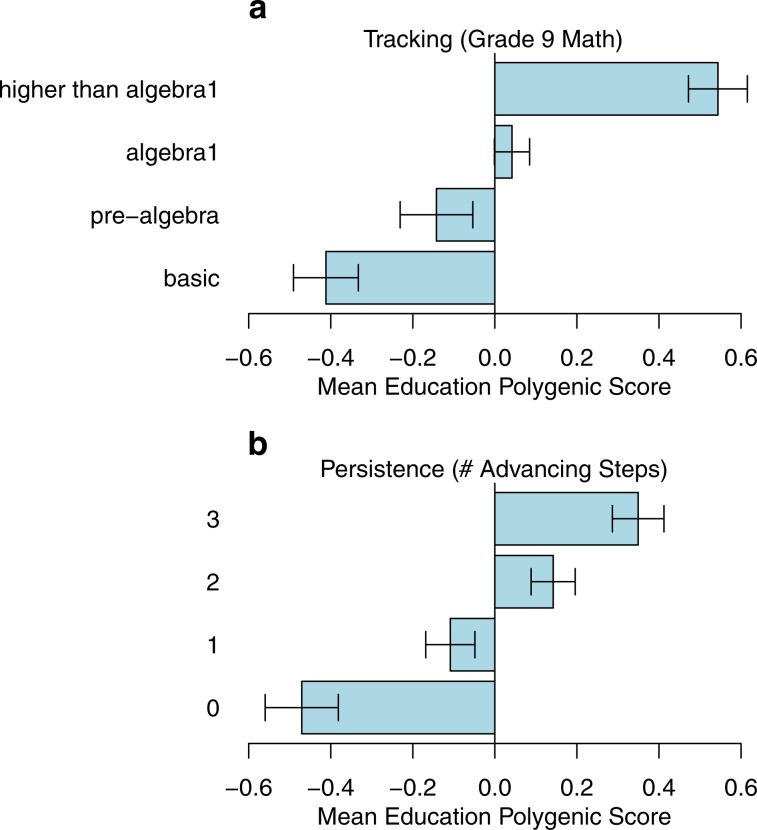
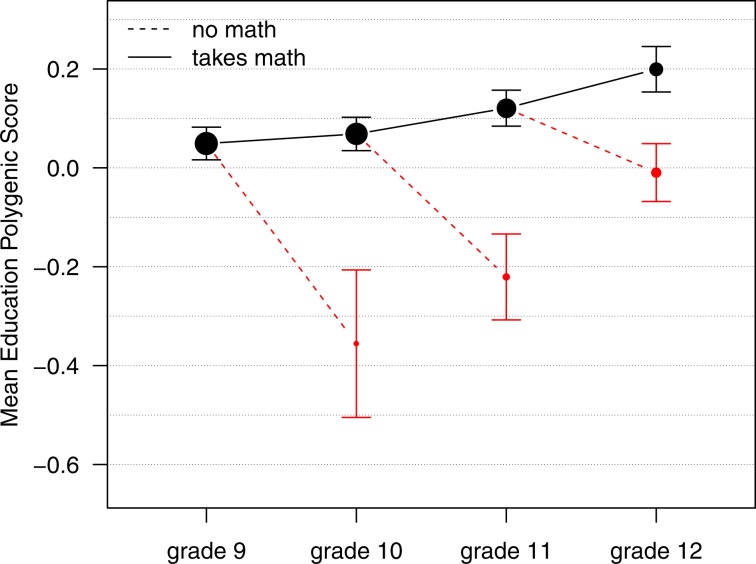
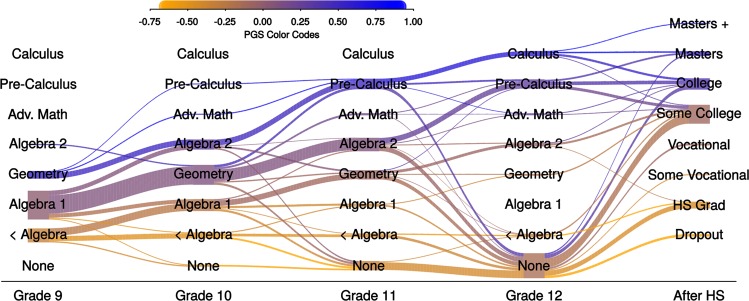
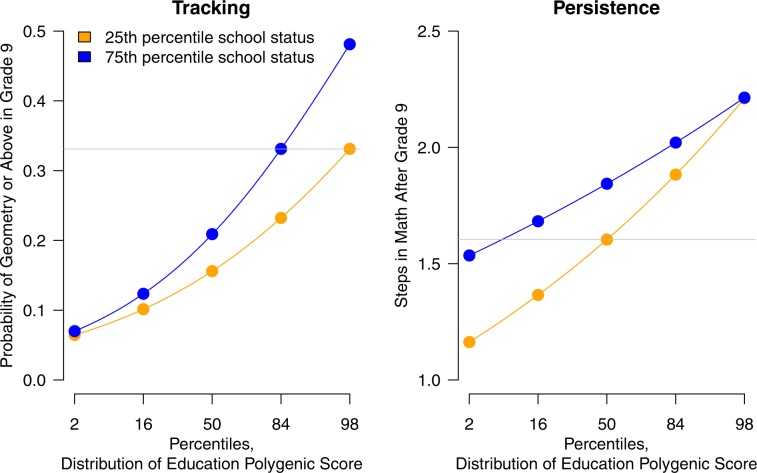
Maximizing the flow of students through the science, technology, engineering, and math (STEM) pipeline is important to promoting human capital development and reducing economic inequality. A critical juncture in the STEM pipeline is the highly cumulative sequence of secondary school math courses. Students from disadvantaged schools are less likely to complete advanced math courses. Here, we conduct an analysis of how the math pipeline differs across schools using student polygenic scores, which are DNA-based indicators of propensity to succeed in education. We integrated genetic and official school transcript data from over 3000 European-ancestry students from U.S. high schools. We used polygenic scores as a molecular tracer to understand how the flow of students through the high school math pipeline differs in socioeconomically advantaged versus disadvantaged schools. Students with higher education polygenic scores were tracked to more advanced math already at the beginning of high school and persisted in math for more years. Analyses using genetics as a molecular tracer revealed that the dynamics of the math pipeline differed by school advantage. Compared to disadvantaged schools, advantaged schools buffered students with low polygenic scores from dropping out of math. Across all schools, even students with exceptional polygenic scores (top 2%) were unlikely to take the most advanced math classes, suggesting substantial room for improvement in the development of potential STEM talent. These results link new molecular genetic discoveries to a common target of educational-policy reforms.
Keywords: Education; Human behaviour.
© The Author(s) 2020.
Conflict of interest statement
Competing interestsThe authors declare no competing interests.
Figures
References
-
- Board, N. S. Revisiting the STEM workforce: A Companion to Science and Engineering Indicators 2014 (National Science Foundation VA, 2015).
-
- Aughinbaugh A. The effects of high school math curriculum on college attendance: Evidence from the NLSY97. Econ. Educ. Rev. 2012;31:861–870. doi: 10.1016/j.econedurev.2012.06.004. - DOI
-
- Long MC, Conger D, Iatarola P. Effects of high school course-taking on secondary and postsecondary success. Am. Educ. Res. J. 2012;49:285–322. doi: 10.3102/0002831211431952. - DOI
-
- Rose, H. & Betts, J. R. Math Matters: The Links Between High School Curriculum, College Graduation, And Earnings. (Public Policy Institute of CA 2001).
Grants and funding
LinkOut - more resources
Full Text Sources
