

Association between low estrogen receptor positive breast cancer and staining performance
- PMID: 32047851
- PMCID: PMC7002746
- DOI: 10.1038/s41523-020-0146-2
Association between low estrogen receptor positive breast cancer and staining performance
Abstract
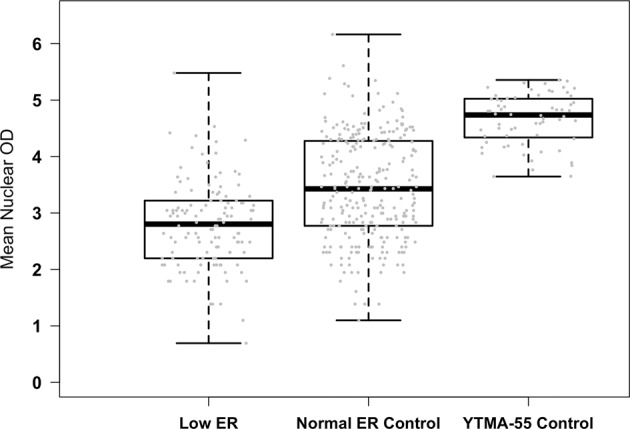
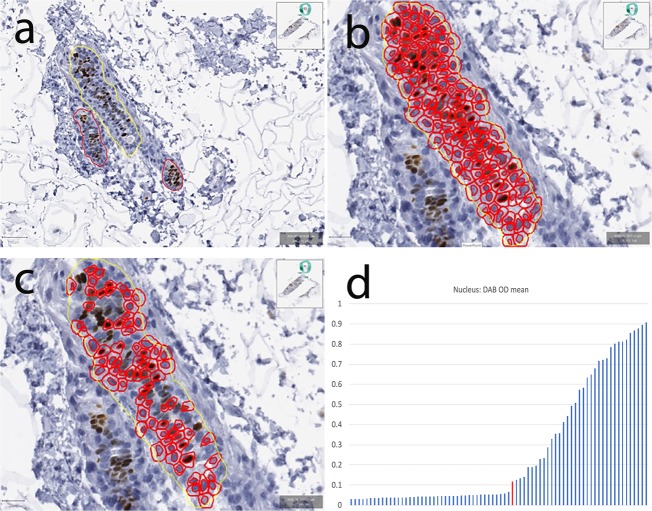
Estrogen receptor (ER) expression in breast carcinomas, determined by immunohistochemistry, indicates statistically significant benefit to endocrine therapy in patients with tumors expressing ER in ≥1% of tumor cells. Rare cases with low ER expression (1-10%) lead to the dilemma of treating these tumors as ER positive or negative. We hypothesize that low ER positive result from poor staining performance and that we may detect this artefact by assessing the average dynamic range of normal ducts adjacent to low ER positive tumors. Using quantitative tools, we compare the dynamic range of normal background ER expression in patients with low (1-10%) ER tumors to dynamic range of ER expression in normal epithelium from control patient populations, to determine if low ER cases are accompanied by decreased dynamic range. Low ER cases were infrequent (1% of invasive breast carcinomas). Twenty-one cases with low ER staining and two control cohorts, including a tissue microarray (TMA) of 10 benign breast sections and a group of 34 control breast carcinomas (reported as ER negative or >10% ER positive) with normal background epithelium, were digitally scanned. QuPath was utilized to quantify ER staining for each cell as the mean optical density of nuclear DAB staining. The dynamic range of ER expression in normal epithelium surrounding low ER tumors was significantly lower (range 2-240, median 16.5) than that of the benign epithelium in the control tumors (range 3-475, median 30.8; p < 0.001) and benign TMA sections (range 38-212, median 114; p < 0.001) suggesting inconsistent stainer performance.
Keywords: Breast cancer; Predictive markers; Tumour biomarkers.
© The Author(s) 2020.
Conflict of interest statement
Competing interestsD.R. works or has worked as a consultant to AstraZeneca, Agendia, Agilent, Amgen, Biocept, BMS, Cell Signaling Technology, Cepheid, Diiachi Sankyo, Merck, NanoString, Perkin Elmer, and Ultivue; has equity in PixelGear; and received research funding from AstraZeneca, Cepheid, Lilly, Navigate/Novartis, NextCure, NanoString, Ultivue, and Perkin Elmer. The remaining authors declare that they have no conflict of interest.
Figures

References
-
- Nkoy FL, et al. Variable specimen handling affects hormone receptor test results in women with breast cancer: a large multihospital retrospective study. Arch. Pathol. Lab Med. 2010;134:606–612. - PubMed
-
- Rhodes A, et al. Study of interlaboratory reliability and reproducibility of estrogen and progesterone receptor assays in Europe. Documentation of poor reliability and identification of insufficient microwave antigen retrieval time as a major contributory element of unreliable assays. Am. J. Clin. Pathol. 2001;115:44–58. doi: 10.1309/H905-HYC1-6UQQ-981P. - DOI - PubMed
-
- Rhodes A, Jasani B, Balaton AJ, Barnes DM, Miller KD. Frequency of oestrogen and progesterone receptor positivity by immunohistochemical analysis in 7016 breast carcinomas: correlation with patient age, assay sensitivity, threshold value, and mammographic screening. J. Clin. Pathol. 2000;53:688–696. doi: 10.1136/jcp.53.9.688. - DOI - PMC - PubMed
Grants and funding
LinkOut - more resources
Full Text Sources
