. 2020 Apr 15;29(6):1002-1017.
doi: 10.1093/hmg/ddaa024.

Transcriptional dysregulation in developing trigeminal sensory neurons in the LgDel mouse model of DiGeorge 22q11.2 deletion syndrome

Affiliations

Transcriptional dysregulation in developing trigeminal sensory neurons in the LgDel mouse model of DiGeorge 22q11.2 deletion syndrome

Thomas M Maynard et al. Hum Mol Genet. .

Erratum in

Abstract

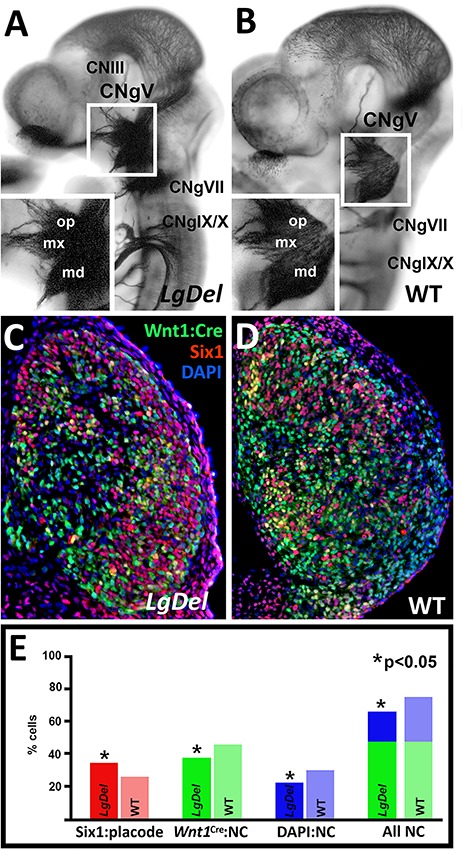
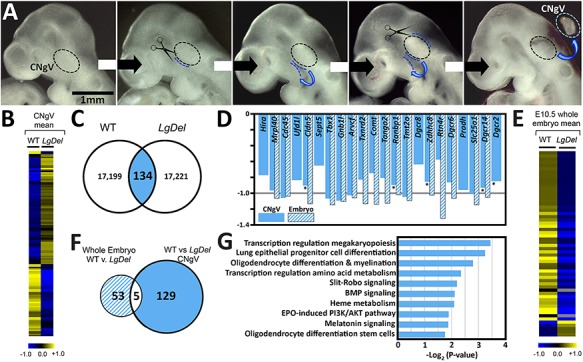
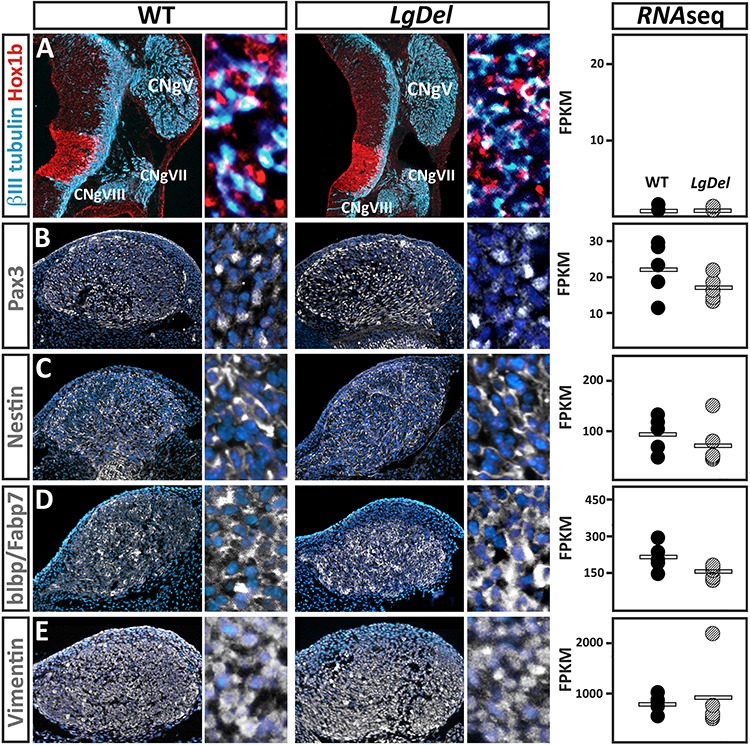
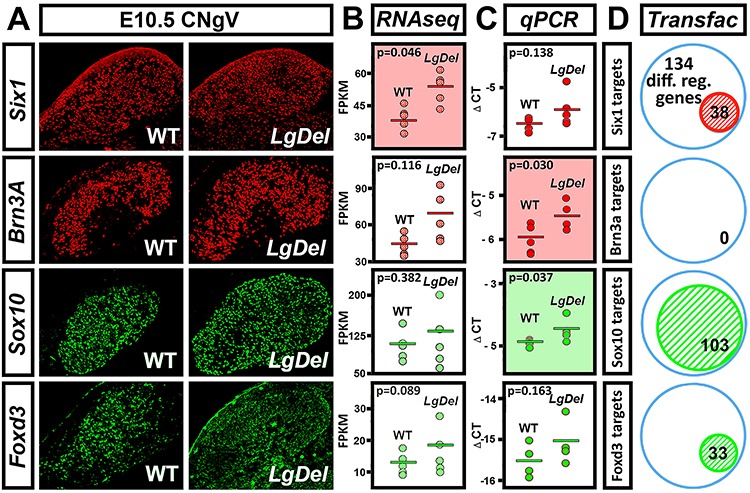
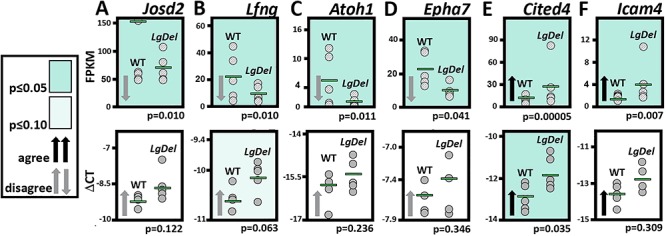
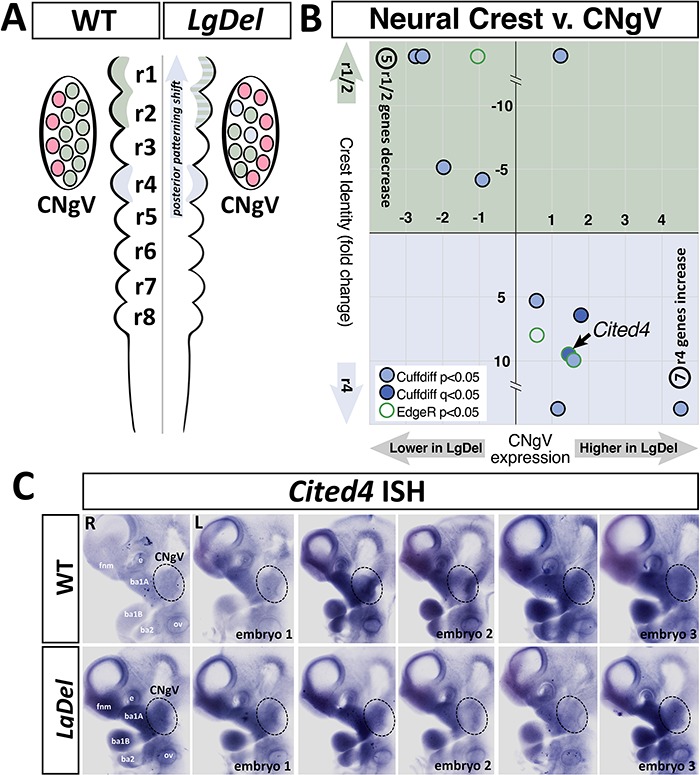
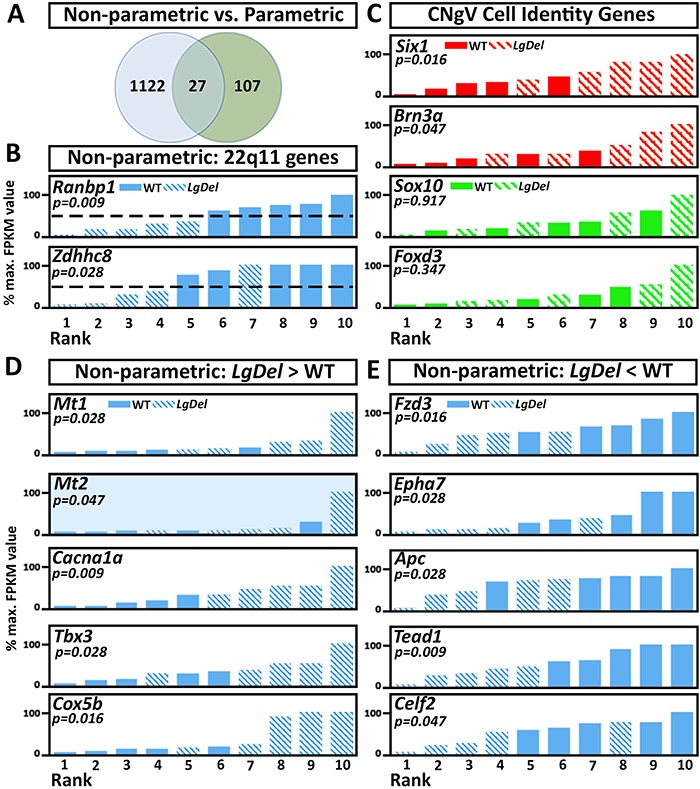
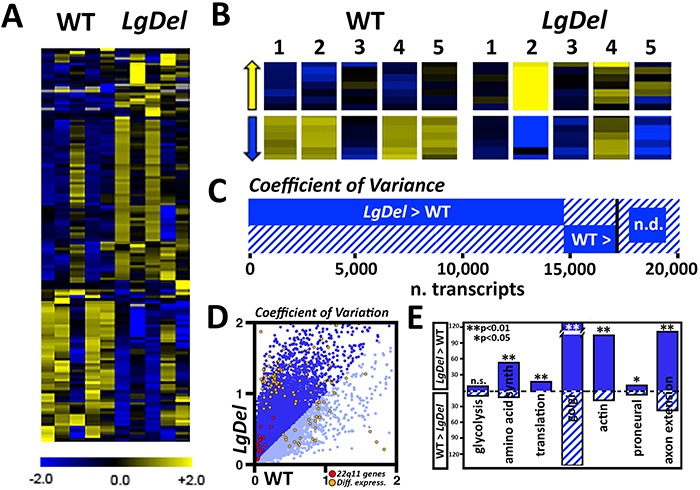
LgDel mice, which model the heterozygous deletion of genes at human chromosome 22q11.2 associated with DiGeorge/22q11.2 deletion syndrome (22q11DS), have cranial nerve and craniofacial dysfunction as well as disrupted suckling, feeding and swallowing, similar to key 22q11DS phenotypes. Divergent trigeminal nerve (CN V) differentiation and altered trigeminal ganglion (CNgV) cellular composition prefigure these disruptions in LgDel embryos. We therefore asked whether a distinct transcriptional state in a specific population of early differentiating LgDel cranial sensory neurons, those in CNgV, a major source of innervation for appropriate oropharyngeal function, underlies this departure from typical development. LgDel versus wild-type (WT) CNgV transcriptomes differ significantly at E10.5 just after the ganglion has coalesced. Some changes parallel altered proportions of cranial placode versus cranial neural crest-derived CNgV cells. Others are consistent with a shift in anterior-posterior patterning associated with divergent LgDel cranial nerve differentiation. The most robust quantitative distinction, however, is statistically verifiable increased variability of expression levels for most of the over 17 000 genes expressed in common in LgDel versus WT CNgV. Thus, quantitative expression changes of functionally relevant genes and increased stochastic variation across the entire CNgV transcriptome at the onset of CN V differentiation prefigure subsequent disruption of cranial nerve differentiation and oropharyngeal function in LgDel mice.


Figures

Figure 1
Figure 1
Divergent trigeminal nerve (CN V) differentiation and trigeminal ganglion (CNgV) cellular composition in the LgDel mouse model of 22q11.2 deletion syndrome (22q11DS). (A) A E10.5 LgDel embryo labeled for the early neuronal and axon marker βIII-tubulin, in which CN V axon fascicles extending peripherally from CNgV are sparse and dysmorphic. Inset: The differentiation of all three subdivisions of CNgV—op, mx and md—is compromised in concert with altered CN V axon growth. (B) A WT E10.5 embryo, the same gestational age as the LgDel in (A), in which there is robust, directed, fasciculated growth of CN V axons from a well-differentiated CNgV. Inset: The three subdivisions of CNgV and their associated axons are well defined, compared to the LgDel counterpart (A). (C) A transverse section through the LgDel E10.5 CNgV labeled immunohistochemically using Six1 (red), which distinguishes cranial placode-associated CNgV cells, Wnt1:Cre recombination lineage tracing (leading to constitutive eGFP reporter expression) for a subpopulation of CNgV neural crest cells (green); DAPI, which we have shown previously (11), identifies a second sub-population of primarily Foxd3-expressing neural crest cells (blue). There is a small population of cells identified by both Wnt1:Cre recombination and Six1 immunolabeling. Those cells have been excluded from the quantitative analysis summarized in the histogram in (D). (D) A section through the E10.5 WT CNgV, with cell classes labeled as described for (C). (E) Quantitative assessment of frequency of Six1 in LgDel (darker red) and WT (lighter red), Wnt1:Cre associated neural crest (LgDel: darker green, WT: lighter green), and DAPI presumed Foxd3 neural crest cells (LgDel: darker blue; WT: lighter blue); asterisks indicate significant differences, P < 0.05; (n = 11 WT, 9 LgDel ganglia from 8 WT, 5 LgDel embryos).
Figure 2
Figure 2
Quantitative characteristics of transcriptome divergence in LgDel and WT CNgV. (A) Images of E10.5 mouse embryos showing the step-wise microdissection approach used to harvest WT and LgDel CNgV. The dotted oval indicates the location of CNgV, the dotted blue lines indicate the incisions made by fine op dissecting scissors to isolate the ganglion. An isolated ganglion is shown at far right (dotted oval). (B) A heat map showing mean expression differences between WT and LgDel CNgV based on RNA-Seq transcriptome analysis of five biological replicates. The scale bar below the heat map (−1.0 to +1.0) is given on a log2 scale. (C) Venn diagram showing the distribution of differentially expressed genes in the WT versus LgDel CNgV. There are 134 genes with greater expression in either LgDel versus WT or WT versus LgDel. In addition, there are 9 transcripts in WT and 10 in LgDel that are apparently uniquely expressed. Each of these unique transcripts, in either genotype, is expressed at very low frequency and encodes either non-coding RNAs or other non-transcribed mRNAs. (D) Histogram showing detection (non-zero FPKM) and approximately 50% decreased expression levels (2-fold change) of 21 murine orthologues of human chromosome 22q11.2 genes deleted heterozygously in the LgDel CNgV (solid bars) and 15 of those orthologues detected non-zero values in the whole E10.5 embryo at a similar level of decreased expression (hatched bars). Of these genes, only five reach our criteria for expression and FDR levels in CNgV (asterisks). (E) A heat map showing average expression differences between whole E10.5 WT and LgDel whole embryos. The scale bar below the heat map (−1.0 to +1.0) is given on a log2 scale. (F) Venn diagram showing the minimal overlap of differentially expressed genes from the 134 identified in the comparison of WT versus LgDel CNgV and the 58 identified in the comparison of WT versus LgDel whole E10.5 embryos. There are only five of these genes, and four of them are 22q11 gene orthologues deleted heterozygously in the LgDel (see C). (G) A listing of the major GO terms associated with the RNA-Seq datasets for WT and LgDel CNgV.
Figure 3
Figure 3
Registration of cellular CNgV protein expression localization at E10.5 and RNA-Seq mRNA detection from micro-dissected CNgV. For the images demonstrating protein expression, the first panel shows the expression pattern of each protein recognized immunocytochemically in CNgV in each genotype, and the adjacent second panel shows the distribution of individual labeled cells for the same protein. (A) Hox1b protein is expressed in a very limited population of CNgV cells but highly expressed in rhombomere 4 (r4) in the hindbrain immediately adjacent to CNgV in both WT and LgDel. In parallel, Hox1b mRNA is expressed at very low (FPKM < 0.1) but equivalent levels in the WT and LgDel CNgV RNA-Seq datasets. (B) Pax3 protein is detected in a subset of CNgV cells in both WT and LgDel. Right: Pax3 mRNA is detected at relatively low but statistically indistinguishable levels (FPKM < 5.0) in the WT and LgDel CNgV RNA-Seq datasets. (C) Left: Blpb/Fabp1 protein is localized in a somewhat broader subset of CNgV cells in both WT and LgDel. Right: Blpb/Fabp1 mRNA is detected at intermediate but statistically indistinguishable levels (FPKM < 100) in the WT and LgDel CNgV RNA-Seq datasets. (D) Left: nestin protein is more broadly localized in CNgV cells in both WT and LgDel. Right: Nes mRNA is detected at moderate (FPKM < 300) but statistically indistinguishable levels in the WT and LgDel CNgV RNA-Seq datasets. (E) Left: vimentin protein is localized to nearly all CNgV cells in both WT and LgDel. Right: Vim mRNA is detected at high (FPKM < 1000) but statistically indistinguishable levels in the WT and LgDel CNgV RNA-Seq datasets.
Figure 4
Figure 4
Validation of LgDel versus WT CNgV transcriptome comparison based on expression of transcription factors associated with placodal or neural crest-associated CNgV neurons or precursors. (A) Protein expression of Six1, Brn3a, Sox10 and Six1 in the E10.5 CNgV of WT and LgDel embryos. (B) RNA-Seq determined expression levels of diagnostic transcription factors associated with E10.5 cranial placode-derived CNgV cells—Six1 and Brn3a—and neural crest-derived CNgV cells—Sox10 and Foxd3—in LgDel and WT CNgV. Expression levels determined by RNA-Seq are presented for each of the five biological replicates of WT and LgDel CNgV as FPKM values. (C) Expression levels determined by qPCR in a parallel set of five biological replicates of WT and LgDel CNgV pooled samples are presented as delta CT (ΔCT) values. (D) TRANSFAC computational analysis identifies subsets of the 134 genes differentially expressed in WT versus LgDel CNgV (see Fig. 2) as potential transcriptional targets for the diagnostic transcription factors associated with either placode-derived or neural crest-derived CNgV cells.
Figure 5
Figure 5
Comparison of expression differences for candidate genes identified by RNA-Seq using qPCR. (A–F) Differential expression validation for six candidate genes, chosen based on potential contributions to CNgV neuronal differentiation from among the full set of differentially expressed genes identified in the RNA-Seq dataset. Individual values (FPKM, top or ΔCT, bottom) are plotted for each gene. Green horizontal bars indicate mean expression values for each gene. Arrows indicate direction of expression change (up- or downregulated), and black versus gray shading indicates whether the qPCR and RNA-Seq mean expression differences are in agree (black) or do not agree (gray). The darker green shading indicates genes for which either the qPCR or RNA-Seq dataset identifies a statistically significant expression difference (P or FDR < 0.05). The lighter green shading indicates instances, where an apparent expression difference was detected and had a P value less than 0.1 in the qPCR validation.
Figure 6
Figure 6
A posterior shift of neural crest-associated genes is detected in the LgDel CNgV transcriptome. (A) Schematic of the WT (left) and LgDel (right) hindbrain indicating the posterior shift of gene expression in rhombomeres (r)2 and r3 in the LgDel as well as the potential for this altered gene expression to be transferred to CNgV due to migration of neural crest progenitors from r2 and r3 into the coalescing CNgV (blue cell icons, far right). (B) A quadrant plot of gene identity (A/P) defined by an independent RNA-Seq analysis (38) and CNgV expression levels detected in our RNA-Seq analysis. Note that Cited4, whose expression is apparently increased in LgDel CNgV, by both RNA-Seq and qPCR (see Fig. 5), is one of the genes whose A/P expression is shifted. (C) ISH of Cited4 mRNA in E10.5 WT and LgDel embryos. The dotted oval indicates CNgV. These embryos were hybridized together, genotypes distinguished by tail clip.
Figure 7
Figure 7
Non-parametric analysis of WT versus LgDel CNgV transcriptomes detects a greater number of significantly expression level differences in the two genotypes. (A) A summary of the number of significantly differentially expressed genes detected using non-parametric, rank-order based statistics and the Mann–Whitney U test of significance in the WT versus LgDel CNgV transcriptome. Nearly 10 times as many genes—1149—are detected at significance levels of P < 0.05 or less as compared with 134 detected using the previously described CuffDiff analysis, but only 27 transcripts are identified by both methods. (B) Non-parametric rank-order analysis detects significant 50% decrements in 22q11 gene expression with greater sensitivity. The most (Ranbp1) and least (Zdhhc8) abundant significantly different 22q11 transcripts are shown here. These values and all others in this figure are plotted in rank order, 1 through 10, left to right, and the expression values across both genotypes are displayed as percentage of the maximum expression value (100%). The dotted line indicates the 50% expression level. Mann–Whitney significance (P value) is given in italics. (C) Non-parametric analysis detects changes in expression levels of four diagnostic placode versus neural crest associated genes with accuracy similar to the parametric analysis. (D) Novel genes whose expression is detected as significantly increased based on non-parametric analysis in our RNA-Seq dataset. Mann–Whitney P value is given in italics. The shading (Mt2 non-parametric analysis histogram) indicates that qPCR assessment validated the RNA-Seq detected expression difference (P = 0.047; n = 5 pooled CNgV replicates/genotype). (E) Novel genes whose expression is detected as significantly decreased based on non-parametric analysis in our RNA-Seq dataset, presented as above. qPCR validation of transcripts shown in (D) and (E) is shown in Supplementary Table 5.
Figure 8
Figure 8
Transcriptome variation as a quantitative phenotype distinguishes LgDel and WT CNgV. (A) Heat maps for each of the five biological replicates of WT and LgDel CNgV assessed by RNA-Seq. Although there is some variation in the 5 WT replicates (e.g. compare replicate 3 with other WT samples), the variation in the 5 LgDel samples appears greater. The scale bar below the heat map is given on a log2 scale. (B) Higher resolution view of blocks from the heat map for both up- and downregulated genes confirms the impression of greater variability in the LgDel samples. (C) Summary plot of the proportion of 17 128 total genes with non-zero reads with a higher coefficient of variance (CV) in LgDel (14 996) than WT (2187), as detailed in Supplemental Table 2. (D) Scatterplot comparing CV in WT (x-axis) versus CV in LgDel (y-axis). Darker blue indicates higher CV in LgDel versus lighter blue for transcripts with higher CV in WT. 22q11 orthologues all have higher CV in LgDel and are shown in red; the subset of 72/134 significantly differentially expressed genes with higher CV in LgDel is shown in green. (E) Graphic representation of increased stochastic variation in LgDel versus WT (asterisks indicating significant differences, chi-square) among most, but not all of a subset of GO categories. These categories include gene sets associated with fundamental cellular (e.g. glycolysis, mitochondria) and neuronal differentiation mechanisms (e.g. proneural bHLH genes).

Similar articles

Cited by

References

    1. Sullivan P.F. and Geschwind D.H. (2019) Defining the genetic, genomic, cellular, and diagnostic architectures of psychiatric disorders. Cell, 177, 162–183. - PMC - PubMed
    1. Kohl J., Autry A.E. and Dulac C. (2017) The neurobiology of parenting: a neural circuit perspective. Bioessays, 39, 1–11. - PMC - PubMed
    1. Cooper-Brown L., Copeland S., Dailey S., Downey D., Petersen M.C., Stimson C. and Van Dyke D.C. (2008) Feeding and swallowing dysfunction in genetic syndromes. Dev. Disabil. Res. Rev., 14, 147–157. - PubMed
    1. Kakodkar K. and Schroeder J.W. Jr. (2013) Pediatric dysphagia. Pediatr. Clin. North Am., 60, 969–977. - PubMed
    1. LaMantia A.S., Moody S.A., Maynard T.M., Karpinski B.A., Zohn I.E., Mendelowitz D., Lee N.H. and Popratiloff A. (2016) Hard to swallow: developmental biological insights into pediatric dysphagia. Dev. Biol., 409, 329–342. - PMC - PubMed

Publication types