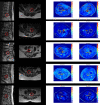
T2 mapping of the distal sciatic nerve in healthy subjects and patients suffering from lumbar disc herniation with nerve compression
- PMID: 32048099
- PMCID: PMC7502059
- DOI: 10.1007/s10334-020-00832-w
T2 mapping of the distal sciatic nerve in healthy subjects and patients suffering from lumbar disc herniation with nerve compression
Abstract
Objective: To measure T2 values for magnetic resonance neurography (MRN) of the healthy distal sciatic nerve and compare those to T2 changes in patients with nerve compression.
Materials and methods: Twenty-one healthy subjects and five patients with sciatica due to disc herniation underwent MRN using a T2-prepared turbo spin echo (TSE) sequence of the distal sciatic nerve bilaterally. Six and one of those healthy subjects further underwent a commonly used multi-echo spin-echo (MESE) sequence and magnetic resonance spectroscopy (MRS), respectively.
Results: T2 values derived from the T2-prepared TSE sequence were 44.6 ± 3.0 ms (left) and 44.5 ± 2.6 ms (right) in healthy subjects and showed good inter-reader reliability. In patients, T2 values of 61.5 ± 6.2 ms (affected side) versus 43.3 ± 2.4 ms (unaffected side) were obtained. T2 values of MRS were in good agreement with measurements from the T2-prepared TSE, but not with those of the MESE sequence.
Discussion: A T2-prepared TSE sequence enables precise determination of T2 values of the distal sciatic nerve in agreement with MRS. A MESE sequence tends to overestimate nerve T2 compared to T2 from MRS due to the influence of residual fat on T2 quantification. Our approach may enable to quantitatively assess direct nerve affection related to nerve compression.
Keywords: Magnetic resonance spectroscopy; Peripheral nervous system diseases; Sciatica; Spine.
Conflict of interest statement
Jan S. Kirschke received speaker honoraria from Philips Healthcare. Dimitrios C. Karampinos received grant support from Philips Healthcare. Nico Sollmann, Dominik Weidlich, Elisabeth Klupp, Barbara Cervantes, Carl Ganter, Claus Zimmer, Ernst J. Rummeny, and Thomas Baum declare that they have no conflict of interest.
Figures


Similar articles
-
Reliability and reproducibility of sciatic nerve magnetization transfer imaging and T2 relaxometry.Eur Radiol. 2021 Dec;31(12):9120-9130. doi: 10.1007/s00330-021-08072-9. Epub 2021 Jun 9. Eur Radiol. 2021. PMID: 34104997 Free PMC article.
-
Water T2 Mapping in Fatty Infiltrated Thigh Muscles of Patients With Neuromuscular Diseases Using a T2 -Prepared 3D Turbo Spin Echo With SPAIR.J Magn Reson Imaging. 2020 Jun;51(6):1727-1736. doi: 10.1002/jmri.27032. Epub 2019 Dec 24. J Magn Reson Imaging. 2020. PMID: 31875343
-
Synthetic T2-weighted images of the lumbar spine derived from an accelerated T2 mapping sequence: Comparison to conventional T2w turbo spin echo.Magn Reson Imaging. 2021 Dec;84:92-100. doi: 10.1016/j.mri.2021.09.011. Epub 2021 Sep 23. Magn Reson Imaging. 2021. PMID: 34562566
-
MRI of the lumbar spine: comparison of 3D isotropic turbo spin-echo SPACE sequence versus conventional 2D sequences at 3.0 T.Acta Radiol. 2015 Feb;56(2):174-81. doi: 10.1177/0284185114524196. Epub 2014 Feb 19. Acta Radiol. 2015. PMID: 24553584
-
B1-insensitive T2 mapping of healthy thigh muscles using a T2-prepared 3D TSE sequence.PLoS One. 2017 Feb 14;12(2):e0171337. doi: 10.1371/journal.pone.0171337. eCollection 2017. PLoS One. 2017. PMID: 28196133 Free PMC article.
Cited by
-
Combined Use of Magnetization Transfer Ratio and T2-Mapping to Evaluate Extraocular Muscle Pathophysiology in Myasthenia Gravis with Ophthalmoparesis.Int J Med Sci. 2024 Oct 28;21(14):2799-2806. doi: 10.7150/ijms.104542. eCollection 2024. Int J Med Sci. 2024. PMID: 39512682 Free PMC article.
-
Quantitative double echo steady state T2 mapping of upper extremity peripheral nerves and muscles.Front Neurol. 2024 Feb 15;15:1359033. doi: 10.3389/fneur.2024.1359033. eCollection 2024. Front Neurol. 2024. PMID: 38426170 Free PMC article.
-
Quantitative MRI of dorsal root ganglion alterations in neurofibromatosis type 1 patients with or without pain.Eur Radiol Exp. 2025 May 28;9(1):57. doi: 10.1186/s41747-025-00594-x. Eur Radiol Exp. 2025. PMID: 40437318 Free PMC article.
-
Reliability and reproducibility of sciatic nerve magnetization transfer imaging and T2 relaxometry.Eur Radiol. 2021 Dec;31(12):9120-9130. doi: 10.1007/s00330-021-08072-9. Epub 2021 Jun 9. Eur Radiol. 2021. PMID: 34104997 Free PMC article.
-
Variable echo time imaging for detecting the short T2* components of the sciatic nerve: a validation study.MAGMA. 2021 Jun;34(3):411-419. doi: 10.1007/s10334-020-00886-w. Epub 2020 Sep 22. MAGMA. 2021. PMID: 32964300 Free PMC article.
References
MeSH terms
Grants and funding
LinkOut - more resources
Full Text Sources
Medical

