. 2020 Nov;72(5):1717-1734.
doi: 10.1002/hep.31176. Epub 2020 Sep 28.

Deletion of Protein Kinase D3 Promotes Liver Fibrosis in Mice

Affiliations

Deletion of Protein Kinase D3 Promotes Liver Fibrosis in Mice

Shuya Zhang et al. Hepatology. 2020 Nov.

Abstract

Background and aims: Liver fibrosis (LF) is a central pathological process that occurs in most types of chronic liver diseases. Advanced LF causes cirrhosis, hepatocellular carcinoma, and liver failure. However, the exact molecular mechanisms underlying the initiation and progression of LF remain largely unknown.

Approach and results: This study was designed to investigate the role of protein kinase D3 (PKD3; gene name Prkd3) in the regulation of liver homeostasis. We generated global Prkd3 knockout (Prkd3-/- ) mice and myeloid-cell-specific Prkd3 knockout (Prkd3∆LysM ) mice, and we found that both Prkd3-/- mice and Prkd3∆LysM mice displayed spontaneous LF. PKD3 deficiency also aggravated CCl4 -induced LF. PKD3 is highly expressed in hepatic macrophages (HMs), and PKD3 deficiency skewed macrophage polarization toward a profibrotic phenotype. Activated profibrotic macrophages produced transforming growth factor beta that, in turn, activates hepatic stellate cells to become matrix-producing myofibroblasts. Moreover, PKD3 deficiency decreased the phosphatase activity of SH2-containing protein tyrosine phosphatase-1 (a bona-fide PKD3 substrate), resulting in sustained signal transducer and activator of transcription 6 activation in macrophages. In addition, we observed that PKD3 expression in HMs was down-regulated in cirrhotic human liver tissues.

Conclusions: PKD3 deletion in mice drives LF through the profibrotic macrophage activation.


Conflict of interest statement

Potential conflict of interest: Nothing to report.

Figures
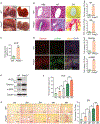
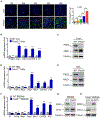
FIG. 1.
FIG. 1.
Prkd3 deficiency in mice induced spontaneous LF. (A) Representative images of livers from WT and Prkd3−/− mice at 4 months (n = 7/group). The left panel shows livers in vivo, and the right panel shows livers separated from the mouse body. Scale bars, 0.5 cm. (B) Histological analysis of spontaneous LF in Prkd3−/− compared to WT mice at 4 months of age. Levels of fibrotic areas in livers were evaluated with H&E staining, Masson’s trichrome staining, and SR staining. Scale bars, 20 μm. Graphs show quantification (fold change) of Masson trichrome–positive areas (upper panel) and SR-positive areas (lower panel) that were measured using NIH ImageJ software (NIH, Bethesda, MD) and are expressed as relative values to those in liver from WT mice. (C) Collagen accumulation was assessed by measurement of hepatic HYP content in liver from WT and Prkd3−/− mice. (D) Immunofluorescence staining and quantification of HSCs marker desmin and myofibroblast marker α-SMA expression in liver sections from WT and Prkd3−/− mice. Scale bars, 50 μm. (E) Western blotting analysis of PKD3, α-SMA, and desmin expressions in liver tissues from WT and Prkd3−/− mice (n = 3). (F) Age-dependent spontaneous LF in WT and Prkd3−/− mice were evaluated with collagen accumulation manifested by hepatic HYP content. (G) Age-dependent spontaneous LF in WT and Prkd3−/− mice were evaluated with SR staining and quantification. Scale bars, 100 μm. Results are displayed as the mean ± SEM. *P < 0.05; **P < 0.01, by two-tailed Student t test (B–D) and by one-way ANOVA (F,G), n = 7. Abbreviations: DAPI, 4′,6-diamidino-2-phenylindole; M, month(s); MT, Masson’s trichrome.
FIG. 2.
FIG. 2.
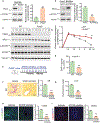
Macrophage PKD3 controlled HSC activation through modulating TGF-β production in HMs. (A) Dual-immunostaining analyzed PKD3 colocalization with macrophage marker F4/80 in liver sections from WT or Prkd3−/− mice. Scale bars, 20 μm. (B) qPCR analysis of relative expression of Prkd3 in mouse primary HPs, HMs, LSECs, and HSCs. (C) qPCR analysis of relative expression of Tgfb1 (left panel) and Tgfb2 (right panel) in primary HPs, HMs, and LSECs isolated from WT and Prkd3−/− mice. (D) Phase-contrast and immunofluorescence images of WT mouse HSCs treated with WT mouse BMDM-derived supernatants (CM) or Prkd3−/− mouse BMDM-derived supernatants, or TGF-β (20 ng/mL, a positive control) for 48 hours. Scale bars, 20 μm. (E) qPCR analysis of relative expression of Col1a, Col3a, and Acta2 in HSCs treated with WT BMDM supernatants or Prkd3−/− BMDM supernatants or TGF-β. (F) Phase-contrast and immunofluorescence images of mouse HSCs treated with Prkd3−/− mouse BMDM supernatants in the presence of TGF-β neutralization antibody or IgG control. DAPI for nuclear DNA staining. Scale bars, 20 μm. (G) qPCR analysis of relative expression of Col1a, Col3a, and Acta2 in HSCs treated with Prkd3−/− BMDM supernatants in the presence of TGF-β neutralization antibody or IgG control. Results are displayed as the mean ± SEM. *P < 0.05; **P < 0.01, by two-tailed Student t test (C,G) and by one-way ANOVA (B,E), n = 3. Abbreviations: Ab, antibody; DAPI, 4′,6-diamidino-2-phenylindole; IgG, immunoglobulin G.
FIG. 3.
FIG. 3.
PKD3 regulated macrophage polarization and activation in vivo and in vitro. (A) Immunofluorescent staining of F4/80 (green) and DAPI staining (blue) in liver tissues from WT and Prkd3−/− mice at different ages. Scale bars, 20 μm. The graph shows the quantification (percentage) of F4/80-positive area normalized to that in WT mouse liver (n = 7). (B,C) qPCR (B) and western blotting (C) analysis of gene expression of alternative activation macrophage markers in liver tissues from WT and Prkd3−/− mice at the age of 4 months. (D) qPCR analysis of gene expression of classical and alternative macrophage activation markers in HMs isolated from WT and Prkd3−/− mice. (E) Western blotting analysis of ARG1 expression in HMs isolated from WT and Prkd3−/− mice. (F) qPCR analysis of Arg1, Mrc1, and Cd163 expression in BMDMs isolated from WT and Prkd3−/− mice. (G) Western blotting analysis of ARG1 expression in BMDMs from WT and Prkd3−/− mice. (H) Western blotting analysis of ARG1 expression in Prkd3−/− BMDMs infected with adenovirus control (Ad–C) or adenovirus PKD3 (Ad-PKD3). Results are displayed as the mean ± SEM. *P < 0.05; **P < 0.01, by one-way ANOVA (A) and two-tailed Student t test (B,D,F; n = 3). Abbreviations: DAPI, 4′,6-diamidino-2-phenylindole; M, month(s).
FIG. 4.
FIG. 4.
PKD3 suppressed alternative macrophage activation through enhancing SHP1 phosphatase activity. (A) Representative western blotting and quantification of p-STAT6/STAT6 ratio in WT and Prkd3−/− BMDMs after IL-4 stimulation for 24 hours. p-STAT6, phosphorylated STAT6 at Tyr641. (B) Representative western blotting and quantification of p-STAT6/STAT6 ratio in Prkd3−/− BMDMs infected with adenovirus PKD3 (Ad-PKD3) or control adenovirus (Ad-C) and then treated with IL-4 for 24 hours. (C) Time course of IL-4-stimulated (20 ng/mL) p-STAT6 in BMDMs from WT mice and Prkd3−/− mice. Levels of ARG1, p-STAT6, and STAT6 were analyzed by western blotting. The graph shows quantification of the p-STAT6/STAT6 ratio. (D) SHP-1 activity was analyzed by a tyrosine phosphatase assay kit after coimmunoprecipitation with SHP-1 antibody in Prkd3−/− BMDMs and WT BMDMs. (E-I) Therapeutic inhibition of STAT6 in mice reversed Prkd3-deficiency–induced LF. (E) Schematic experimental design of the STAT6 inhibitor treatment: 30-day-old Prkd3−/− mice were treated with the STAT6 inhibitor, AS1517499 (20 mg/kg intraperitoneal) or vehicle once every 2 days for 1 month. Liver tissues were collected and analyzed. Collagen accumulation was assessed by SR staining (F) and HYP content (G). Scale bars, 50 μm. Immunofluorescence staining and quantification of α-SMA expression (H) and CD206 expression (I) in liver sections from the STAT6-inhibitor–treated group and vehicle-treated group. Scale bars, 50 μm (H) or 20 μm (I). Data represent the mean ± SEM from three independent experiments. *P < 0.05; **P < 0.01 versus control. Abbreviations: DAPI, 4′,6-diamidino-2-phenylindole.
FIG. 5.
FIG. 5.
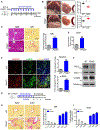
Prkd3 deficiency in mice promoted progression of CCl4-induced LF. (A) Schematic experimental design of CCl4-induced LF model: WT and Prkd3−/− mice received consecutive doses of CCl4 (0.5 mL/kg) for 4 weeks by intraperitoneal injection. After 30 days, liver tissues were collected and analyzed. (B) Representative images of gross liver and spleen from WT and Prkd3−/− mice in a CCl4-induced LF model. Scale bars, 0.5 cm. Graphs show the liver/body weight ratio (upper panel) and spleen/body weight ratio (lower panel). Data are presented as mean ± SEM, *P < 0.05; *P < 0.01 versus WT; n = 7. (C) H&E and SR staining in liver sections from CCl4-treated WT and Prkd3−/− mice. Scale bars, 50 μm. The graph shows the quantification of SR-positive areas. (D) Collagen accumulation in livers from CCl4-treated WT and Prkd3−/− mice was assessed by measurement of hepatic HYP content. (E) Immunofluorescence staining and quantification of α-SMA and desmin expression in liver sections from CCl4-treated WT and Prkd3−/− mice (n = 7). Scale bars, 50 μm. (F) Western blotting analysis of α-SMA and ARG1 expression in livers from CCl4-treated WT and Prkd3−/− mice (n = 3). (G-I) Prkd3 deficiency retarded LF reversal after CCl4 was discontinued. (G) Schematic experimental design: WT and Prkd3−/− mice received CCl4 for 6 weeks and then were left untreated for 2 or 4 weeks for analysis of LF. (H) Representative images and quantification of SR staining in liver sections from WT and Prkd3−/− mice after CCl4 withdrawal for two (P2W) or four (P4W) weeks (n = 5). Bar, 50 μm. (I) Total HYP content levels of liver tissues from mice receiving the above treatments (n = 4). *P < 0.05; **P < 0.01; ***P < 0.005 (unpaired Student t test). All data are expressed as means ± SEM. Abbreviations: DAPI, 4′,6-diamidino-2-phenylindole.
FIG. 6.
FIG. 6.
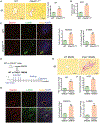
Myeloid-specific Prkd3 deficiency in mice induced spontaneous LF. (A) SR staining analyses of spontaneous LF in WT and Prkd3ΔLysM mice at the age of 4 months. Scale bars, 50 μm. (B) Collagen accumulation was assessed by hepatic HYP content. (C) Immunofluorescence staining and quantification of desmin and α-SMA expression in liver sections from WT and Prkd3ΔLysM mice. Scale bars, 50 μm. (D-G) Adoptive transfer of Prkd3−/− BMDMs into WT mice induced spontaneous fibrosis. (D) Schematic experimental design: Macrophages were isolated from WT or Prkd3−/− mice and injected to normal C57 mice through the tail vein, one time per week, and continued for 4 weeks. After an additional 8 weeks, liver tissues were collected and analyzed. (E,F) Collagen deposition was analyzed by SR staining (E) and hepatic HYP content (F). Scale bars, 50 μm. (G) Immunofluorescence staining and quantification of desmin and α-SMA in liver sections from Prkd3−/− BMDM-treated mice compared to WT BMDM-treated mice. Scale bars, 50 μm. Two-tailed Student t test analyzed data, mean ± SEM. **P < 0.01; ***P < 0.001 versus WT; n = 5. Abbreviation: DAPI, 4′,6-diamidino-2-phenylindole.
FIG. 7.
FIG. 7.
A decrease of macrophage PKD3 expression in cirrhotic human liver tissues. (A) H&E staining of normal and cirrhotic human liver tissues. Scale bars, 100 μm. (B) Immunohistochemical analysis and quantification of PKD3 expression in healthy and cirrhotic human liver tissues. Scale bars, 50 μm (n = 7). (C) Dual-immunostaining analysis of PKD3 expression and macrophage marker F4/80 expression in normal and cirrhotic human liver tissues. Scale bars, 20 μm (n = 7). Two-tailed Student t test analyzed data, mean ± SEM. **P < 0.01; ***P < 0.001 versus normal liver. Abbreviation: DAPI, 4′,6-diamidino-2-phenylindole.
FIG. 8.
FIG. 8.
Schematic overview of events that lead to LF attributed to Prkd3 deficiency. In Prkd3 WT mice, the level of IL-4-induced STAT6 phosphorylation in hepatic macrophage (Mϕ) is counterbalanced by the PKD3-dependent SHP-1-mediated dephosphorylation of STAT6. In Prkd3 knockout (KO) mice, IL-4 induces a sustained STAT6 phosphorylation that promotes robust expression of profibrotic genes, including TGF, that stimulates HSC activation to become matrix-producing myofibroblasts (MFs).

References

    1. Schuppan D, Ashfaq-Khan M, Yang AT, Kim YO. Liver fibrosis: direct antifibrotic agents and targeted therapies. Matrix Biol 2018;68–69:435–451. - PubMed
    1. Fabrellas N, Carol M, Palacio E, Aban M, Lanzillotti T, Nicolao G, et al.; LiverHope consortium investigators. Nursing care of patients with cirrhosis. Hepatology. 2020. Jan 16. 10.1002/hep.31117. [Epub ahead of print] - DOI - PMC - PubMed
    1. Schuppan D, Surabattula R, Wang XY. Determinants of fibrosis progression and regression in NASH. J Hepatol 2018;68:238–250. - PubMed
    1. Karsdal MA, Hjuler ST, Luo Y, Rasmussen DGK, Nielsen MJ, Holm Nielsen S, et al. Assessment of liver fibrosis progression and regression by a serological collagen turnover profile. Am J Physiol Gastrointest Liver Physiol 2019;316:G25–G31. - PubMed
    1. Vollmar J, Kim YO, Marquardt JU, Becker D, Galle PR, Schuppan D, et al. Deletion of organic cation transporter Oct3 promotes hepatic fibrosis via upregulation of TGFβ. Am J Physiol Gastrointest Liver Physiol 2019;317:G195–G202. - PubMed

Publication types

MeSH terms

Substances