

Predicting antimicrobial resistance in Pseudomonas aeruginosa with machine learning-enabled molecular diagnostics
- PMID: 32048461
- PMCID: PMC7059009
- DOI: 10.15252/emmm.201910264
Predicting antimicrobial resistance in Pseudomonas aeruginosa with machine learning-enabled molecular diagnostics
Abstract
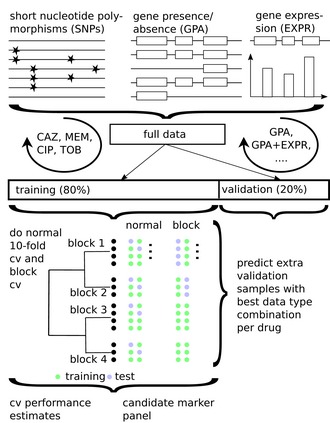
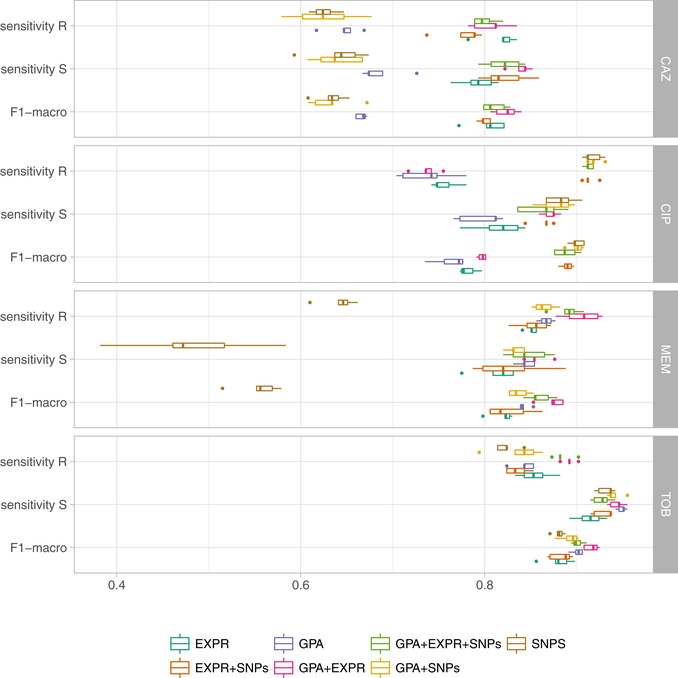
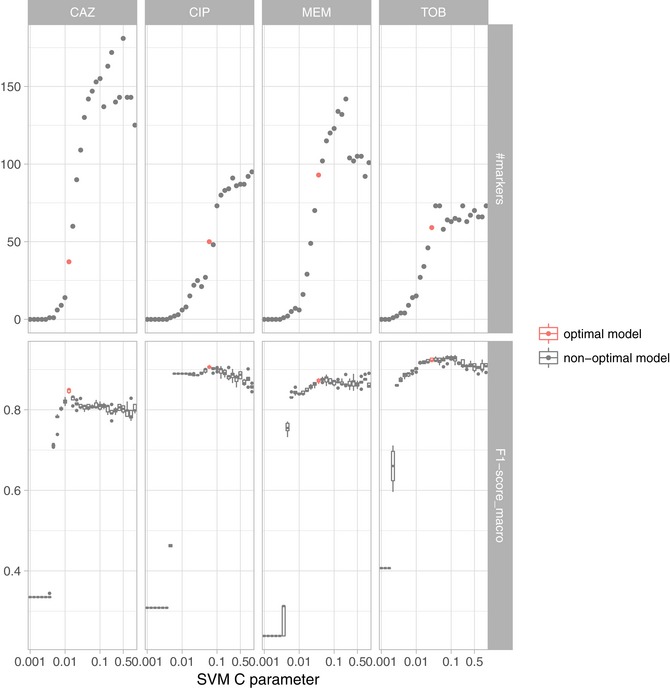
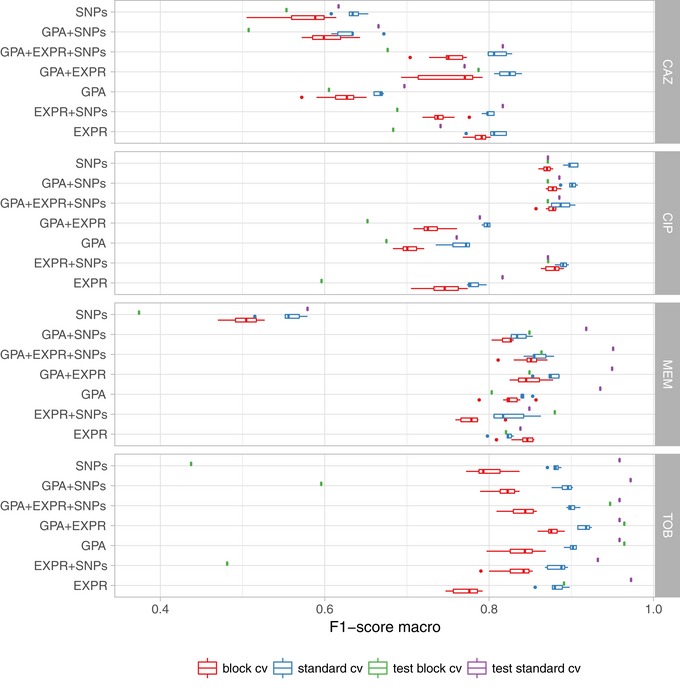
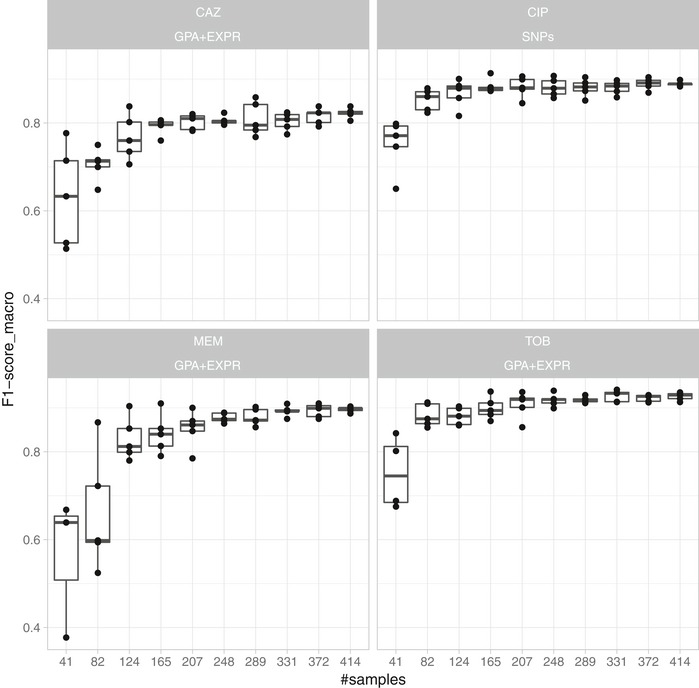
Limited therapy options due to antibiotic resistance underscore the need for optimization of current diagnostics. In some bacterial species, antimicrobial resistance can be unambiguously predicted based on their genome sequence. In this study, we sequenced the genomes and transcriptomes of 414 drug-resistant clinical Pseudomonas aeruginosa isolates. By training machine learning classifiers on information about the presence or absence of genes, their sequence variation, and expression profiles, we generated predictive models and identified biomarkers of resistance to four commonly administered antimicrobial drugs. Using these data types alone or in combination resulted in high (0.8-0.9) or very high (> 0.9) sensitivity and predictive values. For all drugs except for ciprofloxacin, gene expression information improved diagnostic performance. Our results pave the way for the development of a molecular resistance profiling tool that reliably predicts antimicrobial susceptibility based on genomic and transcriptomic markers. The implementation of a molecular susceptibility test system in routine microbiology diagnostics holds promise to provide earlier and more detailed information on antibiotic resistance profiles of bacterial pathogens and thus could change how physicians treat bacterial infections.
Keywords: antibiotic resistance; biomarkers; clinical isolates; machine learning; molecular diagnostics.
© 2020 The Authors. Published under the terms of the CC BY 4.0 license.
Conflict of interest statement
The authors declare that they have no conflict of interest.
Figures
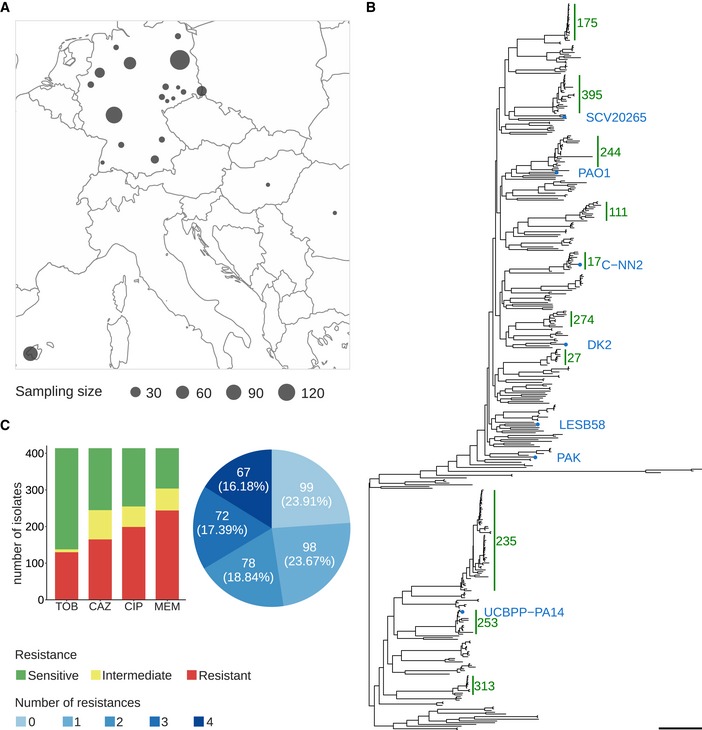
- A
Geographic sampling site distribution, where circle size is proportional to the number of isolates from a particular location.
- B
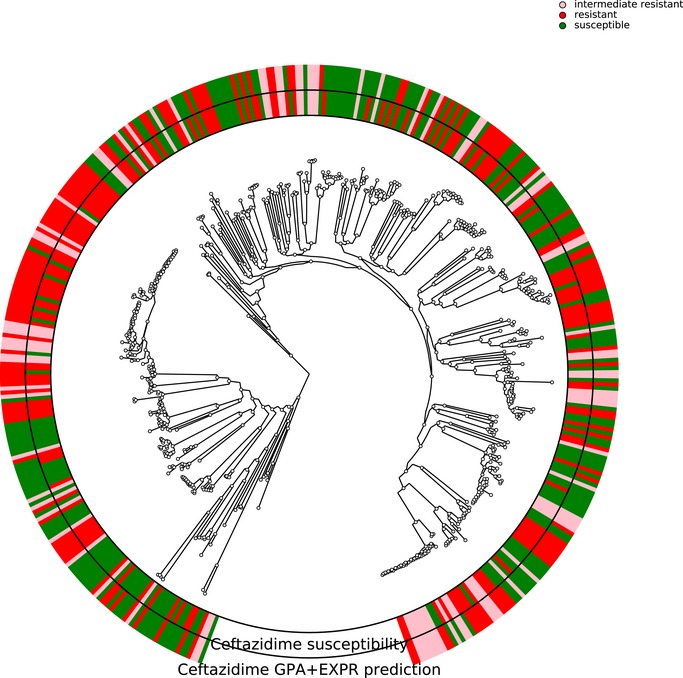
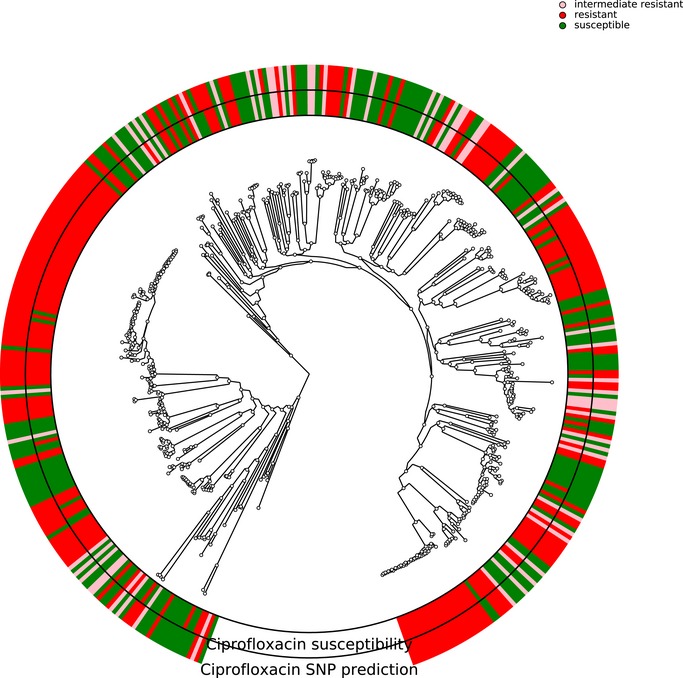
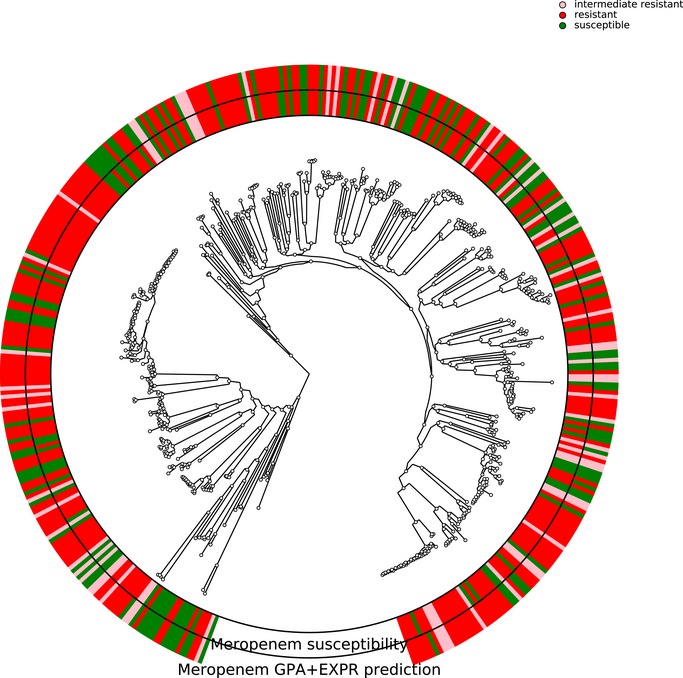
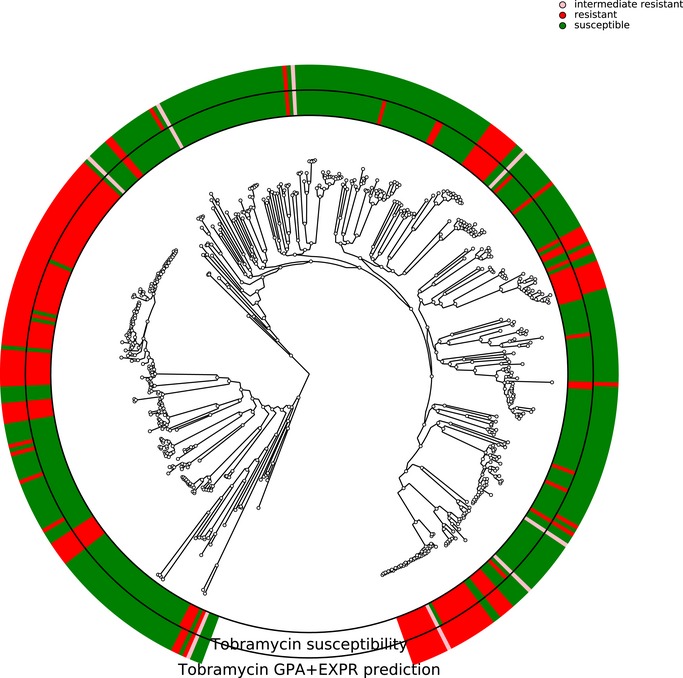
Phylogenetic tree of the clinical isolates and seven reference strains (blue dots). A PA7‐like outgroup clade including two clinical isolates is not shown. Abundant high‐risk clones are indicated by green bars. Scale bar: 0.04.
- C
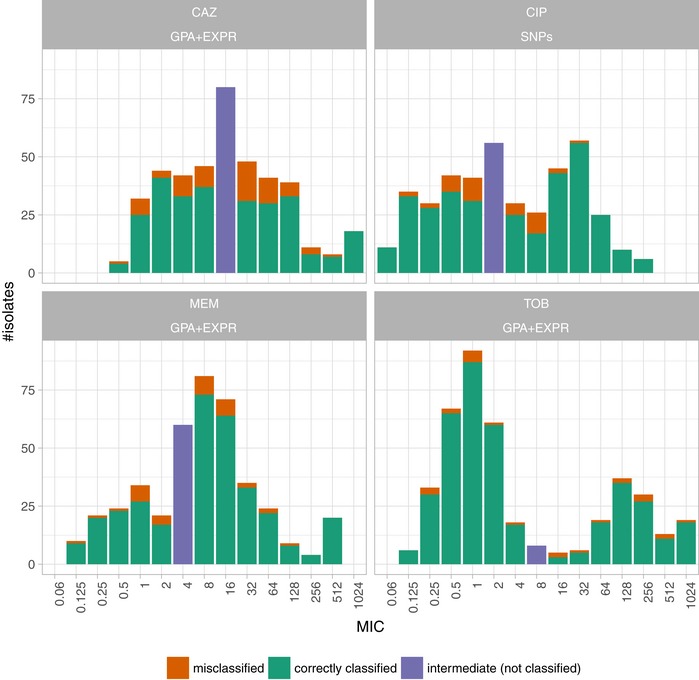
Antimicrobial susceptibility profiles against the four commonly administered antibiotics tobramycin (TOB), ceftazidime (CAZ), ciprofloxacin (CIP), and meropenem (MEM) determined by agar dilution according to Clinical & Laboratory Standards Institute Guidelines (CLSI, 2018).
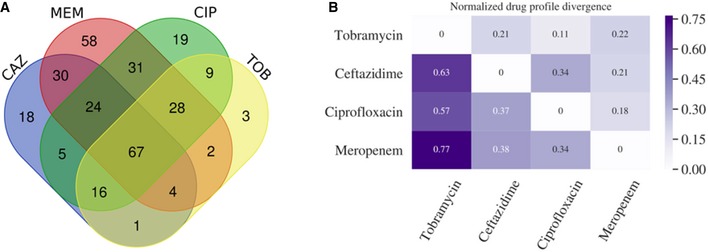
- A
Venn diagram shows the overlap of resistances among the collected clinical isolates.
- B
To further investigate the co‐resistance among the drugs, we also calculated the Kullback–Leibler divergence (KL divergence) between resistance patterns. We use the KL divergence as a non‐symmetric measurement of the differences between resistance patterns of different drugs. We use a non‐symmetric measure to be able to distinguish among the case of given a resistance to drug A, what does this imply for resistance against drug B (drug A, drug B) and the other way around (drug B, drug A). We normalized the KL values by dividing all values by the maximum in the table. In this analysis, the divergence is a measure to indicate whether information on a particular drug resistance could not be used to predict the simultaneous appearance of a second resistance. Thus, the higher the divergence value is, the less the information is available to predict a particular resistance pattern. The results imply, i.e., that TOB resistance comes with a higher probability of simultaneous MEM resistance, however, not the other way around.
Comment in
-
Lean, mean, learning machines.Nat Rev Microbiol. 2020 May;18(5):266. doi: 10.1038/s41579-020-0357-4. Nat Rev Microbiol. 2020. PMID: 32203299 No abstract available.
References
-
- Alanis AJ (2005) Resistance to antibiotics: are we in the post‐antibiotic era? Arch Med Res 36: 697–705 - PubMed
-
- Andrews S (2010) FastQC: a quality control tool for high throughput sequence data [Online]. Available at: http://www.bioinformatics.babraham.ac.uk/projects/fastqc/
Publication types
MeSH terms
Substances
Associated data
- Actions
Grants and funding
- 724290/EC FP7 FP7 Ideas: European Research Council (FP7 Ideas)/International
- 01 KI 9907/German Federal Ministry of Education and Research/International
- PI18/00076/Spanish Network for Research in Infectious Diseases/International
- REIPI RD16/0016/Spanish Network for Research in Infectious Diseases/International
- Instituto de Salud Carlos III/International
LinkOut - more resources
Full Text Sources
Other Literature Sources
Medical
Molecular Biology Databases
