. 2020 Feb 12:9:e52504.
doi: 10.7554/eLife.52504.

Derivation of trophoblast stem cells from naïve human pluripotent stem cells

Affiliations

Derivation of trophoblast stem cells from naïve human pluripotent stem cells

Chen Dong et al. Elife. .

Abstract

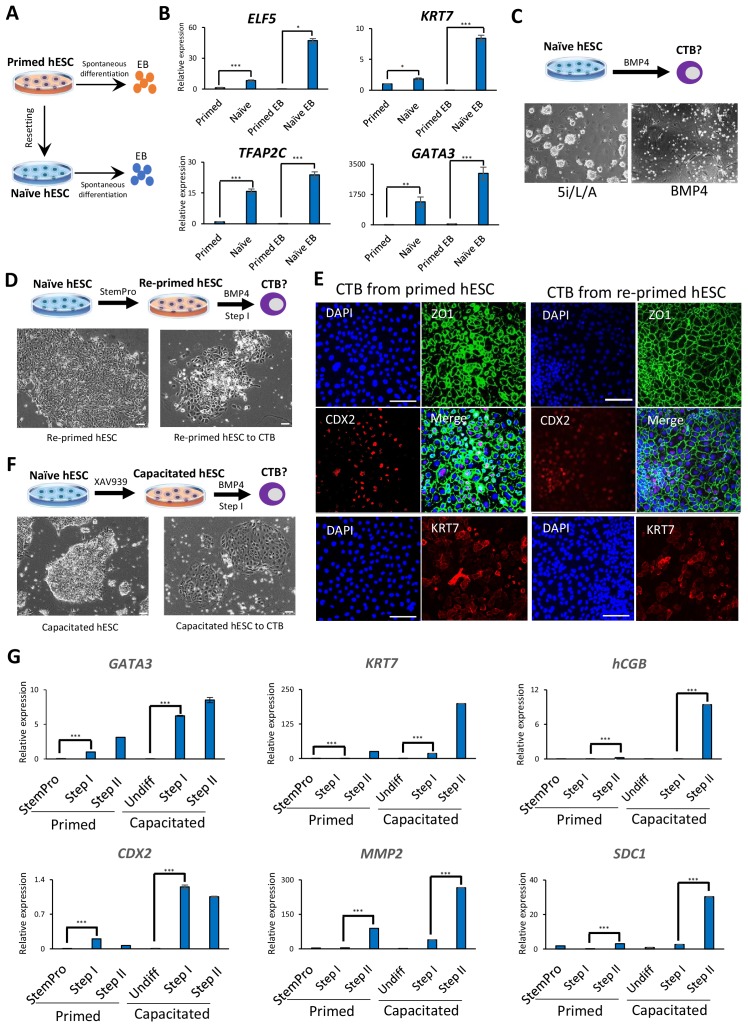
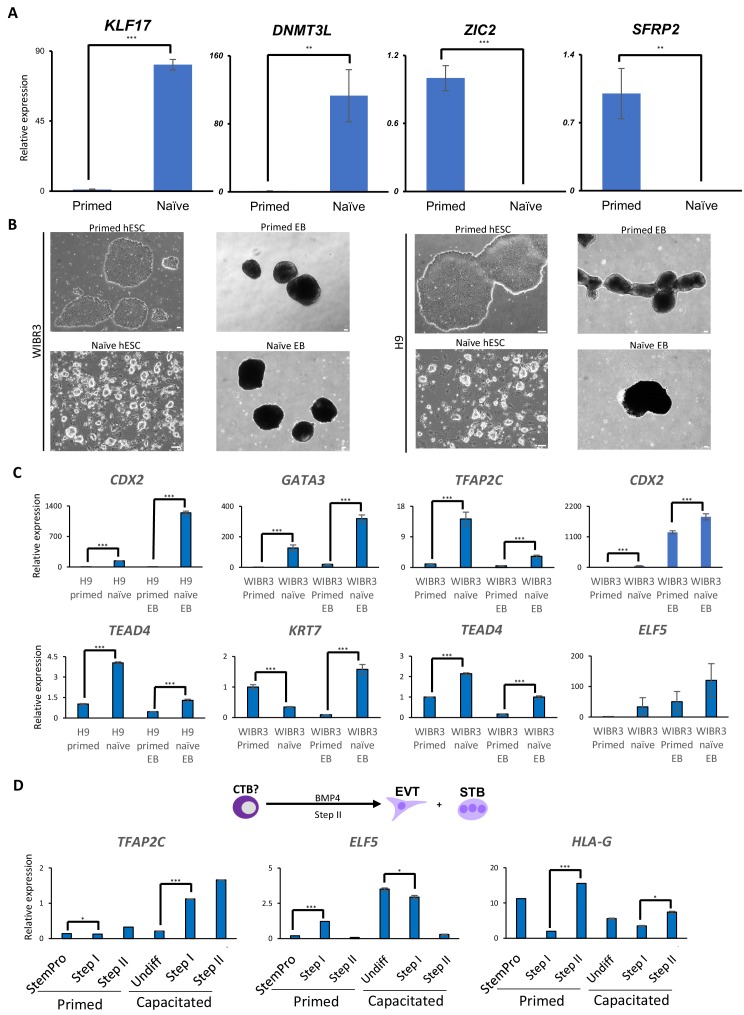
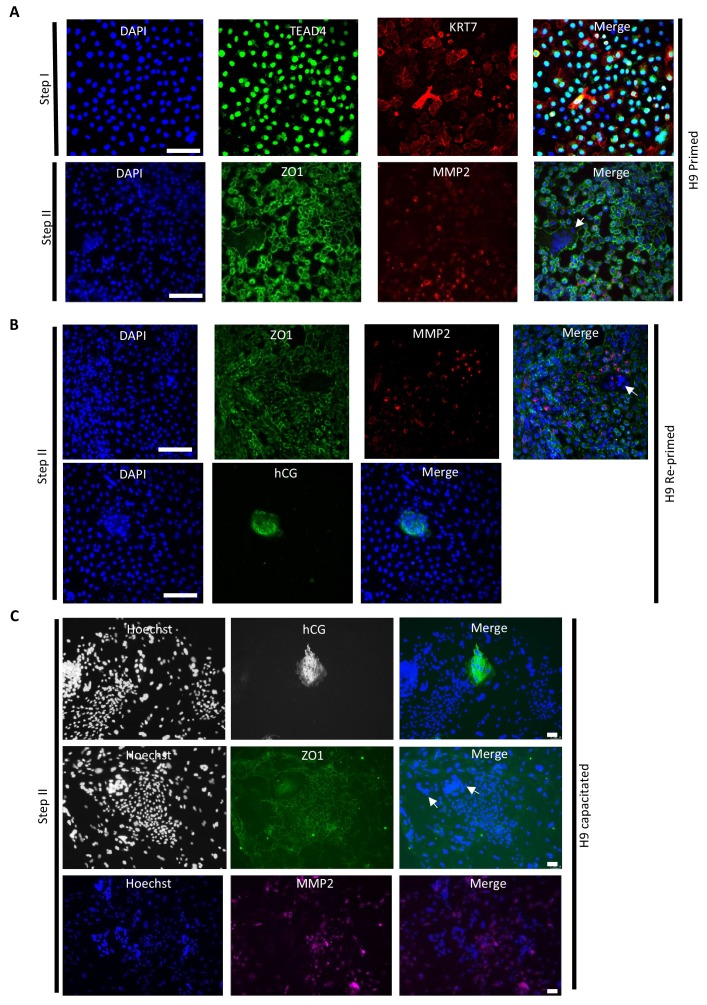
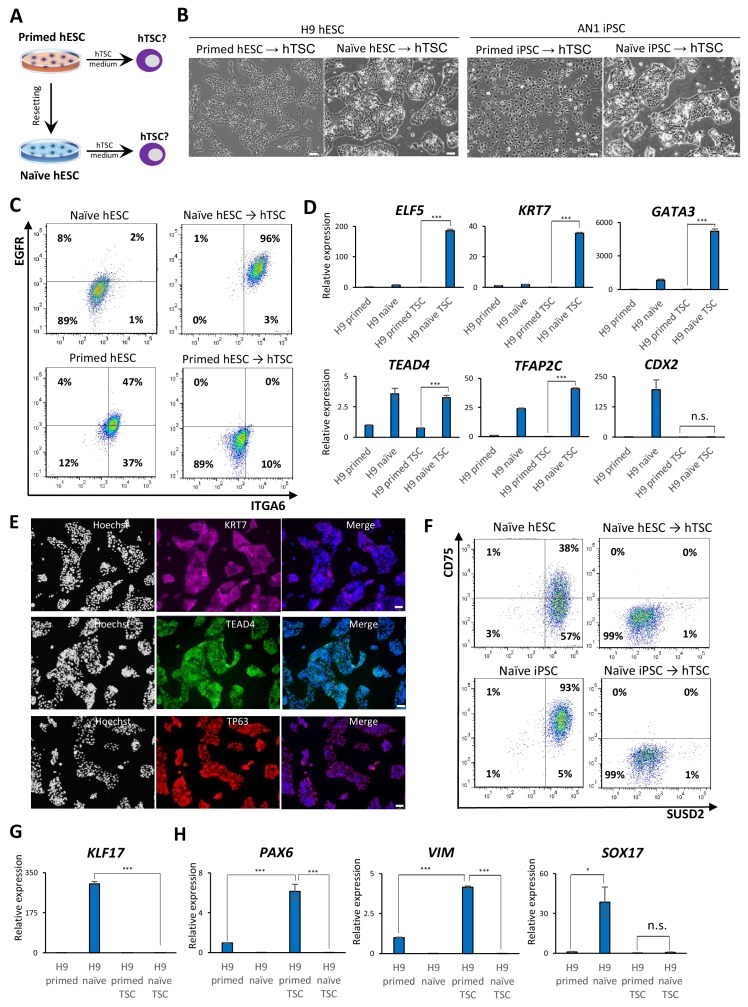
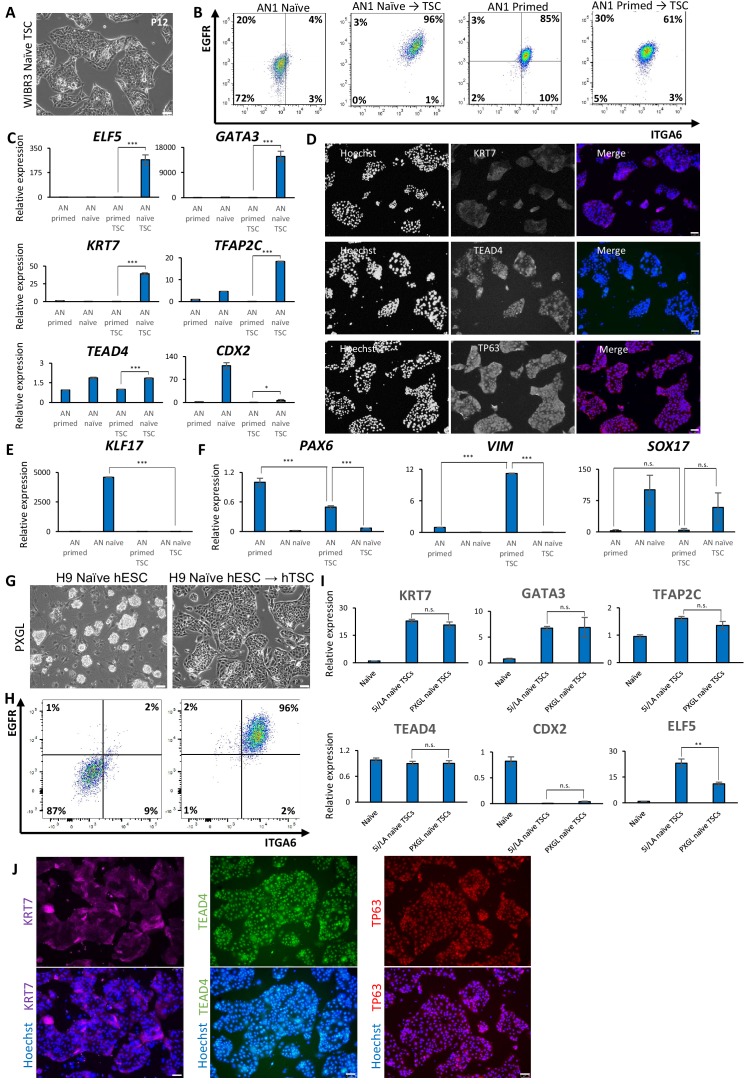
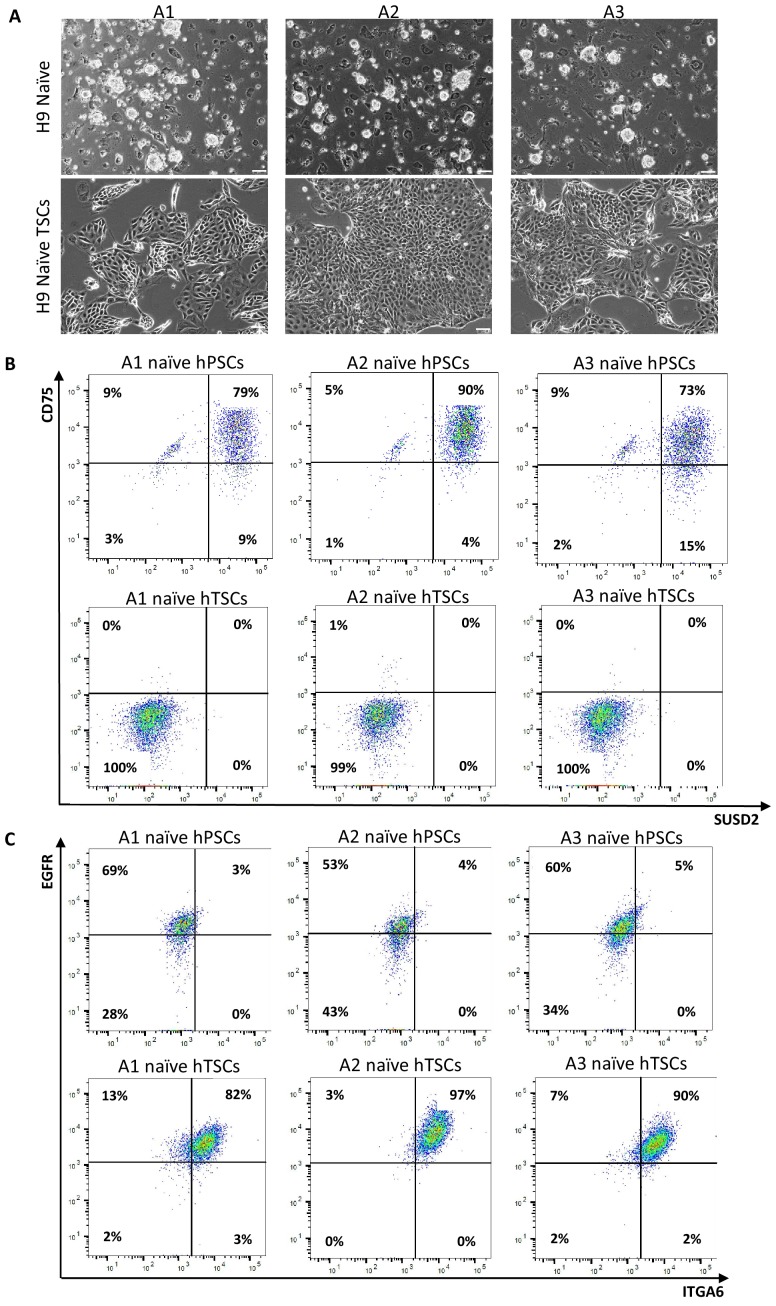
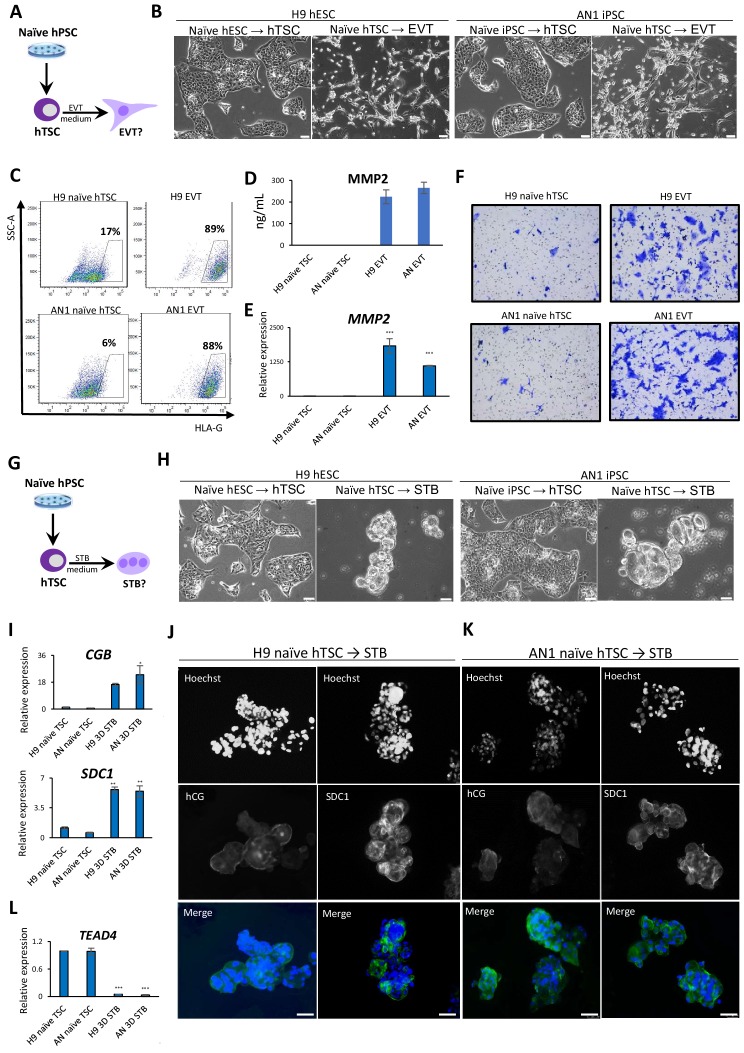
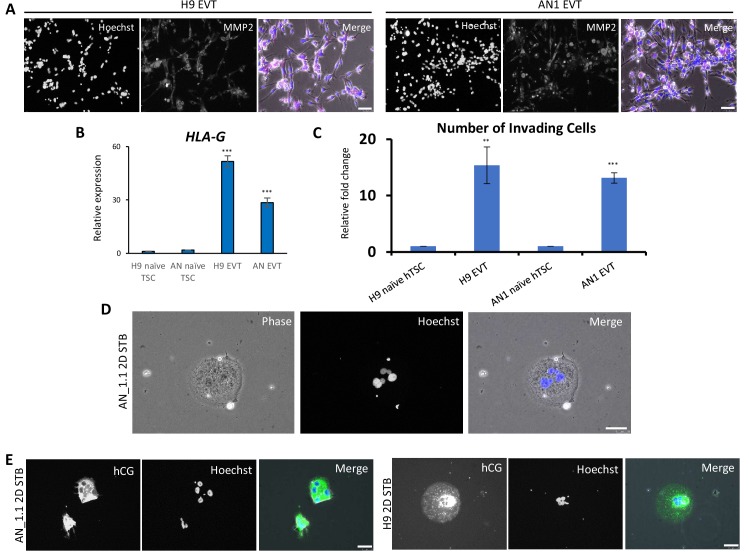
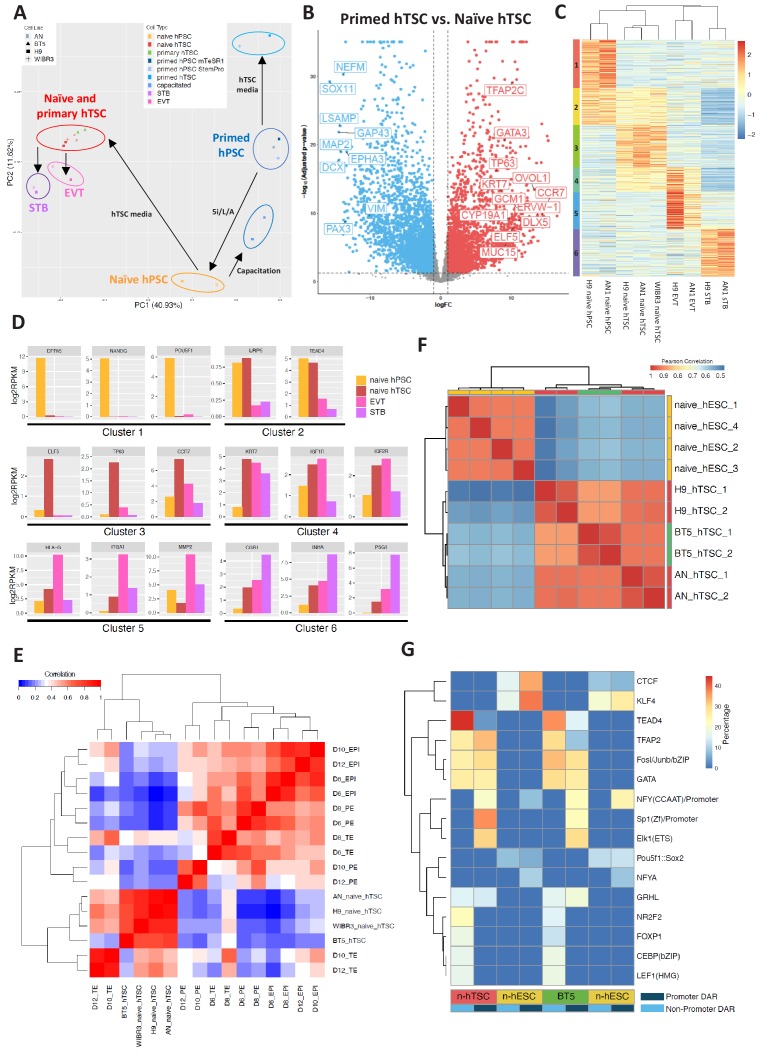
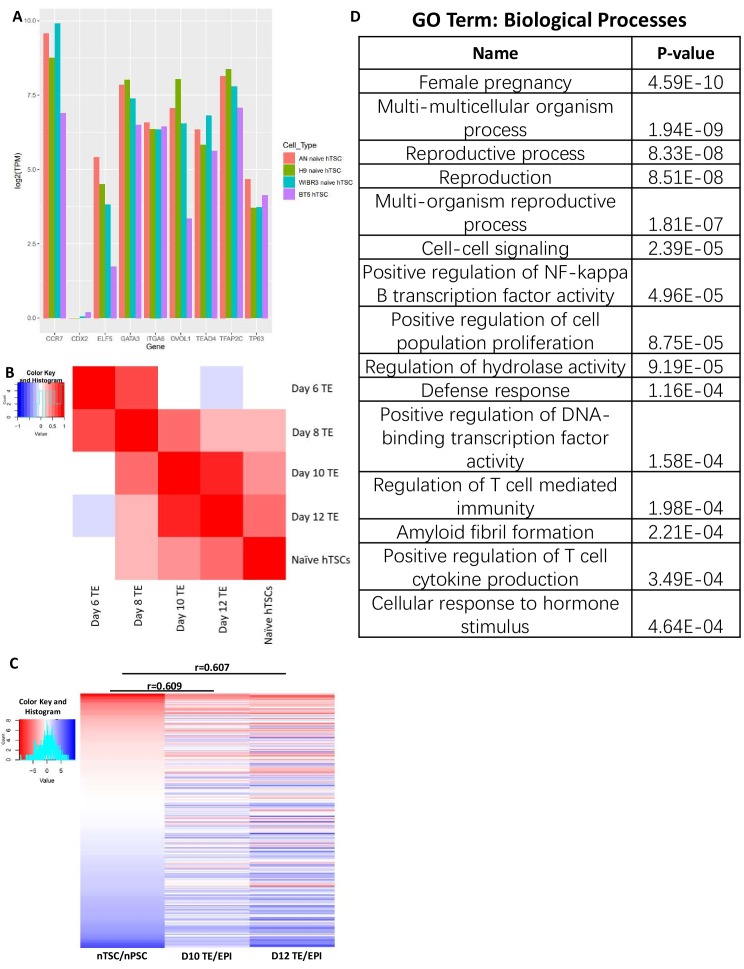
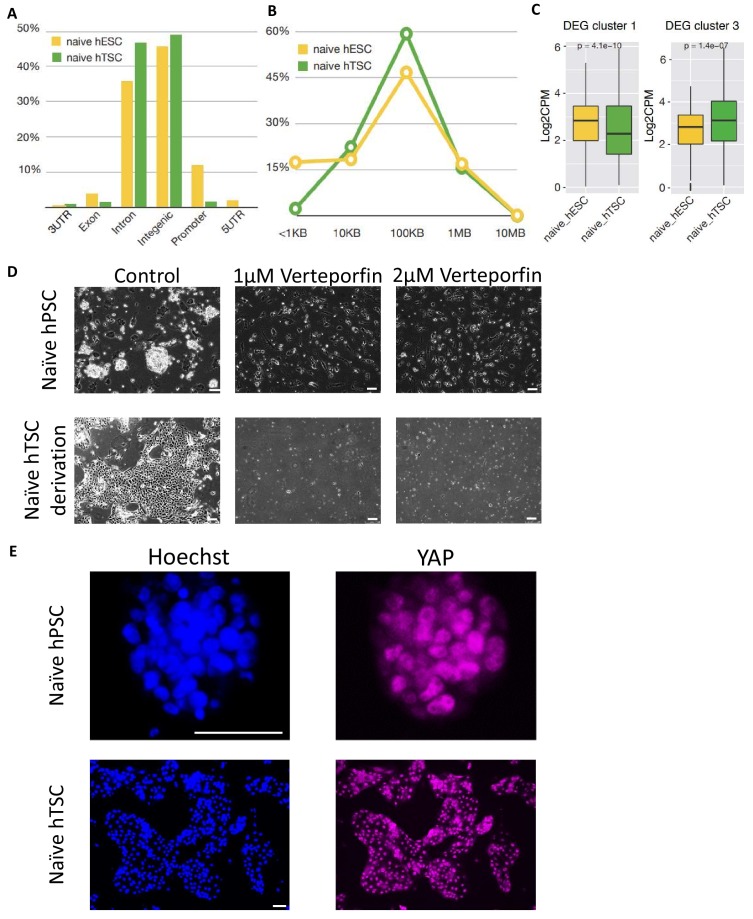
Naïve human pluripotent stem cells (hPSCs) provide a unique experimental platform of cell fate decisions during pre-implantation development, but their lineage potential remains incompletely characterized. As naïve hPSCs share transcriptional and epigenomic signatures with trophoblast cells, it has been proposed that the naïve state may have enhanced predisposition for differentiation along this extraembryonic lineage. Here we examined the trophoblast potential of isogenic naïve and primed hPSCs. We found that naïve hPSCs can directly give rise to human trophoblast stem cells (hTSCs) and undergo further differentiation into both extravillous and syncytiotrophoblast. In contrast, primed hPSCs do not support hTSC derivation, but give rise to non-self-renewing cytotrophoblasts in response to BMP4. Global transcriptome and chromatin accessibility analyses indicate that hTSCs derived from naïve hPSCs are similar to blastocyst-derived hTSCs and acquire features of post-implantation trophectoderm. The derivation of hTSCs from naïve hPSCs will enable elucidation of early mechanisms that govern normal human trophoblast development and associated pathologies.

Keywords: ATAC-seq; RNA-seq; human; naive pluripotency; primed pluripotency; regenerative medicine; stem cells; trophectoderm; trophoblast stem cells.

Plain language summary

The placenta is one of the most important human organs, but it is perhaps the least understood. The first decision the earliest human cells have to make, shortly after the egg is fertilized by a sperm, is whether to become part of the embryo or part of the placenta. This choice happens before a pregnancy even implants into the uterus. The cells that commit to becoming the embryo transform into ‘naïve pluripotent’ cells, capable of becoming any cell in the body. Those that commit to becoming the placenta transform into ‘trophectoderm’ cells, capable of becoming the two types of cell in the placenta. Placental cells either invade into the uterus to anchor the placenta or produce hormones to support the pregnancy. Once a pregnancy implants into the uterus, the naïve pluripotent cells in the embryo become ‘primed’. This prevents them from becoming cells of the placenta, and it poses a problem for placental research. In 2018, scientists in Japan reported conditions for growing trophectoderm cells in the laboratory, where they are known as “trophoblast stem cells”. These cells were capable of transforming into specialized placental cells, but needed first to be isolated from the human embryo or placenta itself. Dong et al. now show how to reprogram other pluripotent cells grown in the laboratory to produce trophoblast stem cells. The first step was to reset primed pluripotent cells to put them back into a naïve state. Then, Dong et al. exposed the cells to the same concoction of nutrients and chemicals used in the 2018 study. This fluid triggered a transformation in the naïve pluripotent cells; they started to look like trophoblast stem cells, and they switched on genes normally active in trophectoderm cells. To test whether these cells had the same properties as trophoblast stem cells, Dong et al. gave them chemical signals to see if they could mature into placental cells. The stem cells were able to transform into both types of placental cell, either invading through a three-dimensional gel that mimics the wall of the uterus or making pregnancy hormones. There is a real need for a renewable supply of placental cells in pregnancy research. Animal placentas are not the same as human ones, so it is not possible to learn everything about human pregnancy from animal models. A renewable supply of trophoblast stem cells could aid in studying how the placenta forms and why this process sometimes goes wrong. This could help researchers to better understand miscarriage, pre-eclampsia and other conditions that affect the growth of an unborn baby. In the future, it may even be possible to make custom trophoblast stem cells to study the specific fertility issues of an individual.


Conflict of interest statement

CD, MB, PG, BZ, PP, LF, SK, KP, EY, XX, RK, TW, TT No competing interests declared, LS Reviewing editor, eLife

Figures

Figure 1.
Figure 1.. Trophoblast potential of different hPSC states under spontaneous and BMP4-mediated differentiation conditions.
(A) The experimental scheme for assessing spontaneous trophoblast differentiation potential of primed and naïve hPSCs by using EB formation assay. (B) Quantitative gene expression analysis for trophoblast marker genes ELF5, KRT7, TFAP2C, and GATA3 in H9 primed and naïve hPSCs and EBs generated from the respective hPSCs. Error bars indicate ±1 SD of technical replicates. ‘*' indicates a p-value<0.05, ‘**' indicates a p-value<0.01, and ‘***' indicates a p-value<0.001. (C) The experimental scheme for assessing BMP4-mediated trophoblast differentiation potential of naive hESCs (top). Phase contrast image of H9 naïve hESCs and H9 naïve hESCs following the 6 day step I protocol for BMP4-mediated CTB differentiation (bottom). The scale bars indicate 75 μm. (D) The experimental scheme of re-priming naïve hESCs and assessing their BMP4-mediated trophoblast differentiation potential (top). Phase contrast images of H9 re-primed hESCs and H9 re-primed hESCs following the 6 day step I protocol for BMP4-mediated CTB differentiation (bottom). The scale bars indicate 75 μm. (E) Immunofluorescence staining for CDX2, ZO1, and KRT7 in CTBs generated from H9 primed and re-primed hESCs. The scale bars indicate 75 μm. (F) The experimental scheme of capacitating naïve hESCs and assessing their BMP4-mediated trophoblast differentiation potential (top). Phase contrast images of H9 capacitated hESCs and H9 capacitated hESCs following the 6 day step I protocol for BMP4-mediated CTB differentiation (bottom). The scale bars indicate 75 μm. (G) Quantitative gene expression analysis for trophoblast marker genes GATA3, CDX2, KRT7, MMP2, hCGB, and SDC1 in H9 primed and capacitated hESCs and trophoblasts differentiated from the respective hPSCs. Error bars indicate ± 1 SD of technical replicates. ‘***' indicates a p-value<0.001.
Figure 1—figure supplement 1.
Figure 1—figure supplement 1.. Trophoblast potential of different hPSC states under spontaneous and BMP4-mediated differentiation conditions.
(A) Quantitative gene expression analysis for naïve marker genes KLF17 and DNMT3L, and primed marker genes ZIC2 and SFRP2 in H9 primed and naïve hESCs. Error bars indicate ±1 SD of technical replicates. ‘**' indicates a p-value<0.01, and ‘***' indicates a p-value<0.001. (B) Phase contrast images of H9 and WIBR3 primed and naïve hESCs, and EBs generated from the respective hESCs. The scale bars indicate 75 μm. (C) Quantitative gene expression analysis for trophoblast marker genes ELF5, KRT7, TFAP2C, GATA3, CDX2, and TEAD4 in H9 and WIBR3 primed and naïve hESCs, and EBs generated from the respective hESCs. Error bars indicate ±1 SD of technical replicates. ‘***' indicates a p-value<0.001. (D) The experimental scheme of step II protocol for BMP4-mediated terminal EVT and STB differentiation from CTBs (top). Quantitative gene expression analysis for trophoblast marker genes TFAP2C, ELF5, and HLA-G in H9 primed and capacitated hPSCs and trophoblasts differentiated from the respective hESCs. Error bars indicate ± 1 SD of technical replicates. ‘*' indicates a p-value<0.05, and ‘***' indicates a p-value<0.001.
Figure 1—figure supplement 2.
Figure 1—figure supplement 2.. Immunofluorescence staining of trophoblast markers.
(A) Immunofluorescence staining for TEAD4 and KRT7 in CTBs, and ZO1 and MMP2 in terminally differentiated trophoblasts derived from H9 primed hESCs. The scale bars indicate 75 μm. The white arrow indicates multinucleation. (B) Immunofluorescence staining for ZO1, MMP2, and hCG in terminally differentiated trophoblasts derived from H9 re-primed hESCs. The scale bars indicate 75 μm. The white arrow indicates multinucleation. (C) Immunofluorescence staining for hCG, ZO1, and MMP2 in terminally differentiated trophoblasts derived from H9 capacitated hPSCs. The scale bars indicate 75 μm. The white arrow indicates multinucleation.
Figure 2.
Figure 2.. Examining the response of naïve and primed hPSCs to conditions for hTSC derivation.
(A) The experimental scheme for deriving hTSCs from primed and naïve hPSCs. (B) Phase contrast images of H9 and AN_1.1 hTSC-like cells derived from naïve hPSCs, as well as H9 and AN_1.1 primed hPSCs following culture in hTSC medium. All H9 cells were at passage 8, and all AN_1.1 cells were at passage 10. The scale bars indicate 75 μm. (C) Flow cytometry analysis for TSC markers ITGA6 and EGFR in H9 naïve hPSCs, H9 hTSC-like cells derived from naïve hPSCs, H9 primed hPSCs, and H9 primed hPSCs cultured in hTSC medium. (D) Quantitative gene expression analysis for trophoblast marker genes ELF5, KRT7, GATA3, TFAP2C, TEAD4, and CDX2 in H9 primed and naïve hPSCs, H9 hTSC-like cells derived from naïve hPSCs, and H9 primed hPSCs cultured in hTSC medium. Error bars indicate ±1 SD of technical replicates. ‘***' indicates a p-value<0.001. (E) Immunofluorescence staining for TSC markers KRT7, TEAD4, and TP63 in H9 hTSC-like cells derived from naïve hPSCs. The scale bars indicate 75 μm. (F) Flow cytometry analysis for naïve hPSC markers SUSD2 and CD75 in H9 and AN_1.1 naïve hPSCs and hTSC-like cells derived from naïve hPSCs. (G) Quantitative gene expression analysis for naïve hPSC marker KLF17 in H9 primed and naïve hPSCs, hTSC-like cells derived from naïve hPSCs, and primed hPSCs cultured in hTSC medium. Error bars indicate ±1 SD of technical replicates. ‘***' indicates a p-value<0.001. (H) Quantitative gene expression analysis for the embryonic germ layer markers PAX6, VIM, and SOX17 in H9 primed and naïve hPSCs, hTSC-like cells derived from naïve hPSCs, and primed hPSCs cultured in hTSC medium. Error bars indicate ± 1 SD of technical replicates. ‘*' indicates a p-value<0.05, ‘***' indicates a p-value<0.001, and ‘n.s.’ indicates a p-value>0.05.
Figure 2—figure supplement 1.
Figure 2—figure supplement 1.. Derivation of hTSCs from naïve hPSCs.
(A) Phase contrast images of WIBR3 hTSC-like cells derived from naïve hPSCs. The scale bars indicate 75 μm. (B) Flow cytometry analysis for TSC markers ITGA6 and EGFR in AN_1.1 naïve hPSCs, hTSC-like cells derived from naïve hPSCs, primed hPSCs, and primed hPSCs cultured in hTSC medium. (C) Quantitative gene expression analysis for trophoblast marker genes ELF5, KRT7, GATA3, TFAP2C, TEAD4, and CDX2 in AN_1.1 primed and naïve hPSCs, hTSC-like cells derived from naïve hPSCs, and primed hPSCs cultured in hTSC medium. Error bars indicate ±1 SD of technical replicates. ‘*' indicates a p-value<0.05, and ‘***' indicates a p-value<0.001. (D) Immunofluorescence staining for TSC markers KRT7, TEAD4, and TP63 in AN_1.1 hTSC-like cells derived from naïve hPSCs. The scale bars indicate 75 μm. (E) Quantitative gene expression analysis for naïve hPSC marker KLF17 in AN_1.1 primed and naïve hPSCs, hTSC-like cells derived from naïve hPSCs, and primed hPSCs cultured in hTSC medium. Error bars indicate ±1 SD of technical replicates. ‘***' indicates a p-value<0.001. (F) Quantitative gene expression analysis for the three embryonic germ layer markers PAX6, VIM, and SOX17 in AN_1.1 primed and naïve hPSCs, hTSC-like cells derived from naïve hPSCs, and primed hPSCs cultured in hTSC medium. Error bars indicate ±1 SD of technical replicates. ‘**' indicates a p-value<0.01, ‘***' indicates a p-value<0.001, and ‘n.s.’ indicates a p-value>0.05. (G) Phase contrast images of H9 naïve hPSCs cultured in PXGL (left) and H9 hTSC-like cells derived from naïve hPSCs cultured in PXGL (right). The scale bars indicate 75 μm. (H) Flow cytometry analysis for TSC markers ITGA6 and EGFR in H9 naïve hPSCs cultured in PXGL (left) and H9 hTSC-like cells derived from naïve hPSCs cultured in PXGL (right). (I) Quantitative gene expression analysis for trophoblast marker genes KRT7, GATA3, TFAP2C, TEAD4, CDX2, and ELF5 in H9 naïve hPSCs, H9 hTSC-like cells derived from naïve hPSCs cultured in 5i/L/A, and H9 hTSC-like cells derived from naïve hPSCs cultured in PXGL. Error bars indicate ±1 SD of technical replicates. ‘**' indicates a p-value<0.01, and ‘n.s.’ indicates a p-value>0.05. (J) Immunofluorescence staining for TSC markers KRT7, TEAD4, and TP63 in H9 hTSC-like cells derived from naïve hPSCs cultured in PXGL. The scale bars indicate 75 μm.
Figure 2—figure supplement 2.
Figure 2—figure supplement 2.. Derivation of naïve hTSCs from clonally expanded naïve hPSCs.
(A) Phase contrast images of single-cell expanded H9 naïve hPSC clones A1, A2, and A3 (top), and naïve hTSCs derived from A1, A2, and A3 naïve hPSCs (bottom). The scale bars indicate 75 μm. (B) Flow cytometry analysis for naïve hPSC markers SUSD2 and CD75 in A1, A2, and A3 naïve hPSCs (top) and A1, A2, and A3 naïve hTSCs (bottom). (C) Flow cytometry analysis for TSC markers ITGA6 and EGFR in A1, A2, and A3 naïve hPSCs (top) and A1, A2, and A3 naïve hTSCs (bottom).
Figure 3.
Figure 3.. Directed differentiation of EVTs and STBs from naïve hPSC-derived hTSCs.
(A) The experimental scheme for EVT differentiation from naïve hPSC-derived hTSCs. (B) Phase contrast image of H9 and AN_1.1 hTSC-like and EVT-like cells. The scale bars indicate 75 μm. (C) Flow cytometry analysis for EVT marker HLA-G in H9 and AN_1.1 hTSC-like cells and EVT-like cells. (D) Levels of MMP2 secreted by H9 and AN_1.1 hTSC-like cells and EVT-like cells as measured by ELISA. Error bars indicate ±1 SD of technical replicates. (E) Quantitative gene expression analysis for EVT marker gene MMP2 in H9 and AN_1.1 hTSC-like cells and EVT-like cells. Error bars indicate ± 1 SD of technical replicates. ‘***' indicates a p-value<0.001. (F) Matrigel invasion assay of H9 and AN_1.1 hTSC-like cells and EVT-like cells. (G) The experimental scheme for STB differentiation from naïve hPSC-derived hTSCs. (H) Phase contrast image of H9 and AN_1.1 hTSC-like and 3D STB-like cells. The scale bars indicate 75 μm. (I) Quantitative gene expression analysis for STB marker genes CGB and SDC1 in H9 and AN_1.1 hTSC-like cells and 3D STB-like cells. Error bars indicate ±1 SD of technical replicates. ‘*' indicates a p-value<0.05, and ‘**' indicates a p-value<0.01. (J) Immunofluorescence staining for STB markers hCG and SDC1 in H9 3D STB-like cells. The scale bars indicate 75 μm. (K) Immunofluorescence staining for STB markers hCG and SDC1 in AN_1.1 3D STB-like cells. The scale bars indicate 75 μm. (L) Quantitative gene expression analysis for TSC marker gene TEAD4 in H9 and AN_1.1 hTSC-like cells and 3D STB-like cells. Error bars indicate ± 1 SD of technical replicates. ‘***' indicates a p-value<0.001.
Figure 3—figure supplement 1.
Figure 3—figure supplement 1.. Directed differentiation of EVTs and STBs from naïve hPSC-derived hTSCs.
(A) Immunofluorescence staining for EVT marker MMP2 in H9 and AN_1.1 EVT-like cells. The scale bars indicate 75 μm. (B) Quantitative gene expression analysis for EVT marker gene HLA-G in H9 and AN_1.1 hTSC-like cells and EVT-like cells. Error bars indicate ±1 SD of technical replicates. ‘***' indicates a p-value<0.001. (C) The relative fold change of the number of invading cells following Matrigel invasion assay of H9 and AN_1.1 hTSC-like cells and EVT-like cells. Error bars indicate ±1 standard error of technical replicates. ‘**' indicates a p-value<0.01, and ‘***' indicates a p-value<0.001. (D) Phase contrast and fluorescence image of AN_1.1 2D STB-like cells, which exhibit multinucleation. The scale bars indicate 75 μm. (E) Immunofluorescence staining for STB marker hCG in H9 and AN_1.1 2D STB-like cells. The scale bars indicate 75 μm.
Figure 4.
Figure 4.. Transcriptomic and chromatin accessibility profiling of naïve hPSC-derived hTSCs.
(A) Principal component analysis (PCA) of primed, capacitated, and naïve hPSCs, BT5 hTSCs, naïve hTSCs, EVTs, STBs, and primed hPSCs cultured in hTSC medium based on RNA-seq data. Circles were drawn around samples cultured in the same media. (B) Volcano plots showing fold change (X axis) between naïve hTSCs and primed hPSCs cultured in hTSC medium. The light blue dots represent genes that are the most significantly upregulated in primed hTSCs (defined as those that have a log fold change < −1 and wherein p<0.05). The red dots represent genes that are the most significantly upregulated in naïve hPSCs cultured in hTSC medium (defined as those that have a log fold change >1 and wherein p<0.05). (C) Heatmap of RNA-seq data from naïve hPSCs, naïve hTSCs, EVTs, and STBs (DEGs with more than 2X fold change and p-adj < 0.05 are analyzed). Cluster one represents genes highly expressed in naïve hPSCs only. Cluster two represents genes highly expressed in both naïve hPSCs and naïve hTSCs. Cluster three represents genes highly expressed in naïve hTSCs only. Cluster four represents genes highly expressed in both naïve hTSCs and EVTs. Cluster five represents genes highly expressed in EVTs only. Cluster six represents genes highly expressed in STBs only. (D) Expression levels of key marker genes associated with clusters 1–6. (E) Heatmap indicating the correlation among scRNA-seq data from published day 6, day 8, day 10, and day 12 TE, EPI, and PE (Zhou et al., 2019), as well as RNA-seq data from naïve and BT5 hTSCs. Genes specifically expressed in the TE, EPI, or PE lineages were analyzed (Zhou et al., 2019). (F) Heatmap of ATAC-seq data from naïve hESCs and naïve hTSCs (Pearson correlations were calculated based on genome-wise ATAC-seq signal). Naïve hESC ATAC-seq data were retrieved from a published dataset (Pastor et al., 2018). (G) Transcription factor binding motifs enriched in the promoter and non-promoter regions of the DARs specific to naïve hESCs vs. naïve hTSCs and naïve hESCs vs. BT5 hTSCs.
Figure 4—figure supplement 1.
Figure 4—figure supplement 1.. Transcriptomic profiling of naïve hPSC-derived hTSCs.
(A) Expression levels of known trophoblast markers genes in H9 naïve hTSCs, AN_1.1 naïve hTSCs, WIBR3 naïve hTSCs, and BT5 hTSCs. (B) Heatmap indicating the correlation among scRNA-seq data from published day 6, day 8, day 10, and day 12 TE (Zhou et al., 2019), as well as RNA-seq data from naïve hTSCs. TE genes with stage-specific expression patterns were analyzed (Zhou et al., 2019). (C) Heatmap of scRNA-seq data from published day 10 and day 12 Epiblast (EPI) and Trophectoderm (TE) (Zhou et al., 2019), as well as RNA-seq data from naïve hPSCs and naïve hTSCs. Genes specifically expressed in the TE or EPI lineage at day 10 or 12 were analyzed (Zhou et al., 2019). (D) Complete list of GO terms (biological processes) and their p-values. The top 10% most upregulated genes in naïve hTSC relative to naïve hPSC in C were analyzed.
Figure 4—figure supplement 2.
Figure 4—figure supplement 2.. Chromatin accessibility profiling of naïve hPSC-derived hTSCs.
(A) The genomic distribution of DARs specific to naïve hESCs and naïve hTSCs. (B) The distribution of distance from the transcriptional start site (TSS) to the DARs specific to naïve hESCs and naïve hTSCs. (C) ATAC-seq signal at promoter regions of genes within cluster 1 (enriched in naïve hESCs) and cluster 3 (enriched in naïve hTSCs) in naïve hESCs and naïve hTSCs (Mann-Whitney U test). (D) Phase contrast images of the maintenance of H9 naïve hPSCs (top) and the derivation of H9 naïve hTSCs (bottom). 5i/L/A (top) and hTSC media (bottom) were supplemented with Verteporfin at the indicated concentration. The scale bars indicate 75 μm. (E) Immunofluorescence staining for YAP in H9 naïve hPSCs and H9 naïve hTSCs. The scale bars indicate 75 μm.

Similar articles

Cited by

References

    1. Allison TF, Andrews PW, Avior Y, Barbaric I, Benvenisty N, Bock C, Brehm J, Brüstle O, Damjanov I, Elefanty A, International Stem Cell Initiative Assessment of established techniques to determine developmental and malignant potential of human pluripotent stem cells. Nature Communications. 2018;9:1925. doi: 10.1038/s41467-018-04011-3. - DOI - PMC - PubMed
    1. Amita M, Adachi K, Alexenko AP, Sinha S, Schust DJ, Schulz LC, Roberts RM, Ezashi T. Complete and unidirectional conversion of human embryonic stem cells to trophoblast by BMP4. PNAS. 2013;110:E1212–E1221. doi: 10.1073/pnas.1303094110. - DOI - PMC - PubMed
    1. Bernardo AS, Faial T, Gardner L, Niakan KK, Ortmann D, Senner CE, Callery EM, Trotter MW, Hemberger M, Smith JC, Bardwell L, Moffett A, Pedersen RA. BRACHYURY and CDX2 mediate BMP-induced differentiation of human and mouse pluripotent stem cells into embryonic and extraembryonic lineages. Cell Stem Cell. 2011;9:144–155. doi: 10.1016/j.stem.2011.06.015. - DOI - PMC - PubMed
    1. Bischof P, Irminger-Finger I. The human cytotrophoblastic cell, a mononuclear chameleon. The International Journal of Biochemistry & Cell Biology. 2005;37:1–16. doi: 10.1016/j.biocel.2004.05.014. - DOI - PubMed
    1. Blij S, Parenti A, Tabatabai-Yazdi N, Ralston A. Cdx2 Efficiently Induces Trophoblast Stem-Like Cells in Naïve, but Not Primed, Pluripotent Stem Cells. Stem Cells and Development. 2015;24:1352–1365. doi: 10.1089/scd.2014.0395. - DOI - PMC - PubMed

Publication types

Associated data