. 2020 Apr 8;106(1):166-176.e6.
doi: 10.1016/j.neuron.2020.01.017. Epub 2020 Feb 11.

Inference-Based Decisions in a Hidden State Foraging Task: Differential Contributions of Prefrontal Cortical Areas

Affiliations

Inference-Based Decisions in a Hidden State Foraging Task: Differential Contributions of Prefrontal Cortical Areas

Pietro Vertechi et al. Neuron. .

Abstract

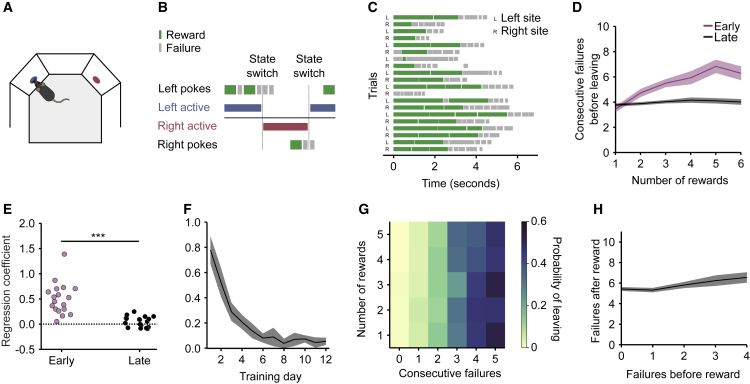
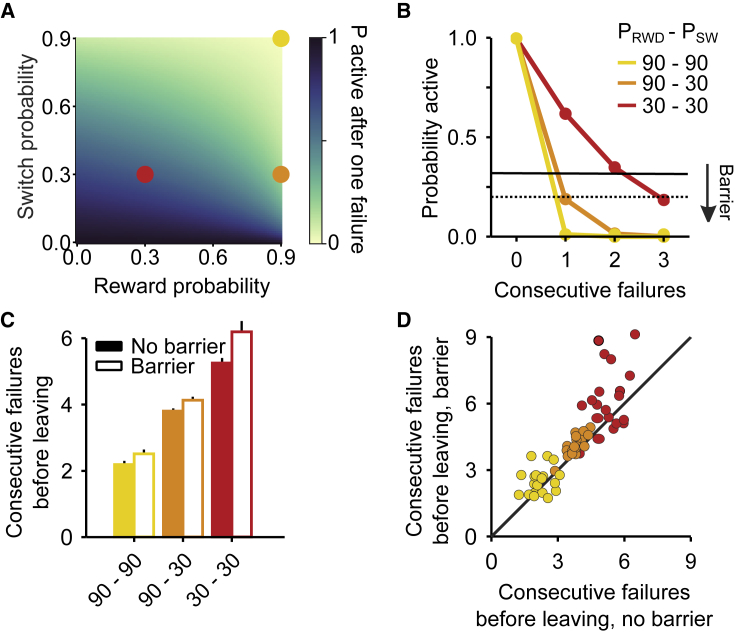
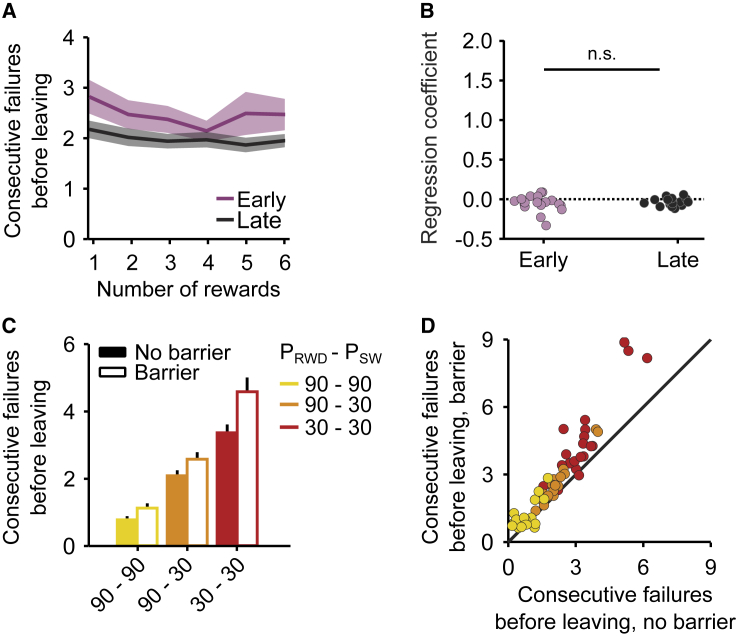
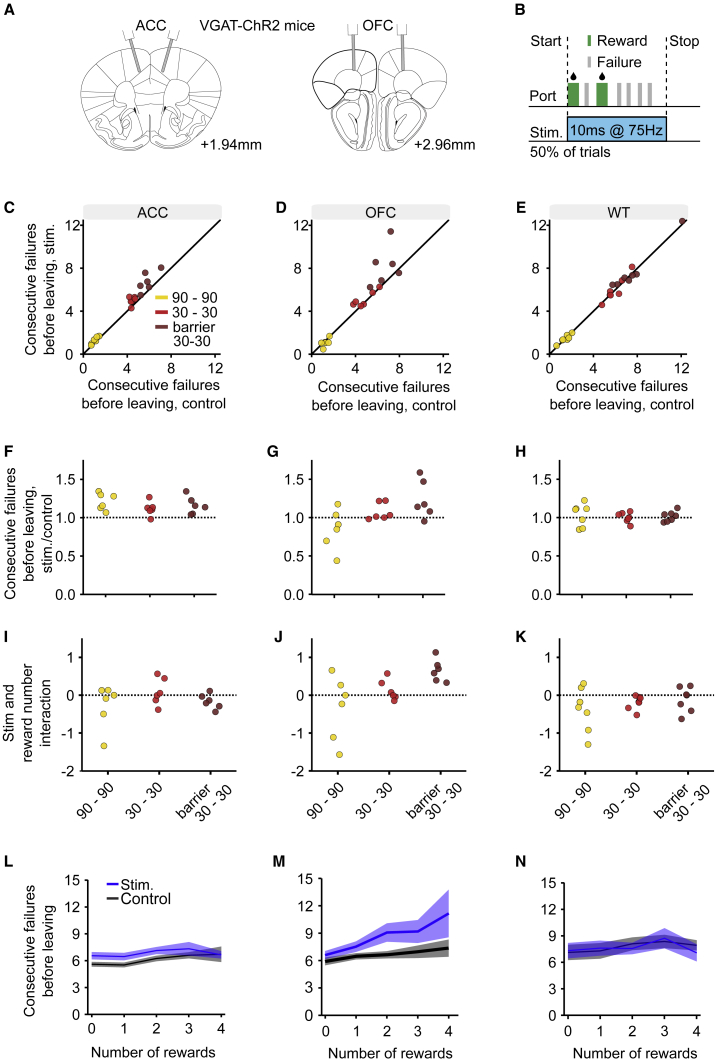
Essential features of the world are often hidden and must be inferred by constructing internal models based on indirect evidence. Here, to study the mechanisms of inference, we establish a foraging task that is naturalistic and easily learned yet can distinguish inference from simpler strategies such as the direct integration of sensory data. We show that both mice and humans learn a strategy consistent with optimal inference of a hidden state. However, humans acquire this strategy more than an order of magnitude faster than mice. Using optogenetics in mice, we show that orbitofrontal and anterior cingulate cortex inactivation impacts task performance, but only orbitofrontal inactivation reverts mice from an inference-based to a stimulus-bound decision strategy. These results establish a cross-species paradigm for studying the problem of inference-based decision making and begins to dissect the network of brain regions crucial for its performance.

Keywords: PFC; cross-species task; foraging; inference; state representation.


Conflict of interest statement

Declaration of interests The authors declare no competing interests.

Figures

Figure 1
Figure 1
A Probabilistic Foraging Task Can Dissociate Stimulus-Bound from Inference-Based Evidence Accumulation (A) Formally, the task is a hidden Markov model with LeftActive and RightActive states. It has two parameters: probability of reward given state and probability of state transition. (B and C) Estimated relative value (left minus right) as a function of trial history (rewards in green, failures in gray) in the stimulus-bound model (B) and inference-based model (C), respectively. Shaded patches indicate actual state. (D) Effect of rewards on relative value in stimulus-bound and inference-based models: the two models are simulated in a trial with only rewards on the same site. Relative value increases with reward number in the stimulus-bound but not in the inference-based model. (E) Consecutive failures before leaving (normalized subtractively) as a function of reward number in a simulated data of stimulus-bound and inference-based models: reward number has an effect on consecutive failures in the stimulus-bound but not in the inference-based model.
Figure 2
Figure 2
Mice Accumulate Inferred Evidence for State Switches and Not Site Value (A) Schematic of rodent task. Mice shuttle back and forth between two reward sites to obtain water rewards. (B) Example sequence of pokes. Pokes in the correct site can be rewarded or not, whereas pokes in the incorrect site are never rewarded. Following a state switch, the animals need to travel to the other site to obtain more rewards. (C) Example behavior: sequence of poke bouts (i.e., trials) with rewards in green and failures in gray. (D) Consecutive failures before leaving as a function of reward number in early training (days 1 to 3, purple) compared with late training (days 10 to 12, black). Solid line represents mean and sha. (E) Slope coefficient in ConsecutiveFailures1+RewardNumber for early training and late training. Slope coefficient is higher in early trials, likelihood ratio test on linear mixed-effect model ConsecutiveFailures1+RewardNumber+Early+RewardNumber&Early+(1|MouseID) versus a null model with no interaction: p < 1e−10, n = 18 mice (see STAR Methods for a description of the formula notation). (F) Evolution of reward number coefficient across days. Solid line and shaded area represent mean and across animals. Solid line and shaded area represent mean and SEM across animals. (G) Probability of leaving as a function of number of rewards and consecutive failures in late training. (H) Failures after reward as a function of failure before reward in trials with only one reward in a more difficult protocol. Solid line and shaded area represent mean and across animals. Solid line and shaded area represent mean and SEM across animals. See also Video S1.
Figure 3
Figure 3
Accumulation of Inferred Evidence Is Tuned to Task Parameters (A) Probability of being on the correct site after a failure as a function of reward probability and transition probability. (B) Probability of being on the correct site as a function of trial history for three protocols (Easy environment: pRWD = 0.9 and pSW = 0.9; Medium environment: pRWD = 0.9 and pSW = 0.3; Hard environment: pRWD = 0.3 and pSW = 0.3). Leaving decisions can be modeled by setting a threshold on this probability that changes as a function of the travel cost (black lines). (C) Consecutive failures before leaving as a function of the environment statistics and barrier condition. Error bars represent SEM across animals. (D) Consecutive failures before leaving split by subject and environment statistics, barrier versus no barrier.
Figure 4
Figure 4
Humans Perform Optimal Inference and Tune Behavior to Task Parameters (A) The number of rewards has little effect on the probability of leaving during both early (purple) and late (black) training. Solid line and shaded area represent mean and across animals. Solid line and shaded area represent mean and SEM across animals. (B) Number of consecutive failures as a function of reward number for human in early versus late part of training. Unlike mice, humans learn the statistics of the environment extremely quickly: slope coefficient is similar (and around 0) in both early and late trials: likelihood ratio test on linear mixed-effect model ConsecutiveFailures~1+RewardNumber+Early+RewardNumber&Early+(1|SubjectID) versus a null model with no interaction: p = 0.45, n = 20 subjects. (C) Consecutive failures before leaving as a function of the environment statistics and barrier condition. Error bars represent SEM across subjects. (D) Consecutive failures before leaving split by subject and environment statistics, barrier versus no barrier. See also Video S2.
Figure 5
Figure 5
OFC, but Not ACC, Is Necessary for Optimal Inference (A) Scheme of the optic fiber placement. (B) Bilateral photostimulation at 3 mW happened during nose-poking: it was triggered by the first poke in 50% of trials and lasted for 500 ms after the last poke in the trial. (C–E) Consecutive failures before leaving split by environment statistics, barrier condition, and subject inactivation versus control trials, for ACC implanted heterozygotes (C), OFC implanted heterozygotes (D), and wild-types (E), respectively. (F–H) Ratio of consecutive failures before leaving split in the same way as (C)–(E) for ACC implanted heterozygotes (F), OFC implanted heterozygotes (G), and wild-types (H), respectively. When predicting renormalized consecutive failures, Stimulation and Protocol interact for OFC implanted heterozygotes (p < 1e−10, n = 6 mice) but not for ACC implanted heterozygotes (p = 0.15, n = 6 mice) or wild-types (p = 0.77, n = 7 mice). (I–K) An animal by animal quantification: the coefficient of the interaction term in ConsecutiveFailures1+Stimulation+Rewardnumber+Rewardnumber&Stimulation for ACC implanted heterozygotes (I), OFC implanted heterozygotes (J), and wild-types (K). (L–N) Number of consecutive failures as a function of reward number in the 30-30 barrier protocol for ACC implanted heterozygotes (L), OFC implanted heterozygotes (M), and wild-types (N). Solid lines and shaded areas represent mean and SEM across animals. See also Figure S2 and Table S1.

References

    1. Bezanson J., Edelman A., Karpinski S., Shah V. Julia: A Fresh Approach to Numerical Computing. SIAM Rev. 2017;59:65–98.
    1. Boyen X., Friedman N., Koller D. Discovering the Hidden Structure of Complex Dynamic Systems. arXiv. 1999 https://arxiv.org/abs/1301.6683 arXiv:1301.6683.
    1. Braun D.A., Mehring C., Wolpert D.M. Structure learning in action. Behav. Brain Res. 2010;206:157–165. - PMC - PubMed
    1. Brunton B.W., Botvinick M.M., Brody C.D. Rats and humans can optimally accumulate evidence for decision-making. Science. 2013;340:95–98. - PubMed
    1. Charnov E.L. Optimal foraging, the marginal value theorem. Theor. Popul. Biol. 1976;9:129–136. - PubMed

Publication types

LinkOut - more resources