Comparative Study
. 2020 Feb 10;37(2):243-257.e7.
doi: 10.1016/j.ccell.2020.01.004.

Comparative Molecular Life History of Spontaneous Canine and Human Gliomas

Affiliations
Comparative Study

Comparative Molecular Life History of Spontaneous Canine and Human Gliomas

Samirkumar B Amin et al. Cancer Cell. .

Abstract

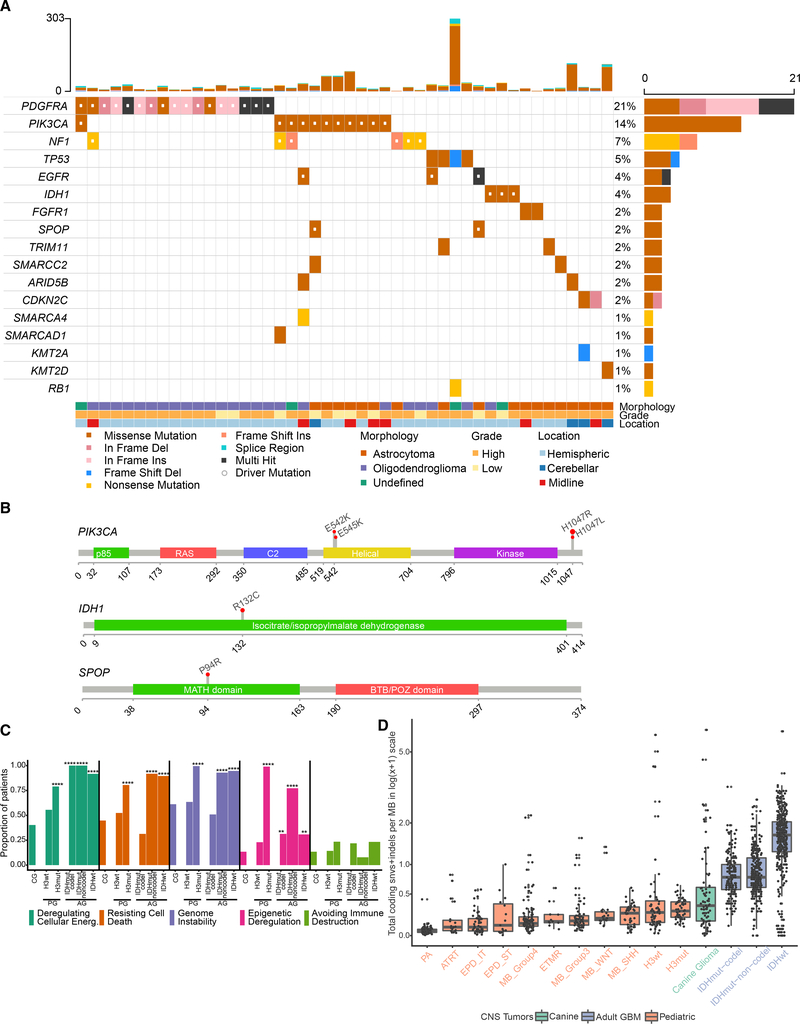
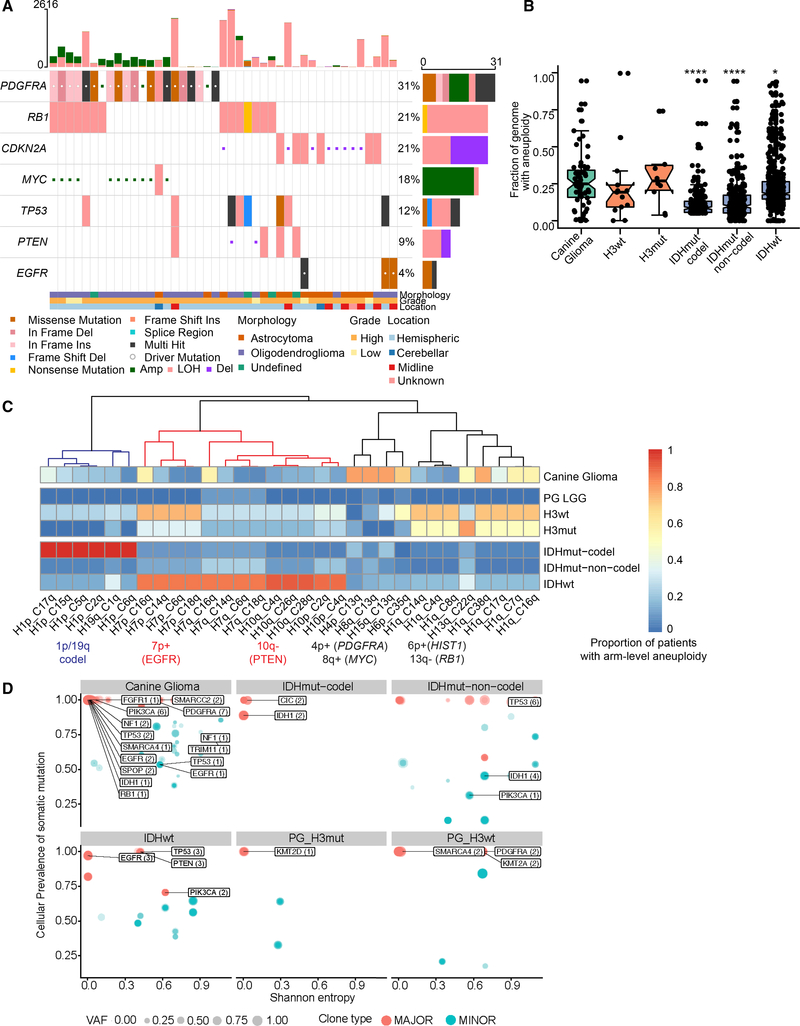
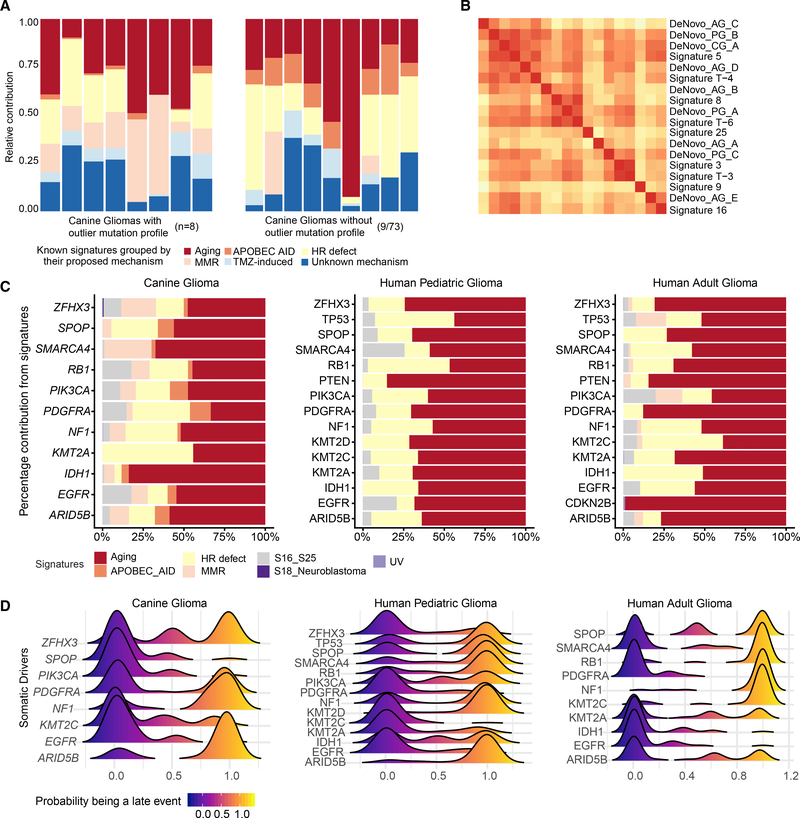
Sporadic gliomas in companion dogs provide a window on the interaction between tumorigenic mechanisms and host environment. We compared the molecular profiles of canine gliomas with those of human pediatric and adult gliomas to characterize evolutionarily conserved mammalian mutational processes in gliomagenesis. Employing whole-genome, exome, transcriptome, and methylation sequencing of 83 canine gliomas, we found alterations shared between canine and human gliomas such as the receptor tyrosine kinases, TP53 and cell-cycle pathways, and IDH1 R132. Canine gliomas showed high similarity with human pediatric gliomas per robust aneuploidy, mutational rates, relative timing of mutations, and DNA-methylation patterns. Our cross-species comparative genomic analysis provides unique insights into glioma etiology and the chronology of glioma-causing somatic alterations.

Keywords: adult glioma; canine glioma; comparative genomics; comparative oncology; computational biology; life history; mutagenesis; pediatric glioma.


Conflict of interest statement

Declaration of Interests R.G.W.V. declares equity in Boundless Bio, Inc. A.B.H. receives royalties and milestone payments for licensed intellectual property from Celldex Therapeutics, research grant support from Merck, and is a scientific board member for Caris Life Sciences. The other authors declare no competing interests.

Figures

Figure 1.
Figure 1.. Comparative Somatic Landscape of Canine and Human Gliomas
(A) Somatic variants in canine gliomas. Top bar plot shows patient-wise frequency of somatic variants (n = 46 of 81 canine patients) and right-side bar plot shows gene-wise frequency of somatic variant types. Bottom annotations show relevant patient-specific annotations. (B) Gene lollipop plots showing recurrent hotspot mutations for three genes: PIK3CA, IDH1, and SPOP. All hotspot mutations are ortholog to validated COSMIC mutations in human cancers. (C) Hallmark enrichment of somatic cancer drivers (mutations and copy-number alterations) across canine glioma (CG) and WHO molecular subtypes of human adult (IDH wild-type, IDHmut-codel, IDHmut-noncodel) and pediatric (H3-mutant and H3 wild-type) high-grade glioma. y axis represents proportion of patients in the respective cohort harboring mutations in selected five hallmarks. Two-sided Fisher’s exact test was used for comparison of proportions between cohorts. p values less than the threshold (p < 0.05) are shown (*p < 0.05, **p < 0.01, ***p < 0.001, ****p < 0.0001). (D) Somatic mutation rate across canine and human brain tumors: Box plot showing somatic mutation rates as coding mutations per megabase in log1p or log(x+1) scale. x axis shows 11 types of pediatric brain tumors (Gröbner et al., 2018), canine glioma (n = 81), adult pediatric high-grade gliomas separated by H3 mutant and H3 wild type, and adult gliomas separated by IDH mutation and 1p/19q codeletion status (far right). Each box spans the first and third quartiles with the median in the center. The lower and upper whiskers extend up to 1.5 times interquartile range, and values outside whiskers are outliers. PA, pilocytic astrocytoma; ATRT, atypical teratoid rhabdoid tumor; EPD_ST, ependymoma supratentorial; ETMR, embryonal tumors with multilayered rosettes; MB, medulloblastoma. Tumors are sorted in ascending order by increasing mutation rate. See also Figure S1 and Tables S1, S2, S3, and S4.
Figure 2.
Figure 2.. Aneuploidy Is a Major Driver of High-Grade Gliomas
(A) Focal somatic copy alterations in canine gliomas (n = 43 of 67 canine patients). Squared symbol in cell suggests either amplification (>4 copies) or deep deletion (2 copy loss) based on GISTIC2 gene-level calls (STAR Methods). Top bar plot shows patient-wise frequency of somatic variants and copy-number alterations, and right-side bar plot shows driver-wise frequency of somatic variant types, including copy-number alterations. Bottom annotations show relevant patient-specific annotations. (B) Comparative aneuploidy score: box plots showing fraction of genome with aneuploidy (y axis) for canine gliomas (n = 67), H3-mutant (n = 10), and H3 wild-type (n = 13) pediatric high-grade gliomas, and human adult glioma (n = 969), separated by IDH mutation and 1p/19q codeletion status. Each box spans the first and third quartiles with the median in the center. The lower and upper whiskers extend up to 1.58 times interquartile rage divided by square root of samples per box plot (displayed as dots; STAR Methods), and values outside whiskers are outliers. p values were calculated using two-sided Wilcoxon rank-sum non-parametric test (*p < 0.05, **p < 0.01, ***p < 0.001, ****p < 0.0001). (C) Aneuploidy metrics across shared syntenic regions of canine and human genome: Heatmap showing comparative aneuploidy across three cohorts. Each column shows the proportion of patients with the most variable arm-level aneuploidy (present or absent) for a given shared syntenic region. x-axis label shows syntenic chromosome arms for human (H) and canine (C) genome. Each row represents canine glioma and molecular subgroups of human high-grade pediatric and adult glioma as detailed in (B), plus pediatric low-grade gliomas (PG_LGG). Colored dendrogram branches (blue, red, and black) represent three aneuploidy clusters described in the main text. Corresponding glioma driver alterations are highlighted below syntenic chromosome arms. (D) Scatterplot showing distribution of somatic glioma driver genes with respect to their cellular prevalence (cancer cell fraction) and intratumoral heterogeneity (Shannon entropy) across canine and molecular subtypes of human pediatric and adult gliomas. Each circle represents a clonal cluster assignment per tumor sample. Size of the circle represents a major (1 clone) versus minor subclones (ranging from 2 to 4). Labeled genes represent glioma drivers shown in Figure 1A. Darker to lighter blue scale for circle and driver genes it may contain (arrows) represents the increase in intratumoral heterogeneity as measured by Shannon entropy. See also Figure S2 and Table S3.
Figure 3.
Figure 3.. Molecular Life History Analysis Using Mutational Signatures and Timing Analysis
(A) Deconvolution of known human mutational signatures on canine glioma somatic variant data. Stacked bar plots show relative contribution of known human mutational signatures in individual canine patients. Signature contributions were aggregated based on their grouping into proposed mechanism. Only signatures with a relative contribution of more than a third quartile per sample are shown in the plot. Plot on the left side shows eight cases with highest mutational frequency (based on outlier mutational profile, STAR Methods) and plot on the right side shows nine representative cases with median signature contribution within interquartile range. Signatures with no proposed mechanism are grouped into the unknown category. APOBEC AID, activation-induced cytidine deaminases; HR defect, homologous repair defect; MMR, mismatch repair; TMZ-induced, alkylating agent temozolomide-associated signature. (B) Hierarchical clustering of cosine similarities between known human mutational signatures and de novo signatures constructed using available whole-genome data from canine (CG), pediatric (PG), and adult (AG) data. Higher cosine similarity (red color) indicates higher resemblance of de novo signature to known mutational signature. Only one of three cluster groups are shown here; the complete clustering is shown in Figure S3D. (C) Horizontal stacked bar plots represent percentage contribution of signature groups (x axis) for somatic driver mutations (y axis) found in canine and human gliomas. Each of seven signature groups represents a combination of one of more known human signatures. S16_S25 and S18_Neuroblastoma: signatures were previously described by Gröbner et al. (2018). (D) Molecular timing of somatic drivers across canine and human gliomas: Stacked density plots, one per each of three cohorts, shows probability (x axis) of a driver event (y axis) being a late event in tumor evolution and value of <0.5 being an earlier event. Density plots for each driver event were calculated based on pairwise winning probability (where win is defined as an early event) as used in sports statistics (Bradley-Terry model). Winning probabilities were subtracted from 1 to display early events on the left side of the plot. See also Figure S3 and Table S5.
Figure 4.
Figure 4.. Classification of Canine Gliomas Using Human Brain Tumor Methylation Classifier
Heatmap displaying results of L2-regularized, logistic regression classification of canine methylation profiles (n = 45). Each column of the heatmap represents a sample, and each row in the top panel is the probability that that sample falls under a given subtype classification. The classification with the highest probability in a given sample has a symbol with symbol color, size, and shape denoting sample histology, tumor grade, and anatomical location, respectively. Panels below the probability heatmap show the tumor purity, somatic mutation rate, and age for the samples. The horizontal line on the age subpanel denotes the age of maturity for canines (2 years). See also Figure S4.
Figure 5.
Figure 5.. Immunohistochemistry of Canine and Human Gliomas
(A) Representative hematoxylin & eosin and immunohistochemistry staining of human adult (n = 11), canine (n = 11), and human pediatric gliomas (n = 5) using antibodies against T cells (CD3), macrophage/microglia (IBA1), M2 polarized innate immune cells (CD163), monocytes (CD14), and B cells (CD79A). Scale bars, 50 μm. (B) Violin plots represent the density of percentage positivity by field (y axis) for each of five antibodies described in (A). The points are the mean value of percentage positivity per patient within each of three cohorts, i.e., human adult (n = 11), canine (n = 11), and human pediatric gliomas (n = 5). Patients were grouped into high- versus low-grade gliomas in the absence of available molecular subtype data. See also Figure S5.

References

    1. Addissie S, and Klingemann H (2018). Cellular immunotherapy of canine cancer. Vet. Sci. 5, 10.3390/vetsci5040100. - DOI - PMC - PubMed
    1. Aktipis CA, Boddy AM, Gatenby RA, Brown JS, and Maley CC (2013). Life history trade-offs in cancer evolution. Nat. Rev. Cancer 13, 883–892. - PMC - PubMed
    1. Alexandrov LB, Nik-Zainal S, Wedge DC, Aparicio SA, Behjati S, Biankin AV, Bignell GR, Bolli N, Borg A, Borresen-Dale AL, et al. (2013). Signatures of mutational processes in human cancer. Nature 500, 415–421. - PMC - PubMed
    1. Alizadeh AA, Aranda V, Bardelli A, Blanpain C, Bock C, Borowski C, Caldas C, Califano A, Doherty M, Elsner M, et al. (2015). Toward understanding and exploiting tumor heterogeneity. Nat. Med. 21, 846–853. - PMC - PubMed
    1. Angermueller C, Lee HJ, Reik W, and Stegle O (2017). DeepCpG: accurate prediction of single-cell DNA methylation states using deep learning. Genome Biol. 18, 67. - PMC - PubMed

Publication types

Substances