

Patient and Hospital Factors Associated With Unexpected Newborn Complications Among Term Neonates in US Hospitals
- PMID: 32049289
- PMCID: PMC8693709
- DOI: 10.1001/jamanetworkopen.2019.19498
Patient and Hospital Factors Associated With Unexpected Newborn Complications Among Term Neonates in US Hospitals
Abstract
Importance: Unexpected complications in term newborns have been recently adopted by the Joint Commission as a marker of obstetric care quality.
Objective: To understand the variation and patient and hospital factors associated with severe unexpected complications in term neonates among hospitals in the United States.
Design, setting, and participants: This cross-sectional study collected data from all births in US counties with 1 obstetric hospital using county-identified birth certificate data and American Hospital Association annual survey data from January 1, 2015, through December 31, 2017. All live-born, term, singleton infants weighing at least 2500 g were included. The data analysis was performed from December 1, 2018, through June 30, 2019.
Exposures: Severe unexpected newborn complication, defined as neonatal death, 5-minute Apgar score of 3 or less, seizure, use of assisted ventilation for at least 6 hours, or transfer to another facility.
Main outcomes and measures: Between-hospital variation and patient and hospital factors associated with unexpected newborn complications.
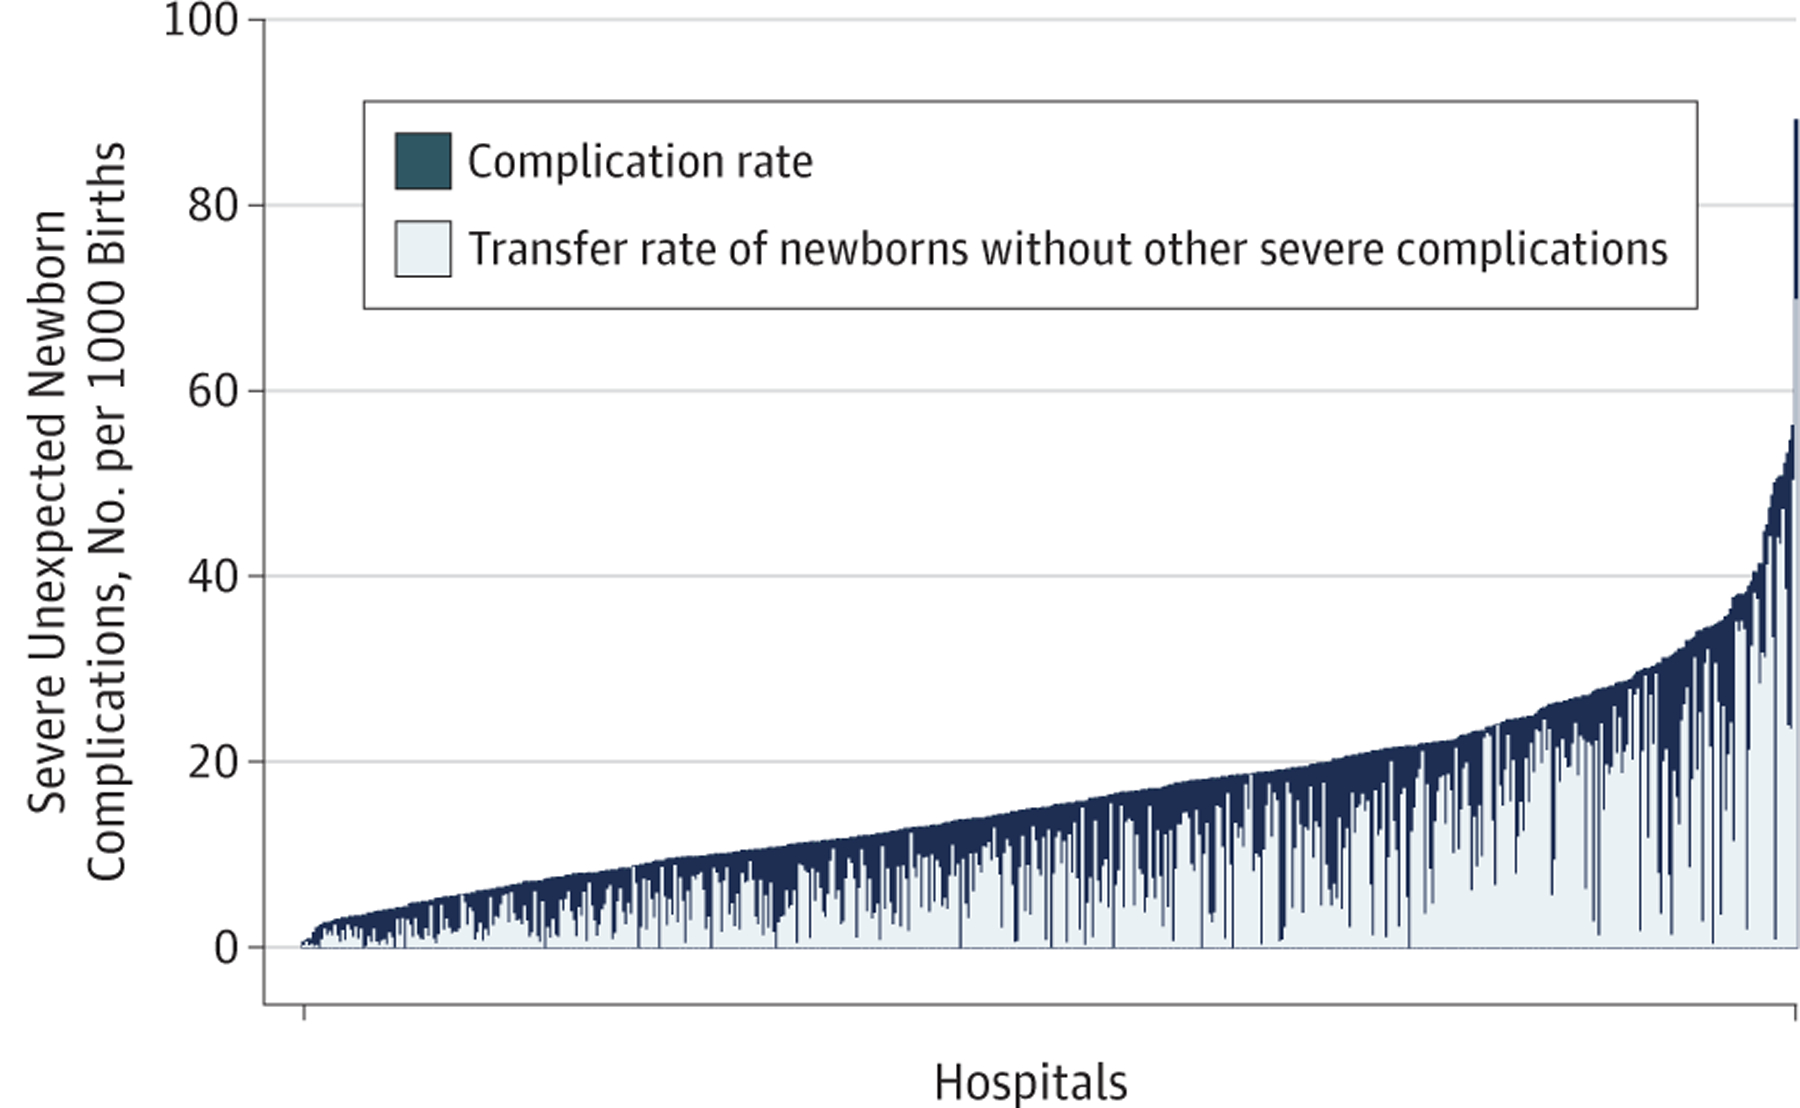
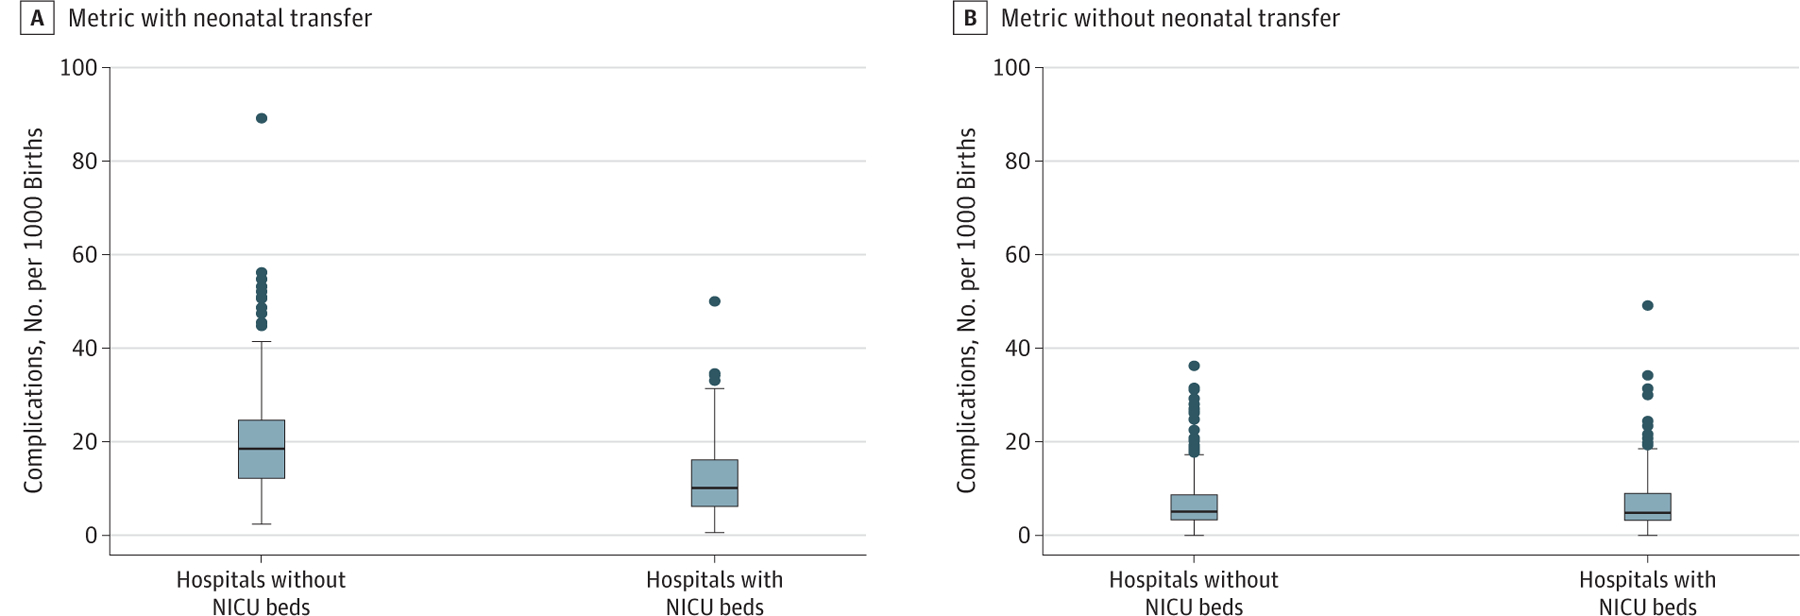
Results: A total of 1 754 852 births from 576 hospitals were included in the analysis. A wide range of hospital complication rates was found (range, 0.6-89.9 per 1000 births; median, 15.3 per 1000 births [interquartile range, 9.6-22.0 per 1000 births]). Hospitals with high newborn complication rates were more likely to care for younger, white, less educated, and publicly insured women with more medical comorbidities compared with hospitals with low complication rates. In the adjusted models, there was little effect of case mix to explain the observed between-county variation (11.3%; 95% CI, 10.0%-12.6%). Neonatal transfer was the primary factor associated with complication rates, especially among hospitals with the highest rates (66.0% of all complications). The risk for unexpected neonatal complication increased by more than 50% for those neonates born at hospitals without a neonatal intensive care unit compared with those with a neonatal intensive care unit (adjusted odds ratio, 1.55; 95% CI, 1.38-1.75).
Conclusions and relevance: In this study, severe unexpected complication rates among term newborns varied widely. When included in the metric numerator, neonatal transfer was the primary factor associated with complications, especially among hospitals with the highest rates. Transfers were more likely to be necessary when infants were born in hospitals with lower levels of neonatal care. Thus, if this metric is to be used in its current form, it would appear that accreditors, regulatory bodies, and payers should consider adjusting for or stratifying by a hospital's level of neonatal care to avoid disincentivizing against appropriate transfers.
Conflict of interest statement
Figures
Comment in
-
Unintended Consequences of Obstetric Quality Metrics-Do Not Throw the Baby Out With the Bathwater.JAMA Netw Open. 2020 Feb 5;3(2):e1919749. doi: 10.1001/jamanetworkopen.2019.19749. JAMA Netw Open. 2020. PMID: 32049286 No abstract available.
References
-
- Bailit JL, Gregory KD, Srinivas S, Westover T, Grobman WA, Saade GR; Society for Maternal-Fetal Medicine (SMFM) Quality and Safety and Health Policy Committees. Society for Maternal-Fetal Medicine (SMFM) special report: current approaches to measuring quality of care in obstetrics. Am J Obstet Gynecol. 2016;215(3):B8–B16. - PubMed
-
- Armstrong JC, Kozhimannil KB, McDermott P, Saade GR, Srinivas SK; Society for Maternal-Fetal Medicine Health Policy Committee. Comparing variation in hospital rates of cesarean delivery among low-risk women using 3 different measures. Am J Obstet Gynecol. 2016;214(2):153–163. - PubMed
-
- Friedman AM, Ananth CV, Prendergast E, D’Alton ME, Wright JD. Evaluation of third-degree and fourth-degree laceration rates as quality indicators. Obstet Gynecol. 2015;125(4):927–937. - PubMed
-
- Committee on Obstetric Practice. ACOG Committee opinion No. 647: limitations of perineal lacerations as an obstetric quality measure. Obstet Gynecol. 2015;126(5):e108–e111. - PubMed
-
- Clapp MA, Little SE, Zheng J, Robinson JN. A multi-state analysis of postpartum readmissions in the United States. Am J Obstet Gynecol. 2016;215(1):113.e1–113.e10. - PubMed
