

Trends in Premature Deaths Among Adults in the United States and Latin America
- PMID: 32049297
- PMCID: PMC8268086
- DOI: 10.1001/jamanetworkopen.2019.21085
Trends in Premature Deaths Among Adults in the United States and Latin America
Abstract
Importance: Premature death rates vary in the United States by race/ethnicity. Despite their socioeconomic disadvantages, US Latino populations have lower premature mortality rates than do US white populations, a phenomenon termed the "Latino or Hispanic paradox."
Objective: To investigate whether there is a broader Latin American paradox by comparing premature mortality rates in the United States according to race/ethnicity with rates in Latin America and Puerto Rico from 2001 to 2015.
Design, setting, and participants: This descriptive cross-sectional study used mortality data from the World Health Organization Mortality Database. All deaths occurring in individuals aged 20 to 64 years among US Latino, African American, white, and Puerto Rican and 12 other Latin American populations from January 2001 to December 2015 were selected. The data analysis began in October 2018.
Exposures: Age, sex, race/ethnicity, and country.
Main outcomes and measures: All-cause mortality, cause-specific mortality, age-standardized mortality rates (AMSRs), and average annual percentage change in mortality rates during 2001 to 2015.
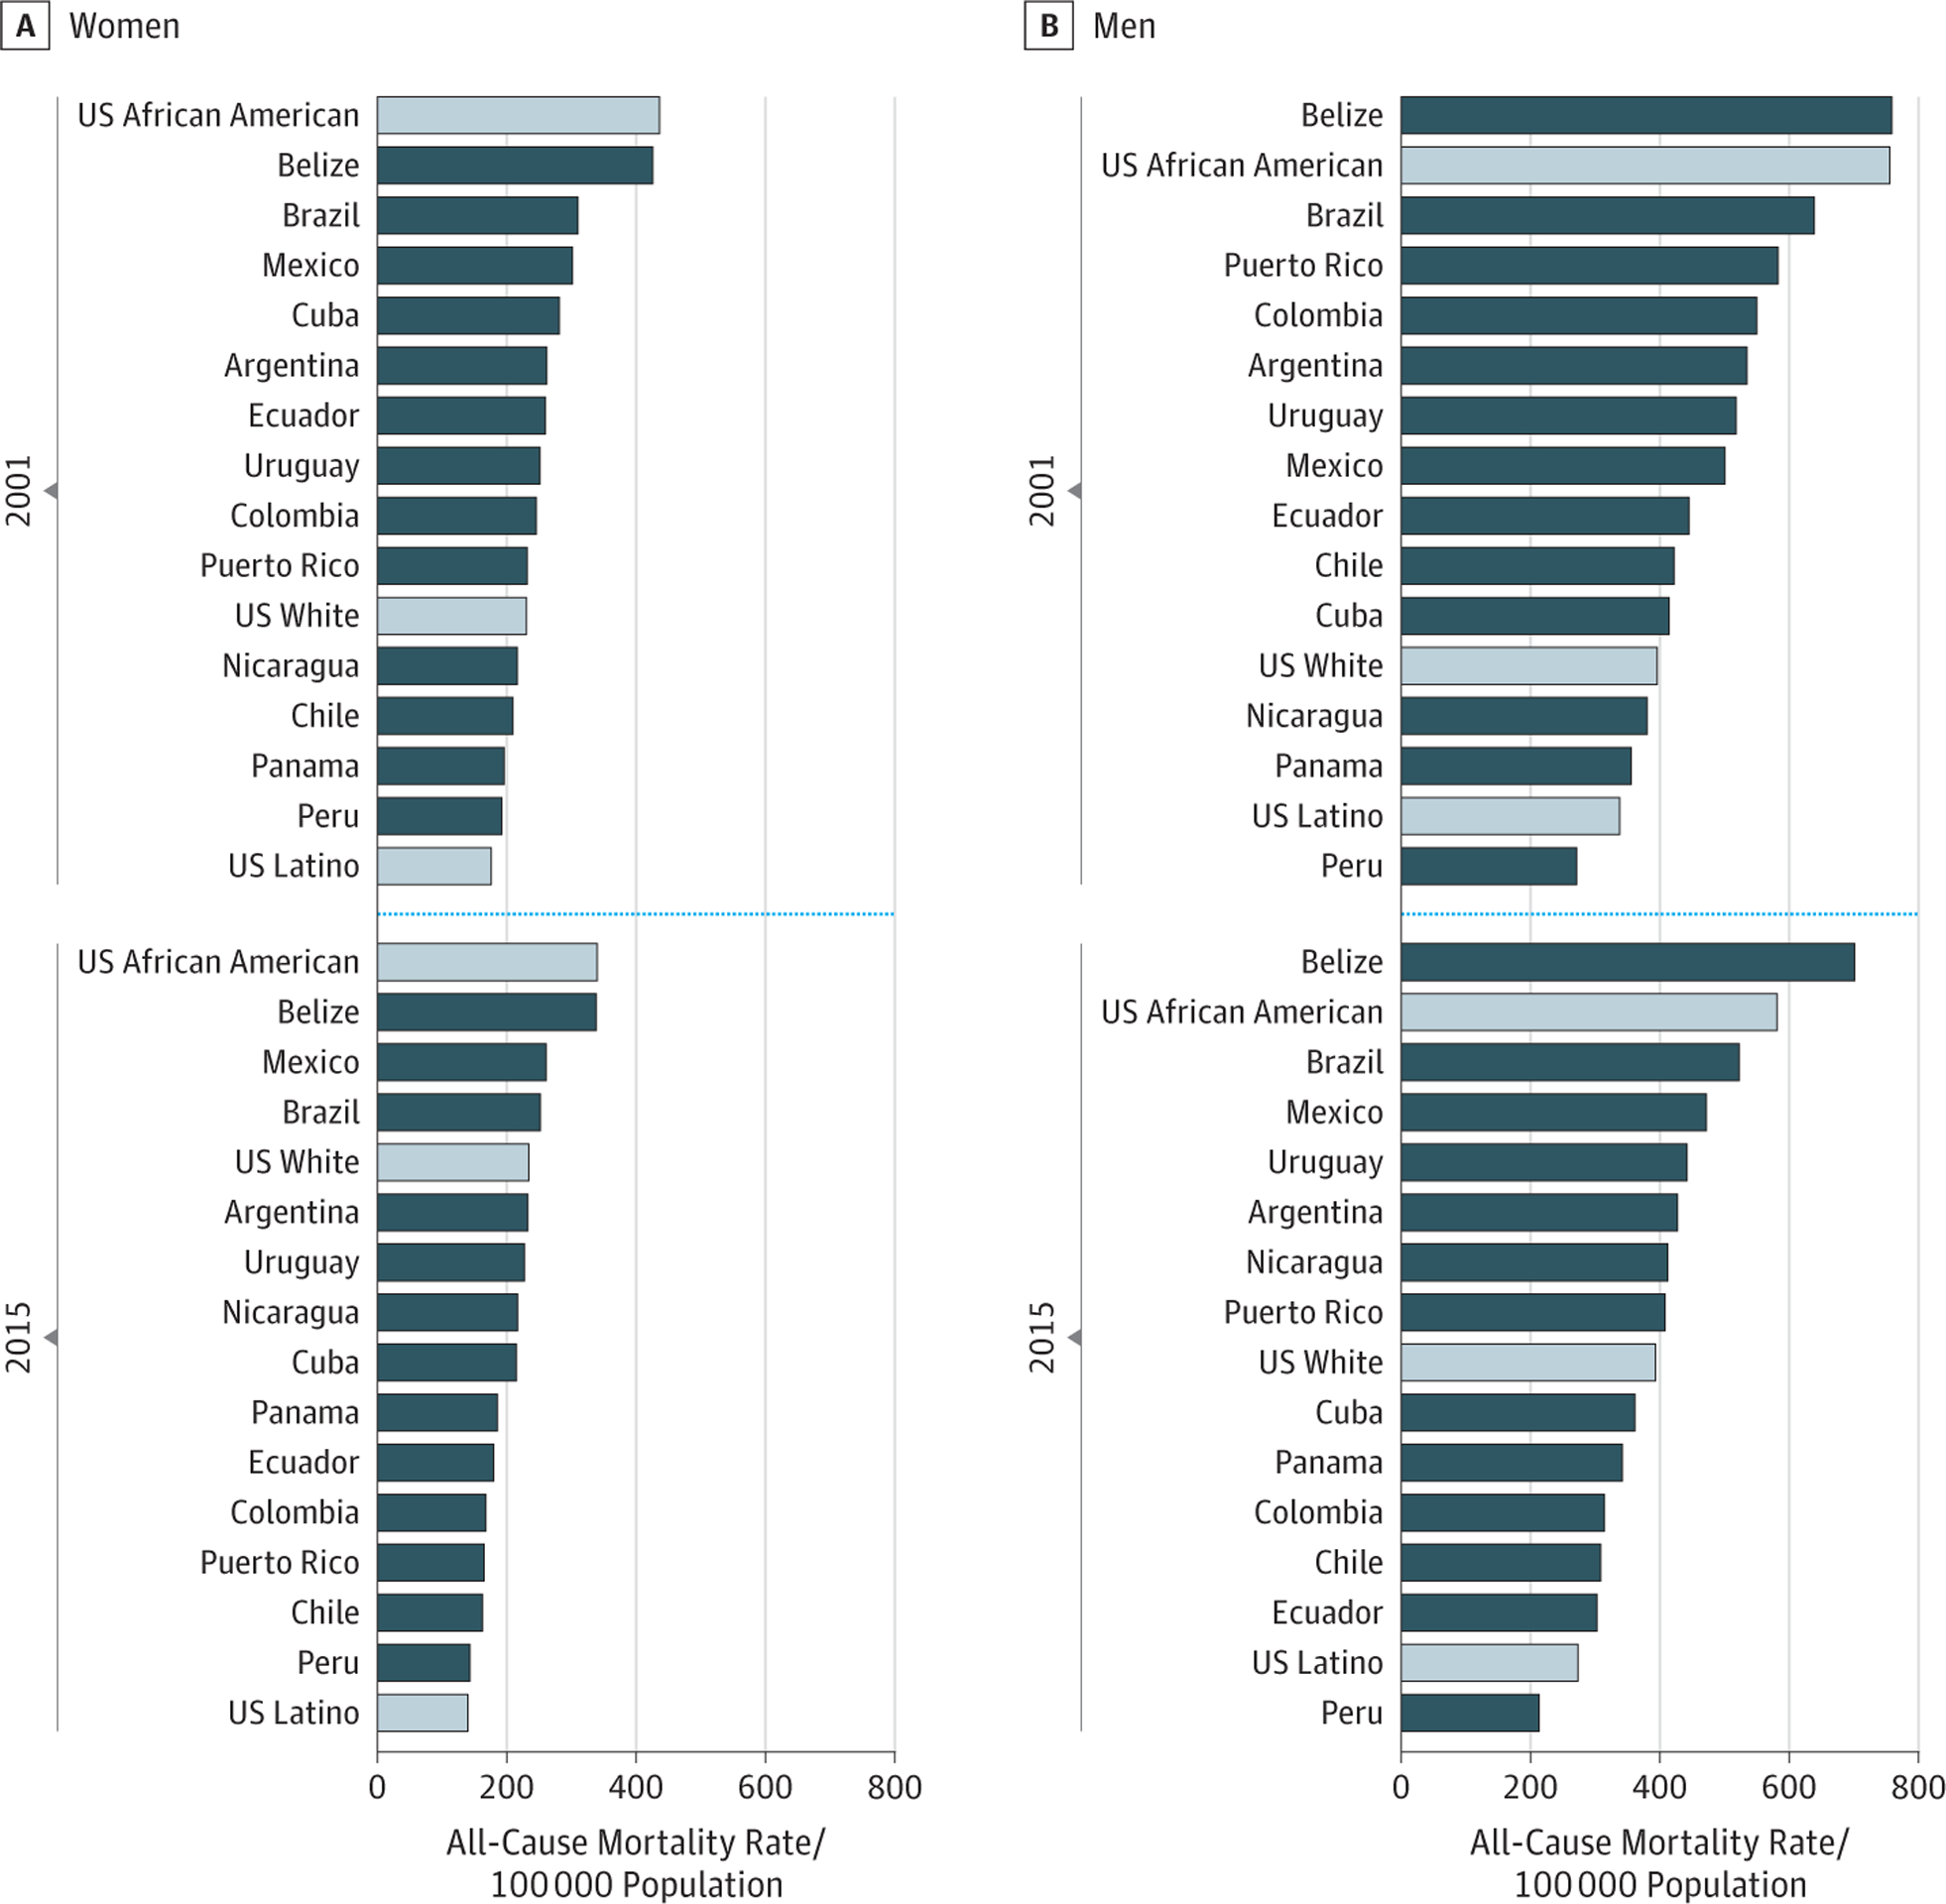
Results: During 2001 to 2015, 22 million deaths (8 million women and 14 million men) occurred among individuals aged 20 to 64 years in the selected populations. Among women, US Latina individuals had the lowest premature mortality rates (ASMR for 2015, 144 deaths per 100 000 population) and US African American women had the highest premature mortality rate (ASMR for 2015, 340 deaths per 100 000 population) of the 16 populations studied. Rates among US white women shifted from the sixth lowest in 2001 (ASMR, 231 deaths per 100 000 population) to the 12th lowest in 2015 (ASMR, 235 deaths per 100 000 population). Among men, Peru had the lowest premature mortality rates (ASMR for 2015, 219 deaths per 100 000 population), and Belize had the highest premature mortality rates (ASMR for 2015, 702 deaths per 100 000 population). White men in the United States shifted from the fifth lowest rates in 2001 (ASMR, 396 deaths per 100 000 population) to the eighth lowest rates in 2015 (ASMR, 394 deaths per 100 000 population). Rates for both women and men decreased in all the populations studied from 2001 to 2015 (average annual percentage change range, 0.4% to 3.8% per year) except among US white populations, for which the rate plateaued (average annual percentage change, 0.02% per year [95% CI, -0.3% to 0.2% per year] for women; -0.2% per year [95% CI, -0.4% to 0.0% per year] for men) and among Nicaraguan men, for whom the rates increased (0.6% per year [95% CI, 0.2% to 1.0% per year]). The populations with the lowest mortality rates in 2015 had lower rates from all major causes, but rates were particularly lower for heart disease (21 deaths per 100 000 population) and cancer (50 deaths per 100 000 population).
Conclusions and relevance: Premature mortality rates are lower for US Latino populations and several Latin American countries than for US white populations, suggesting that there may be a broader Latin American paradox. This analysis also highlights the high premature mortality rates among US African American populations, especially women, compared with many Latin American populations.
Figures

Comment in
-
A Commentary on the Latin American Paradox.JAMA Netw Open. 2020 Feb 5;3(2):e1921165. doi: 10.1001/jamanetworkopen.2019.21165. JAMA Netw Open. 2020. PMID: 32049288 No abstract available.
References
-
- US Census Bureau. Hispanic heritage month 2018. https://www.census.gov/newsroom/facts-for-features/2018/hispanic-heritag.... Published September 13, 2018. Accessed May 15, 2019.
Publication types
MeSH terms
Grants and funding
LinkOut - more resources
Full Text Sources
