. 2020 Feb 12;15(2):e0228851.
doi: 10.1371/journal.pone.0228851. eCollection 2020.

Pre-treatment EMG can be used to model post-treatment muscle coordination during walking in children with cerebral palsy

Affiliations

Pre-treatment EMG can be used to model post-treatment muscle coordination during walking in children with cerebral palsy

Lorenzo Pitto et al. PLoS One. .

Abstract

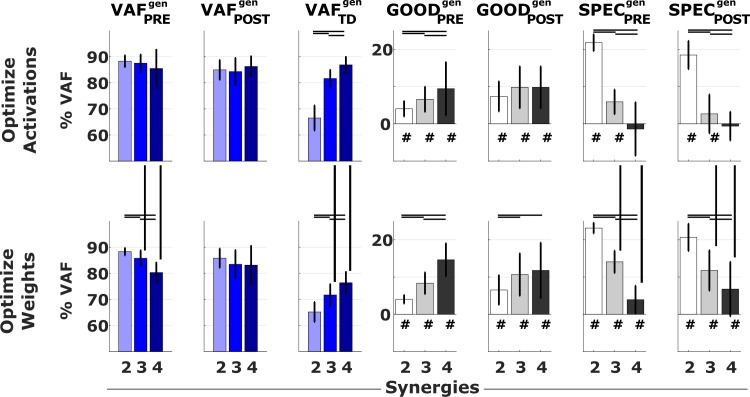
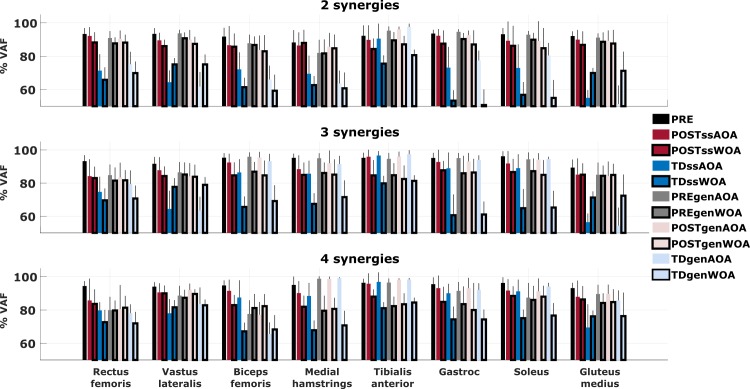
When treating children with Cerebral Palsy (CP), computational simulations based on musculoskeletal models have a great potential in assisting the clinical decision-making process towards the most promising treatments. In particular, predictive simulations could be used to predict and compare the functional outcome of a series of candidate interventions. In order to be able to benefit from these predictive simulations however, it is important to know how much information about the post-treatment patient's motor control could be gathered from data available before the intervention. Within this paper, we quantified how much of the muscle activity measured after a treatment could be explained by subject-specific muscle synergies computed from EMG data collected before the intervention. We also investigated whether generic synergies could be used, in case no EMG data is available when running predictive simulations, to reproduce both pre- and post-treatment muscle activity in children with CP. Subject-specific synergies proved to be a good indicator of the patient's post-treatment motor control, explaining on average more than 85% of the post-treatment muscle activity, compared to an average of 94% when applied to the original pre-treatment data. Generic synergies explained 84% of the pre-treatment and 83% of the post-treatment muscle activity on average, but performed relatively well for patients with low selective motor control and poorly in patients with more selectivity. Our results suggest that subject-specific muscle synergies computed from pre-treatment EMG data could be used with confidence to represent the post-treatment motor control of children with CP during walking. In addition, when performing simulations involving patients with a low selective motor control, generic synergies could be a valid alternative.


Conflict of interest statement

The authors have declared that no competing interests exist.

Figures

Fig 1
Fig 1. Selectivity, spasticity and strength scores.
Scores for Selectivity, Spasticity and Strength from the subjects, grouped according to the number of synergies. For the Selectivity score, 2 is the maximum selectivity. For the Spasticity score, 0 means no spasticity and 2 is the maximum. For the Strength score, 5 is the maximum. Black lines indicates significant differences between two quantities (p<0.05).
Fig 2
Fig 2. VAF values and number of synergies.
On the left, mean and standard deviations for the VAF values in the PRE, POST and TD conditions, split acoording to the treatment and the reconstruction method. There were no significant differences in the VAF values between the BOTOX and SEMLS groupsBlack lines indicate significant differences (p<0.05). On the right, number of synergies explaining the pre-treatment EMG data.
Fig 3
Fig 3. VAF when using subject–specific synergies.
Results from the EMG reconstructions using pre-treatment muscle synergies. Colored bars report mean and standard deviation of the VAF values in the PRE, POST and TD conditions. Values for VAFPRE are defined during synergy extraction with NNMF. Grey bars report the mean and standard deviations of the differences GOOD = VAFPRE−VAFPOST and SPEC = VAFPOST−VAFTD computed on a subject-by-subject basis. Black lines indicate significant differences (p<0.05). The symbol # indicates values of GOOD and SPEC that are significantly (p<0.05) greater than zero.
Fig 4
Fig 4. Composition of the generic synergies.
Weights and activations for the extracted sets of generic synergies. Muscle names: 1 Rectus femoris, 2 Vastus lateralis, 3 Biceps femoris, 4 medial hamstrings, 5 Tibialis anterior, 6 Gastrocnemius, 7 Soleus, 8 Gluteus medius.
Fig 5
Fig 5. VAF when using the generic synergies.
Results from the EMG reconstructions using generic synergies. Colored bars report mean and standard deviation of the VAF values in the PRE, POST and TD conditions. Grey bars report the differences GOODPREgen = VAFPRE−VAFPREgen, GOODPOSTgen = VAFPRE−VAFPOSTgen, SPECPREgen = VAFPREgen–VAFTDgen and SPECPOSTgen = VAFPOSTgen–VAFTDgen. Black lines indicate significant differences (p<0.05). The symbol # indicates values of GOOD and SPEC that are significantly (p<0.05) greater than zero.
Fig 6
Fig 6. VAF computed independently for each of the analyzed muscles.
Results from the EMG reconstructions using both subject-specific and generic synergies with both approaches, reported separately for each muscle. ss refers to the use of subject–specific synergies, gen to the use of generic synergies. AOA refers to the Activation Optinization Approach, WOA to the Weight Optimization Approach. Values for VAFPRE are defined during synergy extraction with NNMF.
Fig 7
Fig 7. Results from the stepwise regression analysis.
Results are reported for each of the dependent variables. The bar graphs report the effect sizes of the statistically significant independent variables of the fitted models. In the scatter plots the dependent variables are plotted as a function of each of the independent variables included in the model. SPEC specificity (%); GOOD goodness (%); IMP impairment of the subject pre-treatment (%); Age at time of surgery (years); STR average pre-treatment strength report; dW change in synergy weights expressed as the correlation coefficient between pre- and post-treatment; dH change in synergy activation profiles expressed as RMSE between pre- and post-treatment; GPSPRE gait profile score pre-treatment (degrees); GPSdiff difference between GPSPRE and GPSPOST (degrees); BOT1 rectus femoris injection (yes/no); tr treatment (BOTOX/SEMLS). Subscripts W and H indicate that the signal reconstruction was performed optimizing the weights or the activation profiles, respectively.

Similar articles

Cited by

References

    1. Graham HK, Rosenbaum P, Paneth N, Dan B, Lin J, Damiano DL, et al. Cerebral palsy. Nat Rev Dis Prim. 2016;2: 15082 10.1038/nrdp.2015.82 - DOI - PMC - PubMed
    1. Colver A, Fairhurst C, Pharoah POD. Cerebral palsy. Lancet. 2014;383: 1240–1249. 10.1016/S0140-6736(13)61835-8 - DOI - PubMed
    1. Hanna SE, Rosenbaum PL, Bartlett DJ, Palisano RJ, Walter SD, Avery L, et al. Stability and decline in gross motor function among children and youth with cerebral palsy aged 2 to 21 years. Dev Med Child Neurol. 2009;51: 295–302. 10.1111/j.1469-8749.2008.03196.x - DOI - PubMed
    1. Narayanan UG. Management of children with ambulatory cerebral palsy: An evidence-based review. J Pediatr Orthop. 2012;32: S172–S181. 10.1097/BPO.0b013e31825eb2a6 - DOI - PubMed
    1. Fairhurst C. Cerebral palsy: The whys and hows. Archives of Disease in Childhood: Education and Practice Edition. 2012. pp. 122–131. 10.1136/edpract-2011-300593 - DOI - PubMed

Publication types